Basic Stats
| Portfolio Value | $ 303,785,704 |
| Current Positions | 34 |
Latest Holdings, Performance, AUM (from 13F, 13D)
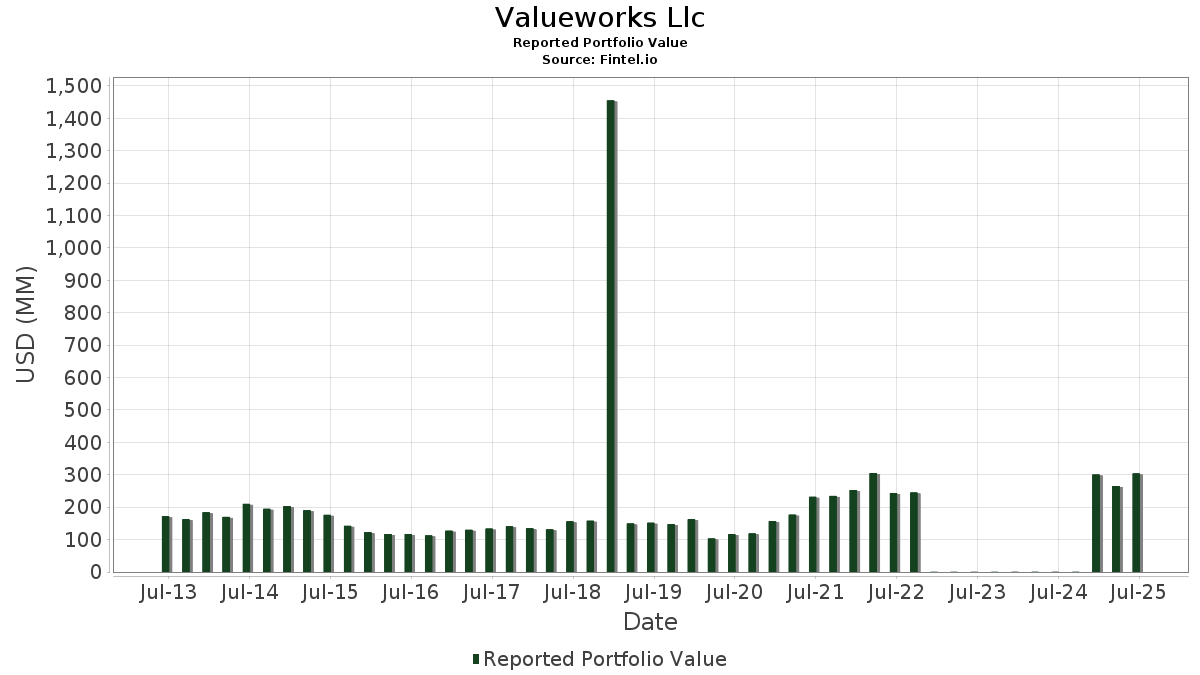
Valueworks Llc has disclosed 34 total holdings in their latest SEC filings. Most recent portfolio value is calculated to be $ 303,785,704 USD. Actual Assets Under Management (AUM) is this value plus cash (which is not disclosed). Valueworks Llc’s top holdings are Joby Aviation, Inc. (US:JOBY) , Valaris Limited (US:VAL) , Maui Land & Pineapple Company, Inc. (US:MLP) , Chord Energy Corporation (US:CHRD) , and Rivian Automotive, Inc. (US:RIVN) . Valueworks Llc’s new positions include Maplebear Inc. (US:CART) , Vital Energy, Inc. (US:VTLE) , Hudson Pacific Properties, Inc. (US:HPP) , . Valueworks Llc’s top industries are "Wholesale Trade-non-durable Goods" (sic 51) , "Water Transportation" (sic 44) , and "Oil And Gas Extraction" (sic 13) .
Top Increases This Quarter
We use the change in the portfolio allocation because this is the most meaningful metric. Changes can be due to trades or changes in share prices.
| Security | Shares (MM) |
Value (MM$) |
Portfolio % | ΔPortfolio % |
|---|---|---|---|---|
| 0.23 | 10.45 | 3.4404 | 3.4404 | |
| 2.36 | 24.89 | 8.1943 | 2.8465 | |
| 0.26 | 15.24 | 5.0154 | 1.3813 | |
| 0.23 | 8.88 | 2.9223 | 1.0256 | |
| 0.12 | 14.19 | 4.6698 | 0.8707 | |
| 0.16 | 2.53 | 0.8321 | 0.8321 | |
| 0.81 | 2.23 | 0.7343 | 0.7343 | |
| 0.48 | 20.07 | 6.6069 | 0.6889 | |
| 0.05 | 11.80 | 3.8836 | 0.0564 | |
| 2.39 | 6.70 | 2.2051 | 0.0446 |
Top Decreases This Quarter
We use the change in the portfolio allocation because this is the most meaningful metric. Changes can be due to trades or changes in share prices.
| Security | Shares (MM) |
Value (MM$) |
Portfolio % | ΔPortfolio % |
|---|---|---|---|---|
| 0.18 | 17.27 | 5.6852 | -1.8988 | |
| 0.69 | 16.43 | 5.4094 | -1.7097 | |
| 0.00 | 0.00 | -1.0842 | ||
| 0.37 | 8.62 | 2.8388 | -0.9963 | |
| 2.23 | 9.67 | 3.1818 | -0.9600 | |
| 0.06 | 2.98 | 0.9825 | -0.9434 | |
| 0.31 | 7.96 | 2.6197 | -0.5242 | |
| 0.30 | 11.91 | 3.9210 | -0.5101 | |
| 0.53 | 10.59 | 3.4860 | -0.4609 | |
| 0.06 | 9.31 | 3.0635 | -0.3040 |
13D/G Filings
This is a list of 13D and 13G filings made in the last year (if any). Click the link icon to see the full transaction history. Green rows indicate new positions. Red rows indicate closed positions.
| File Date | Form | Security | Prev Shares |
Current Shares |
ΔShares % | % Ownership |
% ΔOwnership | |
|---|---|---|---|---|---|---|---|---|
| 2025-08-14 | MSB / Mesabi Trust | 824,397 | 685,846 | -16.81 | 5.23 | -16.72 | ||
| 2025-08-14 | TUSK / Mammoth Energy Services, Inc. | 3,136,371 | 2,389,031 | -23.83 | 4.96 | -23.93 |
13F and Fund Filings
This form was filed on 2025-08-12 for the reporting period 2025-06-30. Click the link icon to see the full transaction history.
Upgrade to unlock premium data and export to Excel ![]() .
.
| Security | Type | Avg Share Price | Shares (MM) |
ΔShares (%) |
ΔShares (%) |
Value ($MM) |
Portfolio (%) |
ΔPortfolio (%) |
|
|---|---|---|---|---|---|---|---|---|---|
| JOBY / Joby Aviation, Inc. | 2.36 | 0.15 | 24.89 | 75.51 | 8.1943 | 2.8465 | |||
| VAL / Valaris Limited | 0.48 | 19.22 | 20.07 | 27.88 | 6.6069 | 0.6889 | |||
| MLP / Maui Land & Pineapple Company, Inc. | 0.97 | 5.73 | 17.68 | 9.47 | 5.8205 | -0.2699 | |||
| CHRD / Chord Energy Corporation | 0.18 | -0.10 | 17.27 | -14.14 | 5.6852 | -1.8988 | |||
| RIVN / Rivian Automotive, Inc. | 1.25 | -0.16 | 17.12 | 10.19 | 5.6363 | -0.2226 | |||
| MSB / Mesabi Trust | 0.69 | -1.20 | 16.43 | -12.97 | 5.4094 | -1.7097 | |||
| AL / Air Lease Corporation | 0.26 | 30.57 | 15.24 | 58.08 | 5.0154 | 1.3813 | |||
| TDW / Tidewater Inc. | 0.32 | 0.92 | 14.88 | 10.14 | 4.8983 | -0.1957 | |||
| MU / Micron Technology, Inc. | 0.12 | -0.74 | 14.19 | 40.80 | 4.6698 | 0.8707 | |||
| HY / Hyster-Yale, Inc. | 0.30 | 5.84 | 11.91 | 1.36 | 3.9210 | -0.5101 | |||
| AMZN / Amazon.com, Inc. | 0.05 | 0.80 | 11.80 | 16.23 | 3.8836 | 0.0564 | |||
| CDLR / Cadeler A/S - Depositary Receipt (Common Stock) | 0.53 | 0.10 | 10.59 | 1.17 | 3.4860 | -0.4609 | |||
| CART / Maplebear Inc. | 0.23 | 10.45 | 3.4404 | 3.4404 | |||||
| MBI / MBIA Inc. | 2.23 | 0.97 | 9.67 | -12.00 | 3.1818 | -0.9600 | |||
| QCOM / QUALCOMM Incorporated | 0.06 | 0.51 | 9.31 | 4.20 | 3.0635 | -0.3040 | |||
| SPR / Spirit AeroSystems Holdings, Inc. | 0.23 | 59.41 | 8.88 | 76.48 | 2.9223 | 1.0256 | |||
| UNFI / United Natural Foods, Inc. | 0.37 | -0.37 | 8.62 | -15.22 | 2.8388 | -0.9963 | |||
| CBL / CBL & Associates Properties, Inc. | 0.31 | -0.08 | 7.96 | -4.56 | 2.6197 | -0.5242 | |||
| TUSK / Mammoth Energy Services, Inc. | 2.39 | -14.95 | 6.70 | 16.89 | 2.2051 | 0.0446 | |||
| SBLK / Star Bulk Carriers Corp. | 0.37 | 0.36 | 6.31 | 11.26 | 2.0760 | -0.0612 | |||
| GNW / Genworth Financial, Inc. | 0.72 | -0.24 | 5.63 | 9.47 | 1.8531 | -0.0858 | |||
| CMCSA / Comcast Corporation | 0.14 | 0.45 | 5.00 | -2.85 | 1.6474 | -0.2948 | |||
| LNG / Cheniere Energy, Inc. | 0.02 | -8.24 | 4.93 | -3.43 | 1.6239 | -0.3022 | |||
| NYT / The New York Times Company | 0.09 | -1.63 | 4.90 | 11.02 | 1.6123 | -0.0510 | |||
| NE / Noble Corporation plc | 0.14 | 0.00 | 3.59 | 12.04 | 1.1827 | -0.0266 | |||
| AAPL / Apple Inc. | 0.02 | -2.35 | 3.24 | -9.79 | 1.0649 | -0.2875 | |||
| AMGN / Amgen Inc. | 0.01 | 0.92 | 3.13 | -9.58 | 1.0319 | -0.2750 | |||
| EQT / EQT Corporation | 0.05 | -13.96 | 3.12 | -6.08 | 1.0273 | -0.2256 | |||
| GLW / Corning Incorporated | 0.06 | -49.13 | 2.98 | -41.57 | 0.9825 | -0.9434 | |||
| VTLE / Vital Energy, Inc. | 0.16 | 2.53 | 0.8321 | 0.8321 | |||||
| HPP / Hudson Pacific Properties, Inc. | 0.81 | 2.23 | 0.7343 | 0.7343 | |||||
| IVZ / Invesco Ltd. | 0.10 | -1.78 | 1.55 | 2.11 | 0.5090 | -0.0620 | |||
| GNK / Genco Shipping & Trading Limited | 0.06 | 0.00 | 0.72 | -2.18 | 0.2366 | -0.0404 | |||
| CQP / Cheniere Energy Partners, L.P. - Limited Partnership | 0.00 | -14.41 | 0.27 | -27.32 | 0.0876 | -0.0506 | |||
| BAC.PRL / Bank of America Corporation - Preferred Stock | 0.00 | -100.00 | 0.00 | 0.0000 | |||||
| AXP / American Express Company | 0.00 | -100.00 | 0.00 | -100.00 | -1.0842 |