Basic Stats
| Portfolio Value | $ 463,547,657 |
| Current Positions | 147 |
Latest Holdings, Performance, AUM (from 13F, 13D)
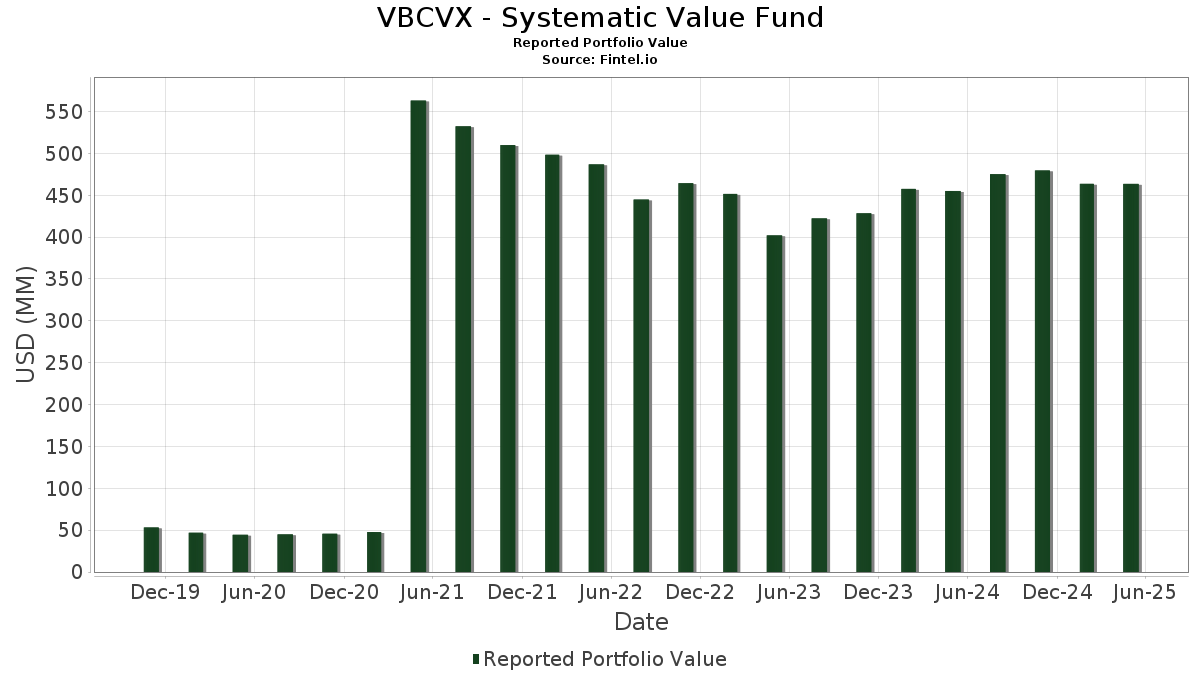
VBCVX - Systematic Value Fund has disclosed 147 total holdings in their latest SEC filings. Most recent portfolio value is calculated to be $ 463,547,657 USD. Actual Assets Under Management (AUM) is this value plus cash (which is not disclosed). VBCVX - Systematic Value Fund’s top holdings are Berkshire Hathaway Inc. (US:BRK.B) , JPMorgan Chase & Co. (US:JPM) , Johnson & Johnson (US:JNJ) , Walmart Inc. (US:WMT) , and Exxon Mobil Corporation (US:XOM) . VBCVX - Systematic Value Fund’s new positions include Boston Scientific Corporation (US:BSX) , Amentum Holdings, Inc. (US:AMTM) , Marvell Technology, Inc. (US:MRVL) , .
Top Increases This Quarter
We use the change in the portfolio allocation because this is the most meaningful metric. Changes can be due to trades or changes in share prices.
| Security | Shares (MM) |
Value (MM$) |
Portfolio % | ΔPortfolio % |
|---|---|---|---|---|
| 4.69 | 1.0241 | 1.0241 | ||
| 4.69 | 1.0241 | 1.0241 | ||
| 0.02 | 4.66 | 1.0164 | 0.9158 | |
| 0.04 | 7.28 | 1.5880 | 0.8119 | |
| 0.03 | 3.47 | 0.7566 | 0.7566 | |
| 0.04 | 3.43 | 0.7484 | 0.7484 | |
| 0.09 | 5.13 | 1.1199 | 0.5940 | |
| 0.09 | 3.51 | 0.7650 | 0.5653 | |
| 0.01 | 3.37 | 0.7347 | 0.4613 | |
| 0.02 | 3.12 | 0.6813 | 0.3816 |
Top Decreases This Quarter
We use the change in the portfolio allocation because this is the most meaningful metric. Changes can be due to trades or changes in share prices.
| Security | Shares (MM) |
Value (MM$) |
Portfolio % | ΔPortfolio % |
|---|---|---|---|---|
| 0.00 | 1.51 | 0.3294 | -1.1807 | |
| 0.01 | 3.96 | 0.8645 | -0.4812 | |
| 0.01 | 1.64 | 0.3589 | -0.4469 | |
| 0.01 | 3.84 | 0.8391 | -0.4215 | |
| 0.11 | 10.72 | 2.3390 | -0.4077 | |
| 0.03 | 1.93 | 0.4218 | -0.3688 | |
| 0.00 | 0.91 | 0.1991 | -0.3506 | |
| 0.04 | 4.27 | 0.9321 | -0.2928 | |
| 0.04 | 20.76 | 4.5307 | -0.2919 | |
| 0.07 | 11.00 | 2.4003 | -0.2791 |
13F and Fund Filings
This form was filed on 2025-07-28 for the reporting period 2025-05-31. Click the link icon to see the full transaction history.
Upgrade to unlock premium data and export to Excel ![]() .
.
| Security | Type | Avg Share Price | Shares (MM) |
ΔShares (%) |
ΔShares (%) |
Value ($MM) |
Portfolio (%) |
ΔPortfolio (%) |
|
|---|---|---|---|---|---|---|---|---|---|
| BRK.B / Berkshire Hathaway Inc. | 0.04 | -5.22 | 20.76 | -7.04 | 4.5307 | -0.2919 | |||
| JPM / JPMorgan Chase & Co. | 0.07 | 0.00 | 17.80 | -0.25 | 3.8845 | 0.0314 | |||
| JNJ / Johnson & Johnson | 0.07 | -5.76 | 11.00 | -11.36 | 2.4003 | -0.2791 | |||
| WMT / Walmart Inc. | 0.11 | -15.83 | 10.72 | -15.74 | 2.3390 | -0.4077 | |||
| XOM / Exxon Mobil Corporation | 0.09 | 0.00 | 8.96 | -8.11 | 1.9558 | -0.1502 | |||
| SPGI / S&P Global Inc. | 0.01 | 6.26 | 7.54 | 2.11 | 1.6459 | 0.0508 | |||
| PM / Philip Morris International Inc. | 0.04 | 74.08 | 7.28 | 102.48 | 1.5880 | 0.8119 | |||
| CMCSA / Comcast Corporation | 0.19 | 0.00 | 6.58 | -3.66 | 1.4370 | -0.0388 | |||
| APH / Amphenol Corporation | 0.07 | 0.00 | 6.54 | 35.03 | 1.4279 | 0.3816 | |||
| CME / CME Group Inc. | 0.02 | -14.93 | 6.52 | -3.12 | 1.4229 | -0.0304 | |||
| ETN / Eaton Corporation plc | 0.02 | 0.00 | 6.46 | 9.16 | 1.4101 | 0.1320 | |||
| SYK / Stryker Corporation | 0.02 | -2.11 | 6.39 | -3.00 | 1.3954 | -0.0282 | |||
| GILD / Gilead Sciences, Inc. | 0.06 | 17.20 | 6.15 | 12.86 | 1.3413 | 0.1654 | |||
| DIS / The Walt Disney Company | 0.05 | 0.00 | 6.12 | -0.67 | 1.3357 | 0.0052 | |||
| BK / The Bank of New York Mellon Corporation | 0.07 | -4.10 | 6.06 | -4.47 | 1.3235 | -0.0473 | |||
| PG / The Procter & Gamble Company | 0.03 | 0.00 | 5.92 | -2.26 | 1.2919 | -0.0161 | |||
| IBM / International Business Machines Corporation | 0.02 | 0.00 | 5.75 | 2.62 | 1.2558 | 0.0450 | |||
| GD / General Dynamics Corporation | 0.02 | -1.51 | 5.60 | 8.59 | 1.2225 | 0.1085 | |||
| CW / Curtiss-Wright Corporation | 0.01 | 0.00 | 5.57 | 36.81 | 1.2152 | 0.3364 | |||
| EME / EMCOR Group, Inc. | 0.01 | 11.27 | 5.42 | 28.40 | 1.1823 | 0.2712 | |||
| SYF / Synchrony Financial | 0.09 | 121.77 | 5.13 | 110.72 | 1.1199 | 0.5940 | |||
| ROP / Roper Technologies, Inc. | 0.01 | -5.91 | 5.05 | -8.21 | 1.1030 | -0.0859 | |||
| O / Realty Income Corporation | 0.09 | -0.60 | 5.04 | -1.33 | 1.1008 | -0.0030 | |||
| PGR / The Progressive Corporation | 0.02 | -16.80 | 4.82 | -15.94 | 1.0523 | -0.1864 | |||
| STAG / STAG Industrial, Inc. | 0.13 | 8.79 | 4.71 | 7.58 | 1.0286 | 0.0825 | |||
| FIXED INC CLEARING CORP.REPO / RA (000000000) | 4.69 | 1.0241 | 1.0241 | ||||||
| FIXED INC CLEARING CORP.REPO / RA (000000000) | 4.69 | 1.0241 | 1.0241 | ||||||
| RMD / ResMed Inc. | 0.02 | 881.12 | 4.66 | 865.98 | 1.0164 | 0.9158 | |||
| MAA / Mid-America Apartment Communities, Inc. | 0.03 | -7.63 | 4.61 | -13.94 | 1.0052 | -0.1505 | |||
| NFG / National Fuel Gas Company | 0.05 | -29.51 | 4.54 | -22.62 | 0.9901 | -0.2761 | |||
| AMGN / Amgen Inc. | 0.02 | 8.34 | 4.52 | 1.35 | 0.9858 | 0.0233 | |||
| GL / Globe Life Inc. | 0.04 | -16.54 | 4.40 | -20.19 | 0.9613 | -0.2304 | |||
| PPG / PPG Industries, Inc. | 0.04 | 0.00 | 4.39 | -2.14 | 0.9580 | -0.0106 | |||
| SNA / Snap-on Incorporated | 0.01 | -4.79 | 4.36 | -10.48 | 0.9510 | -0.1003 | |||
| JAZZ / Jazz Pharmaceuticals plc | 0.04 | 0.00 | 4.27 | -24.70 | 0.9321 | -0.2928 | |||
| BRO / Brown & Brown, Inc. | 0.04 | -19.35 | 4.26 | -23.19 | 0.9306 | -0.2682 | |||
| PEP / PepsiCo, Inc. | 0.03 | 0.00 | 4.23 | -14.33 | 0.9222 | -0.1431 | |||
| ADC / Agree Realty Corporation | 0.06 | -12.77 | 4.19 | -11.01 | 0.9156 | -0.1023 | |||
| TT / Trane Technologies plc | 0.01 | 35.23 | 4.14 | 64.52 | 0.9040 | 0.3603 | |||
| PKG / Packaging Corporation of America | 0.02 | 0.00 | 4.12 | -9.35 | 0.8992 | -0.0823 | |||
| FOXA / Fox Corporation | 0.07 | 17.54 | 4.10 | 12.10 | 0.8956 | 0.1051 | |||
| MTG / MGIC Investment Corporation | 0.15 | 0.00 | 4.10 | 7.47 | 0.8946 | 0.0710 | |||
| LDOS / Leidos Holdings, Inc. | 0.03 | 0.84 | 4.09 | 15.25 | 0.8925 | 0.1261 | |||
| BAC / Bank of America Corporation | 0.09 | 0.00 | 4.02 | -4.26 | 0.8776 | -0.0295 | |||
| UNH / UnitedHealth Group Incorporated | 0.01 | 0.00 | 3.96 | -36.45 | 0.8645 | -0.4812 | |||
| JHG / Janus Henderson Group plc | 0.11 | 0.00 | 3.96 | -13.91 | 0.8634 | -0.1289 | |||
| STT / State Street Corporation | 0.04 | 0.00 | 3.90 | -2.96 | 0.8506 | -0.0168 | |||
| MCD / McDonald's Corporation | 0.01 | -35.29 | 3.84 | -34.14 | 0.8391 | -0.4215 | |||
| TROW / T. Rowe Price Group, Inc. | 0.04 | -3.92 | 3.77 | -14.94 | 0.8224 | -0.1343 | |||
| NEM / Newmont Corporation | 0.07 | -15.39 | 3.74 | 4.12 | 0.8160 | 0.0405 | |||
| CTSH / Cognizant Technology Solutions Corporation | 0.05 | 0.00 | 3.68 | -2.80 | 0.8025 | -0.0145 | |||
| RTX / RTX Corporation | 0.03 | 0.00 | 3.67 | 2.63 | 0.8014 | 0.0287 | |||
| OVV / Ovintiv Inc. | 0.10 | 0.00 | 3.57 | -17.57 | 0.7801 | -0.1564 | |||
| VIRT / Virtu Financial, Inc. | 0.09 | 244.88 | 3.51 | 279.33 | 0.7650 | 0.5653 | |||
| UTHR / United Therapeutics Corporation | 0.01 | 0.00 | 3.50 | -0.37 | 0.7629 | 0.0052 | |||
| EXEL / Exelixis, Inc. | 0.08 | -14.22 | 3.49 | -4.60 | 0.7613 | -0.0281 | |||
| BSX / Boston Scientific Corporation | 0.03 | 3.47 | 0.7566 | 0.7566 | |||||
| INCY / Incyte Corporation | 0.05 | 0.00 | 3.45 | -11.50 | 0.7525 | -0.0887 | |||
| TPR / Tapestry, Inc. | 0.04 | 3.43 | 0.7484 | 0.7484 | |||||
| CEG / Constellation Energy Corporation | 0.01 | 117.59 | 3.37 | 165.88 | 0.7347 | 0.4613 | |||
| MDT / Medtronic plc | 0.04 | 73.40 | 3.36 | 56.36 | 0.7328 | 0.2691 | |||
| GM / General Motors Company | 0.07 | 0.00 | 3.33 | 0.97 | 0.7272 | 0.0146 | |||
| AYI / Acuity Inc. | 0.01 | 41.81 | 3.25 | 24.05 | 0.7094 | 0.1435 | |||
| MU / Micron Technology, Inc. | 0.03 | -22.00 | 3.17 | -21.32 | 0.6920 | -0.1781 | |||
| NRG / NRG Energy, Inc. | 0.02 | 52.51 | 3.12 | 125.02 | 0.6813 | 0.3816 | |||
| ACI / Albertsons Companies, Inc. | 0.14 | 0.00 | 3.09 | 5.67 | 0.6752 | 0.0429 | |||
| CSCO / Cisco Systems, Inc. | 0.05 | -31.35 | 3.09 | -6.93 | 0.6745 | -0.0556 | |||
| EMR / Emerson Electric Co. | 0.02 | 0.00 | 2.91 | -1.82 | 0.6361 | -0.0051 | |||
| KIM / Kimco Realty Corporation | 0.14 | 0.00 | 2.89 | -3.80 | 0.6302 | -0.0180 | |||
| PPC / Pilgrim's Pride Corporation | 0.06 | 0.00 | 2.87 | -9.59 | 0.6273 | -0.0594 | |||
| DELL / Dell Technologies Inc. | 0.03 | 0.00 | 2.86 | 8.29 | 0.6245 | 0.0538 | |||
| AXP / American Express Company | 0.01 | 0.00 | 2.78 | -2.29 | 0.6061 | -0.0077 | |||
| TDG / TransDigm Group Incorporated | 0.00 | 0.00 | 2.77 | 7.42 | 0.6035 | 0.0475 | |||
| KMB / Kimberly-Clark Corporation | 0.02 | 0.00 | 2.72 | 1.23 | 0.5926 | 0.0134 | |||
| ACN / Accenture plc | 0.01 | 0.00 | 2.70 | -9.12 | 0.5897 | -0.0521 | |||
| BRX / Brixmor Property Group Inc. | 0.10 | 0.00 | 2.60 | -9.09 | 0.5673 | -0.0504 | |||
| HON / Honeywell International Inc. | 0.01 | 0.00 | 2.59 | 6.44 | 0.5664 | 0.0400 | |||
| ALSN / Allison Transmission Holdings, Inc. | 0.02 | 38.13 | 2.49 | 40.51 | 0.5445 | 0.1611 | |||
| RPM / RPM International Inc. | 0.02 | 0.00 | 2.42 | -8.12 | 0.5287 | -0.0406 | |||
| ATR / AptarGroup, Inc. | 0.02 | 0.00 | 2.38 | 7.93 | 0.5199 | 0.0433 | |||
| OMC / Omnicom Group Inc. | 0.03 | 0.00 | 2.29 | -11.27 | 0.5001 | -0.0575 | |||
| DOX / Amdocs Limited | 0.02 | 0.00 | 2.19 | 5.19 | 0.4774 | 0.0282 | |||
| EXE / Expand Energy Corporation | 0.02 | 67.91 | 2.18 | 97.29 | 0.4759 | 0.2371 | |||
| PARA / Paramount Global | 0.18 | 0.00 | 2.14 | 6.51 | 0.4680 | 0.0332 | |||
| HPQ / HP Inc. | 0.08 | 0.00 | 2.10 | -19.35 | 0.4587 | -0.1040 | |||
| MTDR / Matador Resources Company | 0.05 | 0.00 | 2.02 | -17.83 | 0.4406 | -0.0899 | |||
| AON / Aon plc | 0.01 | -3.53 | 2.01 | -8.34 | 0.4390 | -0.0182 | |||
| BHF / Brighthouse Financial, Inc. | 0.03 | 0.00 | 1.99 | 0.81 | 0.4351 | 0.0082 | |||
| BRBR / BellRing Brands, Inc. | 0.03 | -38.55 | 1.93 | -47.21 | 0.4218 | -0.3688 | |||
| MO / Altria Group, Inc. | 0.03 | 10.03 | 1.86 | 19.43 | 0.4051 | 0.0694 | |||
| WAB / Westinghouse Air Brake Technologies Corporation | 0.01 | 0.00 | 1.77 | 9.18 | 0.3868 | 0.0362 | |||
| GPC / Genuine Parts Company | 0.01 | -19.97 | 1.76 | -18.93 | 0.3851 | -0.0849 | |||
| UHS / Universal Health Services, Inc. | 0.01 | 0.00 | 1.68 | 8.59 | 0.3672 | 0.0327 | |||
| SNX / TD SYNNEX Corporation | 0.01 | -50.06 | 1.64 | -55.94 | 0.3589 | -0.4469 | |||
| NTRS / Northern Trust Corporation | 0.02 | 0.00 | 1.64 | -3.12 | 0.3587 | -0.0078 | |||
| FFIV / F5, Inc. | 0.01 | 0.00 | 1.63 | -2.45 | 0.3560 | -0.0050 | |||
| CHRW / C.H. Robinson Worldwide, Inc. | 0.02 | 43.32 | 1.63 | 35.41 | 0.3556 | 0.0957 | |||
| Aptiv PLC / EC (JE00BTDN8H13) | 0.02 | 0.00 | 1.57 | 2.62 | 0.3421 | 0.0122 | |||
| BLK / BlackRock, Inc. | 0.00 | -78.46 | 1.51 | -78.42 | 0.3294 | -1.1807 | |||
| EWBC / East West Bancorp, Inc. | 0.02 | 155.55 | 1.50 | 147.04 | 0.3278 | 0.1964 | |||
| ILMN / Illumina, Inc. | 0.02 | 1.57 | 1.49 | -5.86 | 0.3262 | -0.0167 | |||
| IAC / IAC Inc. | 0.04 | 320.27 | 1.45 | 227.48 | 0.3175 | 0.2214 | |||
| FNF / Fidelity National Financial, Inc. | 0.03 | 0.00 | 1.43 | -15.13 | 0.3111 | -0.0516 | |||
| MCK / McKesson Corporation | 0.00 | 0.00 | 1.41 | 12.42 | 0.3083 | 0.0368 | |||
| CAH / Cardinal Health, Inc. | 0.01 | 0.00 | 1.37 | 19.29 | 0.2997 | 0.0511 | |||
| CNXC / Concentrix Corporation | 0.02 | 1.36 | 0.2960 | 0.2960 | |||||
| SAIC / Science Applications International Corporation | 0.01 | -16.12 | 1.29 | -17.68 | 0.2826 | -0.0889 | |||
| BWA / BorgWarner Inc. | 0.04 | 59.19 | 1.23 | 77.04 | 0.2695 | 0.1188 | |||
| GRMN / Garmin Ltd. | 0.01 | 1.18 | 0.2568 | 0.2568 | |||||
| CPB / The Campbell's Company | 0.03 | 0.00 | 1.13 | -15.05 | 0.2466 | -0.0406 | |||
| CXT / Crane NXT, Co. | 0.02 | -36.09 | 1.11 | -38.65 | 0.2420 | -0.1481 | |||
| WFC / Wells Fargo & Company | 0.01 | 0.00 | 1.11 | -4.49 | 0.2412 | -0.0088 | |||
| AMTM / Amentum Holdings, Inc. | 0.05 | 1.09 | 0.2384 | 0.2384 | |||||
| HWM / Howmet Aerospace Inc. | 0.01 | 0.00 | 1.09 | 24.37 | 0.2374 | 0.0485 | |||
| AFL / Aflac Incorporated | 0.01 | -3.32 | 1.03 | -8.51 | 0.2253 | -0.0185 | |||
| TW / Tradeweb Markets Inc. | 0.01 | 0.00 | 1.00 | 6.73 | 0.2181 | 0.0159 | |||
| MOS / The Mosaic Company | 0.03 | -4.56 | 0.98 | 20.76 | 0.2146 | 0.0434 | |||
| WU / The Western Union Company | 0.11 | 0.00 | 0.98 | -14.39 | 0.2132 | -0.0330 | |||
| ELV / Elevance Health, Inc. | 0.00 | -62.94 | 0.91 | -64.17 | 0.1991 | -0.3506 | |||
| US8575093013 / State Street Navigator Securities Lending Government Money Market Portfolio | 0.87 | 4.35 | 0.87 | 4.42 | 0.1908 | 0.0099 | |||
| APA / APA Corporation | 0.05 | 0.00 | 0.84 | -17.90 | 0.1824 | -0.0372 | |||
| CACI / CACI International Inc | 0.00 | -35.66 | 0.83 | -11.75 | 0.1821 | -0.0213 | |||
| BLD / TopBuild Corp. | 0.00 | -38.86 | 0.83 | -43.55 | 0.1816 | -0.1368 | |||
| GRAL / GRAIL, Inc. | 0.02 | 0.00 | 0.83 | -0.36 | 0.1812 | 0.0012 | |||
| CMI / Cummins Inc. | 0.00 | 0.00 | 0.78 | -12.69 | 0.1712 | -0.0228 | |||
| CL / Colgate-Palmolive Company | 0.01 | -45.57 | 0.75 | -44.53 | 0.1637 | -0.1283 | |||
| FLO / Flowers Foods, Inc. | 0.04 | 0.00 | 0.72 | -9.84 | 0.1582 | -0.0154 | |||
| HUBB / Hubbell Incorporated | 0.00 | 0.00 | 0.71 | 4.86 | 0.1554 | 0.0087 | |||
| OKE / ONEOK, Inc. | 0.01 | 12.03 | 0.70 | -9.76 | 0.1535 | -0.0149 | |||
| MSA / MSA Safety Incorporated | 0.00 | 0.00 | 0.67 | -0.45 | 0.1463 | 0.0009 | |||
| CVX / Chevron Corporation | 0.00 | 0.00 | 0.65 | -13.77 | 0.1421 | -0.0211 | |||
| LYB / LyondellBasell Industries N.V. | 0.01 | 0.00 | 0.64 | -26.46 | 0.1402 | -0.0485 | |||
| M / Macy's, Inc. | 0.05 | 0.00 | 0.64 | -17.21 | 0.1387 | -0.0269 | |||
| CHD / Church & Dwight Co., Inc. | 0.01 | 0.00 | 0.63 | -11.64 | 0.1376 | -0.0164 | |||
| COIN / Coinbase Global, Inc. | 0.00 | 64.35 | 0.60 | 88.40 | 0.1313 | 0.0622 | |||
| GMED / Globus Medical, Inc. | 0.01 | -45.17 | 0.59 | -59.59 | 0.1279 | -0.1854 | |||
| AJG / Arthur J. Gallagher & Co. | 0.00 | 0.00 | 0.55 | 2.79 | 0.1208 | 0.0046 | |||
| C / Citigroup Inc. | 0.01 | 0.00 | 0.55 | -5.80 | 0.1205 | -0.0061 | |||
| HRL / Hormel Foods Corporation | 0.02 | 0.00 | 0.54 | 7.14 | 0.1180 | 0.0090 | |||
| SN / SharkNinja, Inc. | 0.01 | 3.13 | 0.52 | -9.81 | 0.1144 | -0.0111 | |||
| MRVL / Marvell Technology, Inc. | 0.01 | 0.52 | 0.1128 | 0.1128 | |||||
| OHI / Omega Healthcare Investors, Inc. | 0.01 | 0.00 | 0.51 | 0.40 | 0.1110 | 0.0016 | |||
| ARW / Arrow Electronics, Inc. | 0.00 | 9.31 | 0.49 | 19.61 | 0.1080 | 0.0187 | |||
| MRNA / Moderna, Inc. | 0.02 | 26.43 | 0.49 | 8.37 | 0.1076 | 0.0094 | |||
| HPE / Hewlett Packard Enterprise Company | 0.03 | 16.71 | 0.49 | 1.67 | 0.1064 | 0.0030 | |||
| HOLX / Hologic, Inc. | 0.01 | 0.00 | 0.46 | -1.90 | 0.1013 | -0.0009 | |||
| GNTX / Gentex Corporation | 0.02 | 29.08 | 0.43 | 14.40 | 0.0938 | 0.0127 | |||
| SNDK / Sandisk Corporation | 0.00 | -100.00 | 0.00 | -100.00 | -0.1603 |