Basic Stats
| Insider Profile | Turtle Creek Asset Management Inc. |
| Portfolio Value | $ 3,444,966,415 |
| Current Positions | 41 |
Latest Holdings, Performance, AUM (from 13F, 13D)
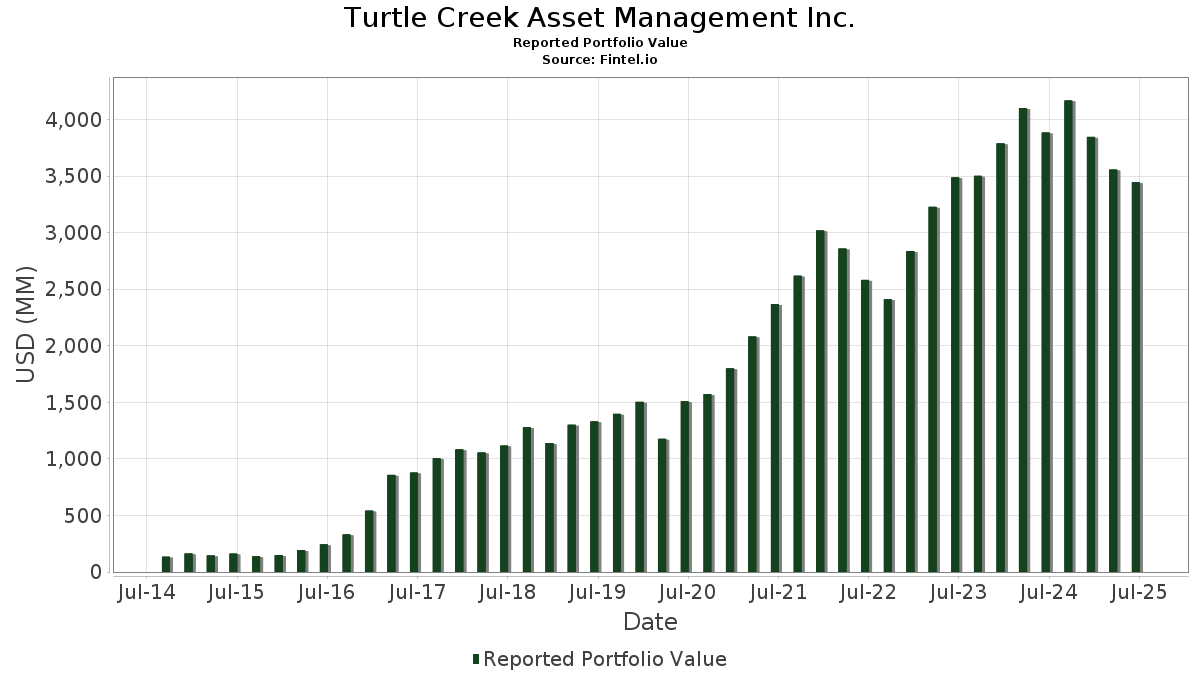
Turtle Creek Asset Management Inc. has disclosed 41 total holdings in their latest SEC filings. Most recent portfolio value is calculated to be $ 3,444,966,415 USD. Actual Assets Under Management (AUM) is this value plus cash (which is not disclosed). Turtle Creek Asset Management Inc.’s top holdings are ATS Corporation (US:ATS) , Celanese Corporation (US:CE) , Bread Financial Holdings, Inc. (US:BFH) , The Middleby Corporation (US:MIDD) , and Brunswick Corporation (US:BC) . Turtle Creek Asset Management Inc.’s new positions include Amcor plc (US:AMCR) , ITT Inc. (US:ITT) , Medpace Holdings, Inc. (US:MEDP) , . Turtle Creek Asset Management Inc.’s top industries are "Building Materials, Hardware, Garden Supply, And Mobile Home Dealers" (sic 52) , "Printing, Publishing, And Allied Industries" (sic 27) , and "Electronic And Other Electrical Equipment And Components, Except Computer Equipment" (sic 36) .
Top Increases This Quarter
We use the change in the portfolio allocation because this is the most meaningful metric. Changes can be due to trades or changes in share prices.
| Security | Shares (MM) |
Value (MM$) |
Portfolio % | ΔPortfolio % |
|---|---|---|---|---|
| 2.79 | 134.64 | 3.9082 | 3.6297 | |
| 8.40 | 77.20 | 2.2410 | 2.2410 | |
| 7.59 | 241.99 | 7.0243 | 1.2054 | |
| 2.26 | 171.50 | 4.9783 | 0.9570 | |
| 5.08 | 139.33 | 4.0444 | 0.7948 | |
| 2.99 | 144.75 | 4.2018 | 0.7638 | |
| 1.93 | 173.06 | 5.0236 | 0.5786 | |
| 3.59 | 205.32 | 5.9601 | 0.3210 | |
| 1.25 | 163.24 | 4.7386 | 0.2917 | |
| 2.56 | 98.72 | 2.8656 | 0.2841 |
Top Decreases This Quarter
We use the change in the portfolio allocation because this is the most meaningful metric. Changes can be due to trades or changes in share prices.
| Security | Shares (MM) |
Value (MM$) |
Portfolio % | ΔPortfolio % |
|---|---|---|---|---|
| 0.00 | 0.00 | -4.6747 | ||
| 0.01 | 0.72 | 0.0210 | -3.2144 | |
| 3.15 | 92.11 | 2.6738 | -0.9626 | |
| 0.20 | 96.90 | 2.8129 | -0.7571 | |
| 16.22 | 63.57 | 1.8454 | -0.7277 | |
| 2.69 | 180.85 | 5.2497 | -0.4514 | |
| 1.36 | 110.68 | 3.2128 | -0.4474 | |
| 4.23 | 233.92 | 6.7903 | -0.4012 | |
| 1.40 | 202.00 | 5.8636 | -0.3976 | |
| 0.71 | 71.54 | 2.0767 | -0.1499 |
13D/G Filings
This is a list of 13D and 13G filings made in the last year (if any). Click the link icon to see the full transaction history. Green rows indicate new positions. Red rows indicate closed positions.
| File Date | Form | Security | Prev Shares |
Current Shares |
ΔShares % | % Ownership |
% ΔOwnership | |
|---|---|---|---|---|---|---|---|---|
| 2025-08-14 | CCOI / Cogent Communications Holdings, Inc. | 2,792,711 | 5.70 | |||||
| 2025-08-14 | JELD / JELD-WEN Holding, Inc. | 15,714,721 | 16,625,557 | 5.80 | 19.50 | 5.98 | ||
| 2025-08-14 | ATS / ATS Corporation | 8,906,269 | 7,590,538 | -14.77 | 7.80 | -15.22 | ||
| 2025-08-14 | DOOO / BRP Inc. | 3,616,521 | 2,986,371 | -17.42 | 8.70 | -17.14 | ||
| 2025-05-15 | BC / Brunswick Corporation | 3,765,617 | 5.70 | |||||
| 2025-02-14 | BFH / Bread Financial Holdings, Inc. | 4,583,616 | 3,740,994 | -18.38 | 7.50 | -18.48 |
13F and Fund Filings
This form was filed on 2025-08-14 for the reporting period 2025-06-30. Click the link icon to see the full transaction history.
Upgrade to unlock premium data and export to Excel ![]() .
.
| Security | Type | Avg Share Price | Shares (MM) |
ΔShares (%) |
ΔShares (%) |
Value ($MM) |
Portfolio (%) |
ΔPortfolio (%) |
|
|---|---|---|---|---|---|---|---|---|---|
| ATS / ATS Corporation | 7.59 | -8.56 | 241.99 | 16.93 | 7.0243 | 1.2054 | |||
| CE / Celanese Corporation | 4.23 | -6.16 | 233.92 | -8.54 | 6.7903 | -0.4012 | |||
| BFH / Bread Financial Holdings, Inc. | 3.59 | -10.24 | 205.32 | 2.38 | 5.9601 | 0.3210 | |||
| MIDD / The Middleby Corporation | 1.40 | -4.26 | 202.00 | -9.29 | 5.8636 | -0.3976 | |||
| BC / Brunswick Corporation | 3.57 | -5.07 | 197.46 | -2.62 | 5.7319 | 0.0304 | |||
| KMX / CarMax, Inc. | 2.69 | 3.40 | 180.85 | -10.81 | 5.2497 | -0.4514 | |||
| TFII / TFI International Inc. | 1.93 | -5.45 | 173.06 | 9.47 | 5.0236 | 0.5786 | |||
| FND / Floor & Decor Holdings, Inc. | 2.26 | 27.03 | 171.50 | 19.91 | 4.9783 | 0.9570 | |||
| CIGI / Colliers International Group Inc. | 1.25 | -4.09 | 163.24 | 3.21 | 4.7386 | 0.2917 | |||
| IR / Ingersoll Rand Inc. | 1.83 | -2.52 | 152.57 | 1.32 | 4.4287 | 0.1947 | |||
| DOOO / BRP Inc. | 2.99 | -17.42 | 144.75 | 18.38 | 4.2018 | 0.7638 | |||
| WSC / WillScot Holdings Corporation | 5.08 | 22.31 | 139.33 | 20.55 | 4.0444 | 0.7948 | |||
| CCOI / Cogent Communications Holdings, Inc. | 2.79 | 1,628.41 | 134.64 | 1,259.14 | 3.9082 | 3.6297 | |||
| BWA / BorgWarner Inc. | 3.58 | -14.79 | 119.81 | -0.42 | 3.4778 | 0.0949 | |||
| SCI / Service Corporation International | 1.36 | -16.23 | 110.68 | -14.98 | 3.2128 | -0.4474 | |||
| MGA / Magna International Inc. | 2.56 | -5.34 | 98.72 | 7.52 | 2.8656 | 0.2841 | |||
| KNSL / Kinsale Capital Group, Inc. | 0.20 | -23.24 | 96.90 | -23.68 | 2.8129 | -0.7571 | |||
| VNT / Vontier Corporation | 2.53 | -10.54 | 93.19 | 0.49 | 2.7051 | 0.0978 | |||
| OTEX / Open Text Corporation | 3.15 | -38.39 | 92.11 | -28.78 | 2.6738 | -0.9626 | |||
| SSNC / SS&C Technologies Holdings, Inc. | 1.00 | -4.15 | 82.47 | -4.99 | 2.3940 | -0.0466 | |||
| ECPG / Encore Capital Group, Inc. | 2.04 | -4.92 | 78.95 | 7.36 | 2.2917 | 0.2242 | |||
| GIL / Gildan Activewear Inc. | 1.59 | -8.57 | 78.33 | 1.81 | 2.2737 | 0.1105 | |||
| AMCR / Amcor plc | 8.40 | 77.20 | 2.2410 | 2.2410 | |||||
| EEFT / Euronet Worldwide, Inc. | 0.71 | -4.79 | 71.54 | -9.66 | 2.0767 | -0.1499 | |||
| JELD / JELD-WEN Holding, Inc. | 16.22 | 5.80 | 63.57 | -30.53 | 1.8454 | -0.7277 | |||
| BLDR / Builders FirstSource, Inc. | 0.07 | 102.16 | 7.77 | 88.82 | 0.2256 | 0.1098 | |||
| PATK / Patrick Industries, Inc. | 0.08 | 5.35 | 7.26 | 14.96 | 0.2108 | 0.0332 | |||
| KNX / Knight-Swift Transportation Holdings Inc. | 0.16 | -5.63 | 7.23 | -4.02 | 0.2099 | -0.0019 | |||
| ITT / ITT Inc. | 0.03 | 4.95 | 0.1437 | 0.1437 | |||||
| MAGN / Magnera Corporation | 0.31 | 0.00 | 3.80 | -33.49 | 0.1104 | -0.0503 | |||
| MEDP / Medpace Holdings, Inc. | 0.01 | 3.45 | 0.1002 | 0.1002 | |||||
| SYF / Synchrony Financial | 0.03 | 1.91 | 0.0554 | 0.0554 | |||||
| WFG / West Fraser Timber Co. Ltd. | 0.02 | 7.48 | 1.26 | 2.43 | 0.0367 | 0.0020 | |||
| SEE / Sealed Air Corporation | 0.03 | 0.00 | 0.99 | 7.46 | 0.0289 | 0.0028 | |||
| CVS / CVS Health Corporation | 0.01 | -99.38 | 0.72 | -99.37 | 0.0210 | -3.2144 | |||
| TNC / Tennant Company | 0.00 | 62.07 | 0.36 | 57.58 | 0.0106 | 0.0041 | |||
| DCBO / Docebo Inc. | 0.01 | 78.95 | 0.30 | 80.98 | 0.0086 | 0.0040 | |||
| CLW / Clearwater Paper Corporation | 0.01 | 10.31 | 0.29 | 18.29 | 0.0085 | 0.0015 | |||
| LVLU / Lulu's Fashion Lounge Holdings, Inc. | 0.06 | 0.00 | 0.25 | 1,022.73 | 0.0072 | 0.0066 | |||
| PNTG / The Pennant Group, Inc. | 0.01 | -27.78 | 0.19 | -14.16 | 0.0056 | -0.0007 | |||
| PHIN / PHINIA Inc. | 0.00 | 33.33 | 0.11 | 39.47 | 0.0031 | 0.0010 | |||
| BERY / Berry Global Group, Inc. | 0.00 | -100.00 | 0.00 | -100.00 | -4.6747 |