Basic Stats
| Portfolio Value | $ 1,343,169,563 |
| Current Positions | 46 |
Latest Holdings, Performance, AUM (from 13F, 13D)
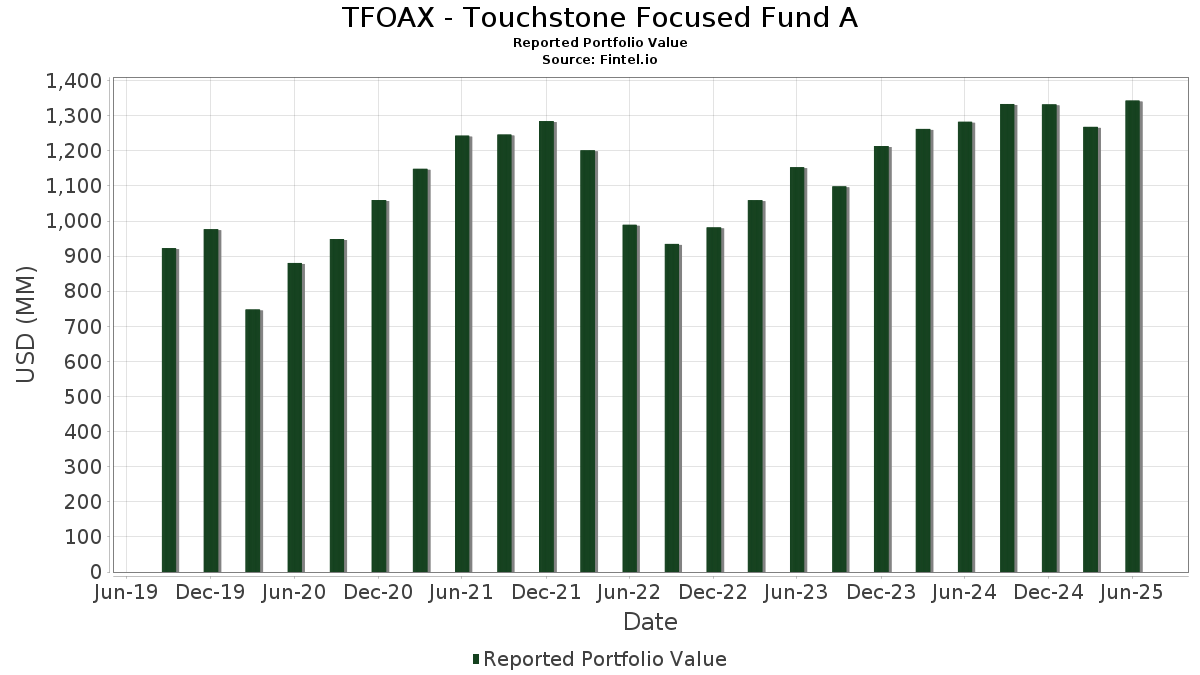
TFOAX - Touchstone Focused Fund A has disclosed 46 total holdings in their latest SEC filings. Most recent portfolio value is calculated to be $ 1,343,169,563 USD. Actual Assets Under Management (AUM) is this value plus cash (which is not disclosed). TFOAX - Touchstone Focused Fund A’s top holdings are Microsoft Corporation (US:MSFT) , Meta Platforms, Inc. (US:META) , Apple Inc. (US:AAPL) , Alphabet Inc. (US:GOOG) , and Amazon.com, Inc. (US:AMZN) .
Top Increases This Quarter
We use the change in the portfolio allocation because this is the most meaningful metric. Changes can be due to trades or changes in share prices.
| Security | Shares (MM) |
Value (MM$) |
Portfolio % | ΔPortfolio % |
|---|---|---|---|---|
| 0.27 | 134.81 | 10.0390 | 1.8437 | |
| 0.14 | 105.68 | 7.8694 | 1.2223 | |
| 0.33 | 52.16 | 3.8839 | 1.1028 | |
| 0.20 | 44.66 | 3.3260 | 1.0253 | |
| 26.12 | 26.12 | 1.9455 | 0.8056 | |
| 0.05 | 34.13 | 2.5419 | 0.3921 | |
| 0.14 | 12.62 | 0.9395 | 0.3780 | |
| 0.10 | 23.76 | 1.7690 | 0.3665 | |
| 0.32 | 69.14 | 5.1486 | 0.3189 | |
| 0.12 | 25.93 | 1.9310 | 0.2308 |
Top Decreases This Quarter
We use the change in the portfolio allocation because this is the most meaningful metric. Changes can be due to trades or changes in share prices.
| Security | Shares (MM) |
Value (MM$) |
Portfolio % | ΔPortfolio % |
|---|---|---|---|---|
| 0.05 | 16.93 | 1.2607 | -1.5840 | |
| 0.36 | 74.74 | 5.5657 | -0.9523 | |
| 0.05 | 19.24 | 1.4329 | -0.8760 | |
| 0.04 | 19.87 | 1.4800 | -0.6947 | |
| 0.32 | 14.71 | 1.0956 | -0.4659 | |
| 0.25 | 27.12 | 2.0193 | -0.3905 | |
| 0.20 | 12.80 | 0.9531 | -0.3476 | |
| 0.11 | 18.65 | 1.3887 | -0.3373 | |
| 0.09 | 13.27 | 0.9884 | -0.3319 | |
| 0.16 | 23.74 | 1.7678 | -0.3296 |
13F and Fund Filings
This form was filed on 2025-08-27 for the reporting period 2025-06-30. Click the link icon to see the full transaction history.
Upgrade to unlock premium data and export to Excel ![]() .
.
| Security | Type | Avg Share Price | Shares (MM) |
ΔShares (%) |
ΔShares (%) |
Value ($MM) |
Portfolio (%) |
ΔPortfolio (%) |
|
|---|---|---|---|---|---|---|---|---|---|
| MSFT / Microsoft Corporation | 0.27 | 0.00 | 134.81 | 32.51 | 10.0390 | 1.8437 | |||
| META / Meta Platforms, Inc. | 0.14 | 0.00 | 105.68 | 28.06 | 7.8694 | 1.2223 | |||
| AAPL / Apple Inc. | 0.36 | 0.00 | 74.74 | -7.63 | 5.5657 | -0.9523 | |||
| GOOG / Alphabet Inc. | 0.40 | -4.79 | 71.32 | 8.10 | 5.3113 | -0.0032 | |||
| AMZN / Amazon.com, Inc. | 0.32 | 0.00 | 69.14 | 15.31 | 5.1486 | 0.3189 | |||
| NVDA / NVIDIA Corporation | 0.33 | 3.63 | 52.16 | 51.06 | 3.8839 | 1.1028 | |||
| ORCL / Oracle Corporation | 0.20 | 0.00 | 44.66 | 56.38 | 3.3260 | 1.0253 | |||
| PM / Philip Morris International Inc. | 0.22 | 0.00 | 39.91 | 14.74 | 2.9723 | 0.1703 | |||
| V / Visa Inc. | 0.10 | 0.00 | 35.56 | 1.31 | 2.6482 | -0.1793 | |||
| BAC / Bank of America Corporation | 0.75 | 0.00 | 35.44 | 13.40 | 2.6390 | 0.1216 | |||
| GS / The Goldman Sachs Group, Inc. | 0.05 | -1.28 | 34.13 | 27.90 | 2.5419 | 0.3921 | |||
| CRM / Salesforce, Inc. | 0.11 | 0.00 | 30.97 | 1.61 | 2.3060 | -0.1488 | |||
| MKL / Markel Group Inc. | 0.01 | 0.00 | 27.67 | 6.83 | 2.0606 | -0.0258 | |||
| SCHW / The Charles Schwab Corporation | 0.30 | 0.00 | 27.18 | 16.56 | 2.0238 | 0.1456 | |||
| XOM / Exxon Mobil Corporation | 0.25 | 0.00 | 27.12 | -9.36 | 2.0193 | -0.3905 | |||
| KOF / Coca-Cola FEMSA, S.A.B. de C.V. - Depositary Receipt (Common Stock) | 0.27 | -1.36 | 26.45 | 4.51 | 1.9700 | -0.0689 | |||
| CHH / Choice Hotels International, Inc. | 0.21 | 0.00 | 26.16 | -4.44 | 1.9482 | -0.2571 | |||
| DGCXX / Dreyfus Government Cash Management Funds - Dreyfus Government Cash Management Fund Institutional Shares | 26.12 | 84.62 | 26.12 | 84.62 | 1.9455 | 0.8056 | |||
| MDT / Medtronic plc | 0.30 | 0.00 | 26.12 | -2.99 | 1.9449 | -0.2238 | |||
| BA / The Boeing Company | 0.12 | 0.00 | 25.93 | 22.85 | 1.9310 | 0.2308 | |||
| TSM / Taiwan Semiconductor Manufacturing Company Limited - Depositary Receipt (Common Stock) | 0.10 | 0.00 | 23.76 | 36.44 | 1.7690 | 0.3665 | |||
| JNJ / Johnson & Johnson | 0.16 | -1.02 | 23.74 | -8.83 | 1.7678 | -0.3296 | |||
| TXN / Texas Instruments Incorporated | 0.11 | 0.00 | 23.70 | 15.53 | 1.7646 | 0.1125 | |||
| ABNB / Airbnb, Inc. | 0.16 | 4.47 | 21.34 | 15.73 | 1.5890 | 0.1039 | |||
| BRK.B / Berkshire Hathaway Inc. | 0.04 | -19.29 | 19.87 | -26.39 | 1.4800 | -0.6947 | |||
| HCA / HCA Healthcare, Inc. | 0.05 | -39.45 | 19.24 | -32.87 | 1.4329 | -0.8760 | |||
| BDX / Becton, Dickinson and Company | 0.11 | 15.73 | 18.65 | -12.97 | 1.3887 | -0.3373 | |||
| JLL / Jones Lang LaSalle Incorporated | 0.07 | 0.00 | 18.08 | 3.17 | 1.3466 | -0.0652 | |||
| UNH / UnitedHealth Group Incorporated | 0.05 | -19.52 | 16.93 | -52.06 | 1.2607 | -1.5840 | |||
| SSNC / SS&C Technologies Holdings, Inc. | 0.20 | 0.00 | 16.42 | -0.88 | 1.2228 | -0.1116 | |||
| WDAY / Workday, Inc. | 0.07 | 0.00 | 16.26 | 2.77 | 1.2112 | -0.0636 | |||
| DD / DuPont de Nemours, Inc. | 0.23 | 0.00 | 15.57 | -8.16 | 1.1595 | -0.2061 | |||
| CMCSA / Comcast Corporation | 0.42 | 0.00 | 14.82 | -3.28 | 1.1036 | -0.1306 | |||
| BMY / Bristol-Myers Squibb Company | 0.32 | 0.00 | 14.71 | -24.11 | 1.0956 | -0.4659 | |||
| LPLA / LPL Financial Holdings Inc. | 0.04 | 4.91 | 14.56 | 20.25 | 1.0839 | 0.1089 | |||
| AMAT / Applied Materials, Inc. | 0.08 | 2.33 | 14.47 | 29.09 | 1.0774 | 0.1746 | |||
| HUBB / Hubbell Incorporated | 0.03 | 0.00 | 13.88 | 23.42 | 1.0333 | 0.1277 | |||
| RTX / RTX Corporation | 0.09 | -26.54 | 13.27 | -19.03 | 0.9884 | -0.3319 | |||
| NFLX / Netflix, Inc. | 0.01 | -31.31 | 13.16 | -1.36 | 0.9801 | -0.0947 | |||
| MNST / Monster Beverage Corporation | 0.20 | -25.95 | 12.80 | -20.74 | 0.9531 | -0.3476 | |||
| UBER / Uber Technologies, Inc. | 0.14 | 41.33 | 12.62 | 80.98 | 0.9395 | 0.3780 | |||
| IFF / International Flavors & Fragrances Inc. | 0.14 | 0.00 | 10.34 | -5.23 | 0.7699 | -0.1089 | |||
| FND / Floor & Decor Holdings, Inc. | 0.13 | 36.69 | 9.62 | 29.02 | 0.7164 | 0.1158 | |||
| FTDR / Frontdoor, Inc. | 0.15 | -22.64 | 8.68 | 18.68 | 0.6467 | 0.0573 | |||
| SWK / Stanley Black & Decker, Inc. | 0.12 | 0.00 | 8.30 | -11.88 | 0.6178 | -0.1405 | |||
| BMRN / BioMarin Pharmaceutical Inc. | 0.13 | 0.00 | 7.10 | -22.24 | 0.5291 | -0.2069 |