Basic Stats
| Portfolio Value | $ 560,716,456 |
| Current Positions | 72 |
Latest Holdings, Performance, AUM (from 13F, 13D)
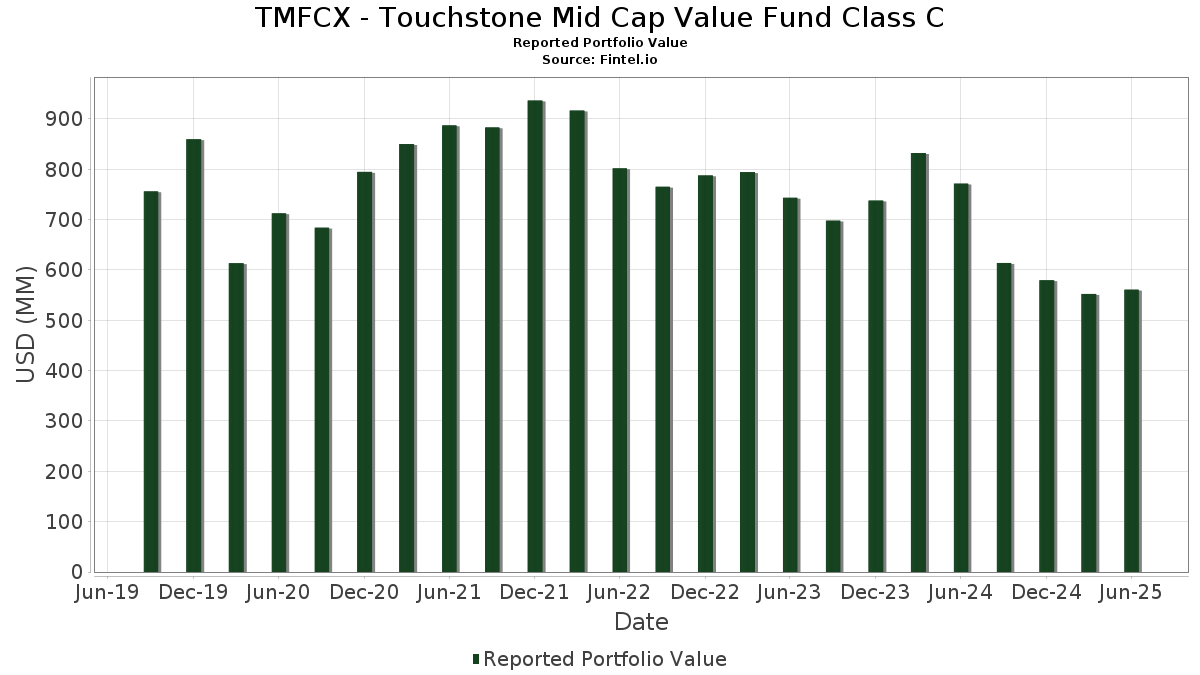
TMFCX - Touchstone Mid Cap Value Fund Class C has disclosed 72 total holdings in their latest SEC filings. Most recent portfolio value is calculated to be $ 560,716,456 USD. Actual Assets Under Management (AUM) is this value plus cash (which is not disclosed). TMFCX - Touchstone Mid Cap Value Fund Class C’s top holdings are Keysight Technologies, Inc. (US:KEYS) , Clean Harbors, Inc. (US:CLH) , The Allstate Corporation (US:ALL) , Regal Rexnord Corporation (US:RRX) , and Encompass Health Corporation (US:EHC) . TMFCX - Touchstone Mid Cap Value Fund Class C’s new positions include Evercore Inc. (US:EVR) , .
Top Increases This Quarter
We use the change in the portfolio allocation because this is the most meaningful metric. Changes can be due to trades or changes in share prices.
| Security | Shares (MM) |
Value (MM$) |
Portfolio % | ΔPortfolio % |
|---|---|---|---|---|
| 0.03 | 8.74 | 1.5577 | 1.5577 | |
| 0.12 | 11.32 | 2.0169 | 1.0903 | |
| 0.17 | 9.23 | 1.6447 | 0.6233 | |
| 8.90 | 8.90 | 1.5868 | 0.5383 | |
| 0.09 | 13.99 | 2.4940 | 0.5102 | |
| 0.19 | 8.02 | 1.4292 | 0.4340 | |
| 0.08 | 12.29 | 2.1898 | 0.4033 | |
| 0.06 | 10.69 | 1.9046 | 0.2925 | |
| 0.28 | 4.26 | 0.7588 | 0.2833 | |
| 0.06 | 13.26 | 2.3634 | 0.2831 |
Top Decreases This Quarter
We use the change in the portfolio allocation because this is the most meaningful metric. Changes can be due to trades or changes in share prices.
| Security | Shares (MM) |
Value (MM$) |
Portfolio % | ΔPortfolio % |
|---|---|---|---|---|
| 0.04 | 6.17 | 1.1000 | -0.7523 | |
| 0.19 | 8.31 | 1.4817 | -0.5059 | |
| 0.16 | 8.72 | 1.5542 | -0.4414 | |
| 0.03 | 9.37 | 1.6697 | -0.4016 | |
| 0.08 | 8.68 | 1.5472 | -0.3845 | |
| 0.31 | 7.77 | 1.3846 | -0.3265 | |
| 0.11 | 3.40 | 0.6067 | -0.3065 | |
| 0.08 | 6.92 | 1.2331 | -0.2877 | |
| 0.22 | 7.99 | 1.4246 | -0.2653 | |
| 0.06 | 4.29 | 0.7653 | -0.2486 |
13F and Fund Filings
This form was filed on 2025-08-27 for the reporting period 2025-06-30. Click the link icon to see the full transaction history.
Upgrade to unlock premium data and export to Excel ![]() .
.
| Security | Type | Avg Share Price | Shares (MM) |
ΔShares (%) |
ΔShares (%) |
Value ($MM) |
Portfolio (%) |
ΔPortfolio (%) |
|
|---|---|---|---|---|---|---|---|---|---|
| KEYS / Keysight Technologies, Inc. | 0.09 | 16.78 | 13.99 | 27.77 | 2.4940 | 0.5102 | |||
| CLH / Clean Harbors, Inc. | 0.06 | -1.57 | 13.26 | 15.46 | 2.3634 | 0.2831 | |||
| ALL / The Allstate Corporation | 0.06 | -1.50 | 12.51 | -4.23 | 2.2304 | -0.1365 | |||
| RRX / Regal Rexnord Corporation | 0.08 | -2.16 | 12.29 | 24.57 | 2.1898 | 0.4033 | |||
| EHC / Encompass Health Corporation | 0.10 | -13.05 | 12.26 | 5.28 | 2.1850 | 0.0758 | |||
| RGA / Reinsurance Group of America, Incorporated | 0.06 | -1.65 | 12.14 | -0.92 | 2.1638 | -0.0557 | |||
| AER / AerCap Holdings N.V. | 0.10 | -2.20 | 11.55 | 12.00 | 2.0581 | 0.1906 | |||
| FHN / First Horizon Corporation | 0.54 | -2.16 | 11.50 | 6.81 | 2.0492 | 0.0995 | |||
| WCC / WESCO International, Inc. | 0.06 | -2.19 | 11.45 | 16.65 | 2.0415 | 0.2628 | |||
| LITE / Lumentum Holdings Inc. | 0.12 | 45.07 | 11.32 | 121.26 | 2.0169 | 1.0903 | |||
| PTC / PTC Inc. | 0.06 | 7.95 | 10.69 | 20.07 | 1.9046 | 0.2925 | |||
| LH / Labcorp Holdings Inc. | 0.04 | -8.96 | 10.30 | 2.68 | 1.8366 | 0.0190 | |||
| AIG / American International Group, Inc. | 0.12 | -1.07 | 10.27 | -2.61 | 1.8305 | -0.0796 | |||
| WTW / Willis Towers Watson Public Limited Company | 0.03 | -1.93 | 9.53 | -11.06 | 1.6980 | -0.2422 | |||
| COR / Cencora, Inc. | 0.03 | -24.02 | 9.37 | -18.08 | 1.6697 | -0.4016 | |||
| WBS / Webster Financial Corporation | 0.17 | 54.51 | 9.23 | 63.66 | 1.6447 | 0.6233 | |||
| DTE / DTE Energy Company | 0.07 | -7.59 | 9.13 | -11.48 | 1.6265 | -0.2408 | |||
| ADC / Agree Realty Corporation | 0.12 | -2.02 | 9.08 | -7.26 | 1.6189 | -0.1551 | |||
| DGCXX / Dreyfus Government Cash Management Funds - Dreyfus Government Cash Management Fund Institutional Shares | 8.90 | 53.80 | 8.90 | 53.80 | 1.5868 | 0.5383 | |||
| WAB / Westinghouse Air Brake Technologies Corporation | 0.04 | -2.33 | 8.85 | 12.75 | 1.5783 | 0.1557 | |||
| EVR / Evercore Inc. | 0.03 | 8.74 | 1.5577 | 1.5577 | |||||
| TSN / Tyson Foods, Inc. | 0.16 | -9.72 | 8.72 | -20.85 | 1.5542 | -0.4414 | |||
| WEC / WEC Energy Group, Inc. | 0.08 | -14.87 | 8.68 | -18.60 | 1.5472 | -0.3845 | |||
| HOLX / Hologic, Inc. | 0.13 | -1.49 | 8.41 | 3.92 | 1.4997 | 0.0330 | |||
| G / Genpact Limited | 0.19 | -13.28 | 8.31 | -24.24 | 1.4817 | -0.5059 | |||
| NI / NiSource Inc. | 0.21 | -1.81 | 8.28 | -1.20 | 1.4767 | -0.0423 | |||
| STWD / Starwood Property Trust, Inc. | 0.41 | -1.63 | 8.19 | -0.13 | 1.4602 | -0.0258 | |||
| HAS / Hasbro, Inc. | 0.11 | -2.18 | 8.18 | 17.44 | 1.4587 | 0.1963 | |||
| ARMK / Aramark | 0.19 | 20.33 | 8.02 | 45.97 | 1.4292 | 0.4340 | |||
| LKQ / LKQ Corporation | 0.22 | -1.53 | 7.99 | -14.33 | 1.4246 | -0.2653 | |||
| PH / Parker-Hannifin Corporation | 0.01 | -1.28 | 7.95 | 13.45 | 1.4165 | 0.1475 | |||
| MAA / Mid-America Apartment Communities, Inc. | 0.05 | -1.36 | 7.92 | -12.88 | 1.4117 | -0.2351 | |||
| ALLY / Ally Financial Inc. | 0.20 | 1.93 | 7.87 | 8.86 | 1.4036 | 0.0932 | |||
| EVRG / Evergy, Inc. | 0.11 | -1.97 | 7.83 | -2.00 | 1.3956 | -0.0517 | |||
| CHX / ChampionX Corporation | 0.31 | -1.34 | 7.77 | -17.77 | 1.3846 | -0.3265 | |||
| XEL / Xcel Energy Inc. | 0.11 | -1.29 | 7.76 | -5.06 | 1.3826 | -0.0972 | |||
| ETR / Entergy Corporation | 0.09 | -1.06 | 7.56 | -3.80 | 1.3482 | -0.0761 | |||
| EPAM / EPAM Systems, Inc. | 0.04 | 17.41 | 7.51 | 22.96 | 1.3381 | 0.2322 | |||
| CNP / CenterPoint Energy, Inc. | 0.20 | -1.22 | 7.43 | 0.18 | 1.3250 | -0.0192 | |||
| AKAM / Akamai Technologies, Inc. | 0.09 | -2.11 | 7.28 | -3.01 | 1.2982 | -0.0621 | |||
| PR / Permian Resources Corporation | 0.53 | 5.19 | 7.27 | 3.44 | 1.2954 | 0.0228 | |||
| QRVO / Qorvo, Inc. | 0.08 | -2.14 | 7.17 | 14.76 | 1.2779 | 0.1462 | |||
| AMP / Ameriprise Financial, Inc. | 0.01 | -1.62 | 7.10 | 8.47 | 1.2652 | 0.0797 | |||
| EXP / Eagle Materials Inc. | 0.03 | 23.69 | 7.05 | 12.65 | 1.2568 | 0.1229 | |||
| VVV / Valvoline Inc. | 0.19 | 3.18 | 7.03 | 12.25 | 1.2526 | 0.1185 | |||
| DOV / Dover Corporation | 0.04 | -1.15 | 7.02 | 3.10 | 1.2506 | 0.0178 | |||
| PNFP / Pinnacle Financial Partners, Inc. | 0.06 | -2.08 | 6.97 | 1.96 | 1.2423 | 0.0040 | |||
| ZBH / Zimmer Biomet Holdings, Inc. | 0.08 | 2.25 | 6.92 | -17.59 | 1.2331 | -0.2877 | |||
| LHX / L3Harris Technologies, Inc. | 0.03 | -1.38 | 6.87 | 18.20 | 1.2250 | 0.1717 | |||
| FANG / Diamondback Energy, Inc. | 0.05 | 15.82 | 6.86 | -0.46 | 1.2236 | -0.0257 | |||
| ESS / Essex Property Trust, Inc. | 0.02 | 4.08 | 6.81 | -3.79 | 1.2140 | -0.0683 | |||
| DAR / Darling Ingredients Inc. | 0.18 | 2.12 | 6.80 | 24.03 | 1.2116 | 0.2188 | |||
| BALL / Ball Corporation | 0.12 | -1.65 | 6.79 | 5.94 | 1.2109 | 0.0493 | |||
| CTRA / Coterra Energy Inc. | 0.27 | -2.19 | 6.73 | -14.09 | 1.1994 | -0.2196 | |||
| INGR / Ingredion Incorporated | 0.05 | -1.79 | 6.28 | -1.49 | 1.1192 | -0.0355 | |||
| LDOS / Leidos Holdings, Inc. | 0.04 | -48.38 | 6.17 | -39.65 | 1.1000 | -0.7523 | |||
| CASY / Casey's General Stores, Inc. | 0.01 | -18.24 | 6.09 | -3.88 | 1.0850 | -0.0622 | |||
| LW / Lamb Weston Holdings, Inc. | 0.12 | -1.67 | 6.06 | -4.35 | 1.0808 | -0.0675 | |||
| FFIV / F5, Inc. | 0.02 | -0.80 | 5.89 | 9.64 | 1.0507 | 0.0769 | |||
| IFF / International Flavors & Fragrances Inc. | 0.07 | -2.24 | 5.33 | -7.36 | 0.9493 | -0.0920 | |||
| SNA / Snap-on Incorporated | 0.02 | -0.57 | 5.19 | -8.20 | 0.9243 | -0.0989 | |||
| HXL / Hexcel Corporation | 0.09 | -1.97 | 4.87 | 1.14 | 0.8679 | -0.0043 | |||
| COLM / Columbia Sportswear Company | 0.08 | -2.22 | 4.74 | -21.09 | 0.8442 | -0.2431 | |||
| DLTR / Dollar Tree, Inc. | 0.05 | -2.09 | 4.47 | 29.19 | 0.7975 | 0.1701 | |||
| STZ / Constellation Brands, Inc. | 0.03 | -2.25 | 4.33 | -13.36 | 0.7712 | -0.1333 | |||
| ARE / Alexandria Real Estate Equities, Inc. | 0.06 | -2.29 | 4.29 | -23.30 | 0.7653 | -0.2486 | |||
| HST / Host Hotels & Resorts, Inc. | 0.28 | 50.04 | 4.26 | 62.20 | 0.7588 | 0.2833 | |||
| GNTX / Gentex Corporation | 0.19 | -2.16 | 4.15 | -7.65 | 0.7403 | -0.0744 | |||
| BWA / BorgWarner Inc. | 0.11 | -2.21 | 3.64 | 14.27 | 0.6482 | 0.0717 | |||
| AXTA / Axalta Coating Systems Ltd. | 0.11 | -24.57 | 3.40 | -32.47 | 0.6067 | -0.3065 | |||
| HUM / Humana Inc. | 0.01 | -1.43 | 3.09 | -8.92 | 0.5516 | -0.0639 | |||
| NVST / Envista Holdings Corporation | 0.16 | -2.18 | 3.06 | 10.77 | 0.5446 | 0.0448 |