Basic Stats
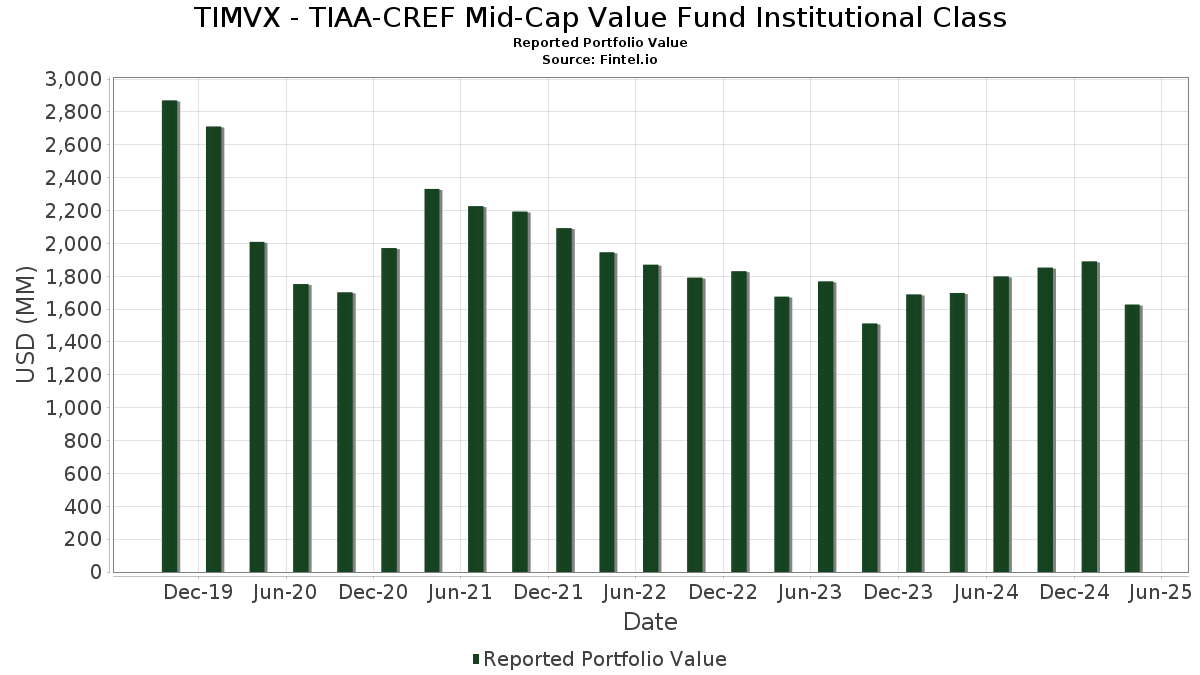
| Portfolio Value | $ 1,626,867,797 |
| Current Positions | 72 |
Latest Holdings, Performance, AUM (from 13F, 13D)
TIMVX - TIAA-CREF Mid-Cap Value Fund Institutional Class has disclosed 72 total holdings in their latest SEC filings. Most recent portfolio value is calculated to be $ 1,626,867,797 USD. Actual Assets Under Management (AUM) is this value plus cash (which is not disclosed). TIMVX - TIAA-CREF Mid-Cap Value Fund Institutional Class’s top holdings are L3Harris Technologies, Inc. (US:LHX) , FirstEnergy Corp. (US:FE) , CMS Energy Corporation (US:CMS) , Take-Two Interactive Software, Inc. (US:TTWO) , and Fidelity National Financial, Inc. (US:FNF) . TIMVX - TIAA-CREF Mid-Cap Value Fund Institutional Class’s new positions include Carlisle Companies Incorporated (US:CSL) , VeriSign, Inc. (US:VRSN) , Primo Brands Corporation (US:PRMB) , Eversource Energy (US:ES) , and .
Top Increases This Quarter
We use the change in the portfolio allocation because this is the most meaningful metric. Changes can be due to trades or changes in share prices.
| Security | Shares (MM) |
Value (MM$) |
Portfolio % | ΔPortfolio % |
|---|---|---|---|---|
| 0.07 | 27.03 | 1.6611 | 1.6611 | |
| 0.13 | 28.05 | 1.7243 | 1.1248 | |
| 0.06 | 17.03 | 1.0468 | 1.0468 | |
| 0.50 | 16.21 | 0.9963 | 0.9963 | |
| 0.18 | 38.87 | 2.3891 | 0.9334 | |
| 0.06 | 12.14 | 0.7464 | 0.7464 | |
| 0.16 | 36.93 | 2.2701 | 0.6904 | |
| 0.39 | 27.67 | 1.7009 | 0.6833 | |
| 9.21 | 0.5660 | 0.5660 | ||
| 0.14 | 8.15 | 0.5010 | 0.5010 |
Top Decreases This Quarter
We use the change in the portfolio allocation because this is the most meaningful metric. Changes can be due to trades or changes in share prices.
| Security | Shares (MM) |
Value (MM$) |
Portfolio % | ΔPortfolio % |
|---|---|---|---|---|
| 0.24 | 18.71 | 1.1498 | -1.0207 | |
| 0.00 | 0.00 | -0.9665 | ||
| 0.42 | 14.96 | 0.9194 | -0.9526 | |
| 0.54 | 25.44 | 1.5637 | -0.6882 | |
| 0.25 | 14.48 | 0.8898 | -0.6160 | |
| 0.17 | 8.03 | 0.4937 | -0.5299 | |
| 0.09 | 12.33 | 0.7580 | -0.5034 | |
| 1.08 | 27.99 | 1.7205 | -0.3528 | |
| 0.16 | 20.69 | 1.2719 | -0.3268 | |
| 0.29 | 22.00 | 1.3520 | -0.2770 |
13F and Fund Filings
This form was filed on 2025-06-26 for the reporting period 2025-04-30. Click the link icon to see the full transaction history.
Upgrade to unlock premium data and export to Excel ![]() .
.
| Security | Type | Avg Share Price | Shares (MM) |
ΔShares (%) |
ΔShares (%) |
Value ($MM) |
Portfolio (%) |
ΔPortfolio (%) |
|
|---|---|---|---|---|---|---|---|---|---|
| LHX / L3Harris Technologies, Inc. | 0.18 | 36.21 | 38.87 | 41.36 | 2.3891 | 0.9334 | |||
| FE / FirstEnergy Corp. | 0.90 | -1.59 | 38.40 | 6.03 | 2.3605 | 0.4429 | |||
| CMS / CMS Energy Corporation | 0.51 | -1.59 | 37.22 | 9.82 | 2.2880 | 0.4935 | |||
| TTWO / Take-Two Interactive Software, Inc. | 0.16 | -1.59 | 36.93 | 23.77 | 2.2701 | 0.6904 | |||
| FNF / Fidelity National Financial, Inc. | 0.55 | -1.59 | 35.23 | 8.36 | 2.1654 | 0.4441 | |||
| ALL / The Allstate Corporation | 0.17 | -1.59 | 33.29 | 1.51 | 2.0464 | 0.3100 | |||
| LNT / Alliant Energy Corporation | 0.54 | -1.59 | 33.08 | 2.02 | 2.0332 | 0.3166 | |||
| AEP / American Electric Power Company, Inc. | 0.29 | -1.59 | 30.88 | 8.40 | 1.8979 | 0.3898 | |||
| SNX / TD SYNNEX Corporation | 0.28 | -1.59 | 30.80 | -23.49 | 1.8934 | -0.2380 | |||
| RJF / Raymond James Financial, Inc. | 0.22 | -1.59 | 29.84 | -19.95 | 1.8338 | -0.1394 | |||
| EXEL / Exelixis, Inc. | 0.76 | -20.41 | 29.66 | -6.01 | 1.8233 | 0.1525 | |||
| HPE / Hewlett Packard Enterprise Company | 1.82 | -1.59 | 29.46 | -24.67 | 1.8109 | -0.2597 | |||
| DLR / Digital Realty Trust, Inc. | 0.18 | -1.59 | 29.39 | -3.58 | 1.8065 | 0.1927 | |||
| VICI / VICI Properties Inc. | 0.90 | -1.59 | 28.89 | 5.85 | 1.7758 | 0.3308 | |||
| WMB / The Williams Companies, Inc. | 0.49 | 12.64 | 28.63 | 19.01 | 1.7597 | 0.4862 | |||
| PR / Permian Resources Corporation | 2.40 | 17.20 | 28.34 | -5.61 | 1.7421 | 0.1525 | |||
| CHKP / Check Point Software Technologies Ltd. | 0.13 | 145.98 | 28.05 | 147.71 | 1.7243 | 1.1248 | |||
| UNM / Unum Group | 0.36 | -1.59 | 28.05 | 0.23 | 1.7238 | 0.2425 | |||
| GEN / Gen Digital Inc. | 1.08 | -25.65 | 27.99 | -28.53 | 1.7205 | -0.3528 | |||
| VTR / Ventas, Inc. | 0.39 | 24.13 | 27.67 | 43.98 | 1.7009 | 0.6833 | |||
| HUBB / Hubbell Incorporated | 0.08 | -1.59 | 27.32 | -15.51 | 1.6795 | -0.0326 | |||
| CSL / Carlisle Companies Incorporated | 0.07 | 27.03 | 1.6611 | 1.6611 | |||||
| ITT / ITT Inc. | 0.19 | -1.59 | 26.57 | -10.71 | 1.6332 | 0.0577 | |||
| EWBC / East West Bancorp, Inc. | 0.30 | -1.59 | 25.89 | -18.24 | 1.5911 | -0.0851 | |||
| EG / Everest Group, Ltd. | 0.07 | -1.59 | 25.53 | 1.62 | 1.5692 | 0.2391 | |||
| JEF / Jefferies Financial Group Inc. | 0.54 | -1.59 | 25.44 | -40.19 | 1.5637 | -0.6882 | |||
| AIG / American International Group, Inc. | 0.31 | -29.13 | 25.12 | -21.57 | 1.5438 | -0.1515 | |||
| WCC / WESCO International, Inc. | 0.15 | -1.59 | 24.98 | -13.31 | 1.5352 | 0.0098 | |||
| CR / Crane Company | 0.15 | -1.59 | 24.68 | -6.98 | 1.5169 | 0.1122 | |||
| UTHR / United Therapeutics Corporation | 0.08 | -1.59 | 24.66 | -15.06 | 1.5155 | -0.0213 | |||
| JAZZ / Jazz Pharmaceuticals plc | 0.20 | 22.49 | 23.86 | 15.19 | 1.4667 | 0.3700 | |||
| OMF / OneMain Holdings, Inc. | 0.51 | -1.59 | 23.84 | -16.60 | 1.4652 | -0.0480 | |||
| DD / DuPont de Nemours, Inc. | 0.35 | -1.59 | 23.22 | -15.44 | 1.4275 | -0.0266 | |||
| URI / United Rentals, Inc. | 0.04 | -1.59 | 23.22 | -18.02 | 1.4274 | -0.0724 | |||
| WY / Weyerhaeuser Company | 0.89 | -1.59 | 23.07 | -16.73 | 1.4177 | -0.0487 | |||
| STAG / STAG Industrial, Inc. | 0.70 | -1.59 | 23.04 | -4.90 | 1.4160 | 0.1335 | |||
| DOV / Dover Corporation | 0.13 | 40.85 | 23.02 | 18.01 | 1.4152 | 0.3823 | |||
| AN / AutoNation, Inc. | 0.13 | -1.59 | 22.97 | -9.10 | 1.4116 | 0.0739 | |||
| FITB / Fifth Third Bancorp | 0.64 | -1.59 | 22.84 | -20.18 | 1.4038 | -0.1110 | |||
| WHR / Whirlpool Corporation | 0.29 | -1.59 | 22.00 | -28.51 | 1.3520 | -0.2770 | |||
| EGP / EastGroup Properties, Inc. | 0.13 | -1.59 | 21.57 | -5.19 | 1.3258 | 0.1214 | |||
| REG / Regency Centers Corporation | 0.30 | -27.27 | 21.33 | -26.84 | 1.3110 | -0.0833 | |||
| NVT / nVent Electric plc | 0.38 | -1.59 | 21.00 | -16.98 | 1.2908 | -0.0484 | |||
| FANG / Diamondback Energy, Inc. | 0.16 | -14.68 | 20.69 | -31.48 | 1.2719 | -0.3268 | |||
| ACGL / Arch Capital Group Ltd. | 0.22 | -1.59 | 20.10 | -4.12 | 1.2355 | 0.1256 | |||
| TNL / Travel + Leisure Co. | 0.46 | -1.59 | 20.00 | -20.47 | 1.2292 | -0.1021 | |||
| ELAN / Elanco Animal Health Incorporated | 2.09 | 9.66 | 19.77 | -13.58 | 1.2153 | 0.0040 | |||
| WH / Wyndham Hotels & Resorts, Inc. | 0.23 | -1.59 | 19.59 | -20.07 | 1.2040 | -0.0934 | |||
| OC / Owens Corning | 0.13 | -1.59 | 19.41 | -22.46 | 1.1933 | -0.1322 | |||
| NUE / Nucor Corporation | 0.16 | -1.59 | 19.06 | -8.53 | 1.1714 | 0.0683 | |||
| CIEN / Ciena Corporation | 0.28 | -44.03 | 18.92 | -18.36 | 1.1627 | -0.2184 | |||
| FIS / Fidelity National Information Services, Inc. | 0.24 | -52.88 | 18.71 | -54.37 | 1.1498 | -1.0207 | |||
| WAB / Westinghouse Air Brake Technologies Corporation | 0.10 | -1.59 | 18.65 | -12.56 | 1.1460 | 0.0171 | |||
| WLK / Westlake Corporation | 0.20 | -1.59 | 18.56 | -20.40 | 1.1410 | -0.0936 | |||
| CPB / The Campbell's Company | 0.47 | -1.59 | 17.25 | -7.45 | 1.0600 | 0.0735 | |||
| VRSN / VeriSign, Inc. | 0.06 | 17.03 | 1.0468 | 1.0468 | |||||
| PH / Parker-Hannifin Corporation | 0.03 | -1.58 | 16.86 | -15.78 | 1.0364 | -0.0235 | |||
| DRI / Darden Restaurants, Inc. | 0.08 | -22.78 | 16.54 | -20.64 | 1.0169 | -0.0868 | |||
| PRMB / Primo Brands Corporation | 0.50 | 16.21 | 0.9963 | 0.9963 | |||||
| BMRN / BioMarin Pharmaceutical Inc. | 0.25 | -1.59 | 16.12 | -1.07 | 0.9906 | 0.1281 | |||
| MTB / M&T Bank Corporation | 0.09 | -1.59 | 15.10 | -16.98 | 0.9278 | -0.0348 | |||
| BKR / Baker Hughes Company | 0.42 | -44.81 | 14.96 | -57.70 | 0.9194 | -0.9526 | |||
| MRVL / Marvell Technology, Inc. | 0.25 | -1.59 | 14.48 | -49.11 | 0.8898 | -0.6160 | |||
| HUM / Humana Inc. | 0.05 | -1.59 | 13.99 | -11.99 | 0.8599 | 0.0184 | |||
| MET / MetLife, Inc. | 0.17 | -1.59 | 12.64 | -14.26 | 0.7768 | -0.0036 | |||
| HWM / Howmet Aerospace Inc. | 0.09 | -52.72 | 12.33 | -48.25 | 0.7580 | -0.5034 | |||
| AVB / AvalonBay Communities, Inc. | 0.06 | 12.14 | 0.7464 | 0.7464 | |||||
| TFII / TFI International Inc. | 0.12 | -1.59 | 9.50 | -39.28 | 0.5837 | -0.2443 | |||
| BK / The Bank of New York Mellon Corporation - Depositary Receipt (Common Stock) | 9.21 | 0.5660 | 0.5660 | ||||||
| ES / Eversource Energy | 0.14 | 8.15 | 0.5010 | 0.5010 | |||||
| MCHP / Microchip Technology Incorporated | 0.17 | -51.05 | 8.03 | -58.46 | 0.4937 | -0.5299 | |||
| US8575093013 / State Street Navigator Securities Lending Government Money Market Portfolio | 0.00 | -99.93 | 0.00 | -100.00 | 0.0000 | -0.0367 | |||
| HPQ / HP Inc. | 0.00 | -100.00 | 0.00 | -100.00 | -0.9665 |