Basic Stats
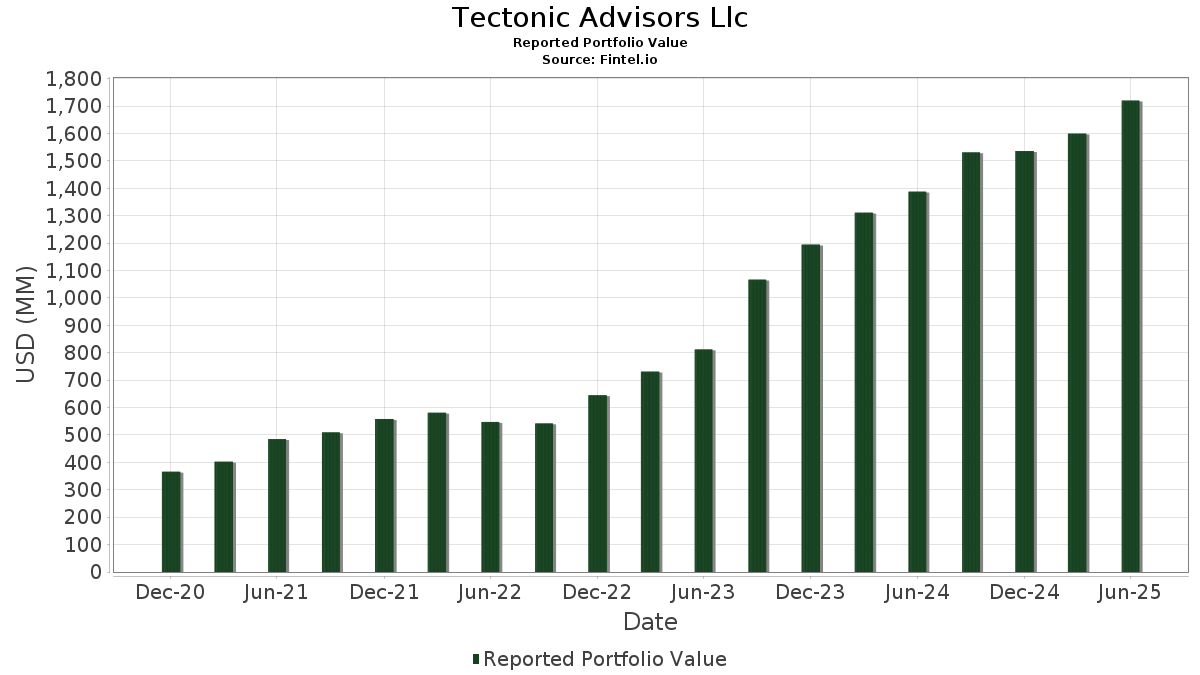
| Portfolio Value | $ 1,720,225,434 |
| Current Positions | 318 |
Latest Holdings, Performance, AUM (from 13F, 13D)
Tectonic Advisors Llc has disclosed 318 total holdings in their latest SEC filings. Most recent portfolio value is calculated to be $ 1,720,225,434 USD. Actual Assets Under Management (AUM) is this value plus cash (which is not disclosed). Tectonic Advisors Llc’s top holdings are Vanguard Tax-Managed Funds - Vanguard FTSE Developed Markets ETF (US:VEA) , PIMCO ETF Trust - PIMCO Active Bond Exchange-Traded Fund (US:BOND) , Vanguard Index Funds - Vanguard S&P 500 ETF (US:VOO) , SSGA Active Trust - SPDR DoubleLine Total Return Tactical ETF (US:TOTL) , and iShares Trust - iShares Core S&P 500 ETF (US:IVV) . Tectonic Advisors Llc’s new positions include Amcor plc (US:AMCR) , HealthEquity, Inc. (US:HQY) , MaxLinear, Inc. (DE:JMX) , Matador Resources Company (US:MTDR) , and Hillman Solutions Corp. (US:HLMN) . Tectonic Advisors Llc’s top industries are "Non-depository Credit Institutions" (sic 61) , "Apparel And Accessory Stores" (sic 56) , and "Building Materials, Hardware, Garden Supply, And Mobile Home Dealers" (sic 52) .
Top Increases This Quarter
We use the change in the portfolio allocation because this is the most meaningful metric. Changes can be due to trades or changes in share prices.
| Security | Shares (MM) |
Value (MM$) |
Portfolio % | ΔPortfolio % |
|---|---|---|---|---|
| 0.56 | 5.13 | 0.2982 | 0.2982 | |
| 0.05 | 14.65 | 0.8517 | 0.2901 | |
| 0.03 | 3.62 | 0.2104 | 0.2104 | |
| 0.13 | 13.17 | 0.7655 | 0.1415 | |
| 0.05 | 14.62 | 0.8497 | 0.0825 | |
| 0.02 | 4.53 | 0.2635 | 0.0772 | |
| 0.03 | 1.73 | 0.0753 | 0.0753 | |
| 0.08 | 1.19 | 0.0691 | 0.0691 | |
| 0.02 | 1.41 | 0.0613 | 0.0613 | |
| 0.18 | 12.83 | 0.7457 | 0.0613 |
Top Decreases This Quarter
We use the change in the portfolio allocation because this is the most meaningful metric. Changes can be due to trades or changes in share prices.
| Security | Shares (MM) |
Value (MM$) |
Portfolio % | ΔPortfolio % |
|---|---|---|---|---|
| 1.60 | 147.08 | 6.3874 | -3.0034 | |
| 2.42 | 97.23 | 4.2226 | -1.9793 | |
| 2.85 | 162.40 | 7.0526 | -1.9488 | |
| 0.20 | 112.13 | 4.8694 | -1.1280 | |
| 0.39 | 36.09 | 1.5672 | -0.9101 | |
| 0.58 | 42.50 | 1.8454 | -0.7845 | |
| 0.12 | 75.87 | 3.2948 | -0.6683 | |
| 1.04 | 51.65 | 2.2430 | -0.6585 | |
| 0.35 | 34.77 | 1.5099 | -0.6273 | |
| 0.65 | 22.39 | 0.9724 | -0.4311 |
13D/G Filings
This is a list of 13D and 13G filings made in the last year (if any). Click the link icon to see the full transaction history. Green rows indicate new positions. Red rows indicate closed positions.
| File Date | Form | Security | Prev Shares |
Current Shares |
ΔShares % | % Ownership |
% ΔOwnership | |
|---|---|---|---|---|---|---|---|---|
| 2025-05-09 | ABEQ / Unified Series Trust - Absolute Select Value ETF | 699,145 | 658,738 | -5.78 | 23.10 | -9.06 |
13F and Fund Filings
This form was filed on 2025-07-23 for the reporting period 2025-06-30. Click the link icon to see the full transaction history.
Upgrade to unlock premium data and export to Excel ![]() .
.
| Security | Type | Avg Share Price | Shares (MM) |
ΔShares (%) |
ΔShares (%) |
Value ($MM) |
Portfolio (%) |
ΔPortfolio (%) |
|
|---|---|---|---|---|---|---|---|---|---|
| VEA / Vanguard Tax-Managed Funds - Vanguard FTSE Developed Markets ETF | 2.85 | 0.56 | 162.40 | 12.79 | 7.0526 | -1.9488 | |||
| BOND / PIMCO ETF Trust - PIMCO Active Bond Exchange-Traded Fund | 1.60 | -1.78 | 147.08 | -2.09 | 6.3874 | -3.0034 | |||
| VOO / Vanguard Index Funds - Vanguard S&P 500 ETF | 0.20 | 5.74 | 112.13 | 16.88 | 4.8694 | -1.1280 | |||
| TOTL / SSGA Active Trust - SPDR DoubleLine Total Return Tactical ETF | 2.42 | -1.55 | 97.23 | -1.99 | 4.2226 | -1.9793 | |||
| IVV / iShares Trust - iShares Core S&P 500 ETF | 0.12 | 8.31 | 75.87 | 19.68 | 3.2948 | -0.6683 | |||
| VWO / Vanguard International Equity Index Funds - Vanguard FTSE Emerging Markets ETF | 1.04 | 1.84 | 51.65 | 11.29 | 2.2430 | -0.6585 | |||
| BND / Vanguard Bond Index Funds - Vanguard Total Bond Market ETF | 0.58 | 0.77 | 42.50 | 1.02 | 1.8454 | -0.7845 | |||
| BIL / SPDR Series Trust - SPDR Bloomberg 1-3 Month T-Bill ETF | 0.39 | -8.93 | 36.09 | -8.93 | 1.5672 | -0.9101 | |||
| AGG / iShares Trust - iShares Core U.S. Aggregate Bond ETF | 0.35 | 1.41 | 34.77 | 1.70 | 1.5099 | -0.6273 | |||
| ABEQ / Unified Series Trust - Absolute Select Value ETF | 0.65 | -0.86 | 22.39 | -0.26 | 0.9724 | -0.4311 | |||
| FLXR / TCW ETF Trust - TCW Flexible Income ETF | 0.56 | 8.27 | 22.29 | 9.05 | 0.9679 | -0.3099 | |||
| VO / Vanguard Index Funds - Vanguard Mid-Cap ETF | 0.08 | 4.44 | 21.05 | 13.01 | 0.9143 | -0.2505 | |||
| EPD / Enterprise Products Partners L.P. - Limited Partnership | 0.62 | 5.16 | 19.14 | -4.48 | 0.8310 | -0.4214 | |||
| SPLG / SPDR Series Trust - SPDR Portfolio S&P 500 ETF | 0.25 | 3.30 | 18.39 | 14.19 | 0.7987 | -0.2082 | |||
| VB / Vanguard Index Funds - Vanguard Small-Cap ETF | 0.07 | 6.05 | 16.91 | 13.33 | 0.7345 | -0.1985 | |||
| VNQ / Vanguard Specialized Funds - Vanguard Real Estate ETF | 0.18 | 1.79 | 15.88 | 0.13 | 0.6895 | -0.3018 | |||
| AVGO / Broadcom Inc. | 0.05 | -0.94 | 14.65 | 63.09 | 0.8517 | 0.2901 | |||
| IBM / International Business Machines Corporation | 0.05 | 0.48 | 14.62 | 19.11 | 0.8497 | 0.0825 | |||
| USFR / WisdomTree Trust - WisdomTree Floating Rate Treasury Fund | 0.28 | 14.18 | 14.24 | 14.13 | 0.6183 | -0.1615 | |||
| AMLP / ALPS ETF Trust - Alerian MLP ETF | 0.28 | 8.93 | 13.88 | 2.47 | 0.6028 | -0.2441 | |||
| MLPA / Global X Funds - Global X MLP ETF | 0.27 | 9.22 | 13.67 | 3.01 | 0.5938 | -0.2360 | |||
| ENB / Enbridge Inc. | 0.30 | 6.68 | 13.45 | 9.12 | 0.5842 | -0.1865 | |||
| IRM / Iron Mountain Incorporated | 0.13 | 10.67 | 13.17 | 31.93 | 0.7655 | 0.1415 | |||
| T / AT&T Inc. | 0.45 | 5.03 | 12.92 | 7.48 | 0.5610 | -0.1904 | |||
| CSCO / Cisco Systems, Inc. | 0.18 | 4.21 | 12.83 | 17.17 | 0.7457 | 0.0613 | |||
| MAIN / Main Street Capital Corporation | 0.22 | 11.23 | 12.73 | 16.22 | 0.5530 | -0.1320 | |||
| IEFA / iShares Trust - iShares Core MSCI EAFE ETF | 0.15 | 6.75 | 12.28 | 17.80 | 0.5334 | -0.1184 | |||
| NNN / NNN REIT, Inc. | 0.27 | 13.31 | 11.79 | 14.73 | 0.5122 | -0.1305 | |||
| ARCC / Ares Capital Corporation | 0.54 | 14.36 | 11.75 | 13.34 | 0.5104 | -0.1379 | |||
| MPLX / MPLX LP - Limited Partnership | 0.22 | 6.22 | 11.58 | 2.23 | 0.5028 | -0.2052 | |||
| KEX / Kirby Corporation | 0.10 | 19.15 | 11.51 | 33.79 | 0.4999 | -0.0380 | |||
| CSWC / Capital Southwest Corporation | 0.52 | 18.44 | 11.50 | 16.95 | 0.4993 | -0.1153 | |||
| HTGC / Hercules Capital, Inc. | 0.62 | 16.88 | 11.36 | 11.23 | 0.4934 | -0.1452 | |||
| VZ / Verizon Communications Inc. | 0.26 | 7.98 | 11.16 | 3.01 | 0.6489 | -0.0285 | |||
| ET / Energy Transfer LP - Limited Partnership | 0.61 | 10.86 | 11.07 | 8.12 | 0.4807 | -0.1593 | |||
| USRT / iShares Trust - iShares Core U.S. REIT ETF | 0.20 | 0.05 | 11.05 | -1.76 | 0.4797 | -0.2232 | |||
| MO / Altria Group, Inc. | 0.19 | 7.99 | 11.05 | 5.49 | 0.4797 | -0.1749 | |||
| OBDC / Blue Owl Capital Corporation | 0.77 | 14.46 | 11.00 | 11.96 | 0.4776 | -0.1365 | |||
| OKE / ONEOK, Inc. | 0.13 | 19.45 | 10.92 | -1.73 | 0.6350 | -0.0599 | |||
| VIST / Vista Energy, S.A.B. de C.V. - Depositary Receipt (Common Stock) | 0.23 | -3.42 | 10.80 | -0.83 | 0.6281 | -0.0530 | |||
| HAS / Hasbro, Inc. | 0.14 | 10.94 | 10.60 | 33.19 | 0.4603 | -0.0372 | |||
| IAGG / iShares Trust - iShares Core International Aggregate Bond ETF | 0.21 | 26.94 | 10.59 | 29.74 | 0.4599 | -0.0504 | |||
| BWX / SPDR Series Trust - SPDR Bloomberg International Treasury Bond ETF | 0.44 | 29.12 | 10.40 | 38.76 | 0.4518 | -0.0169 | |||
| GILD / Gilead Sciences, Inc. | 0.09 | 8.00 | 9.79 | 6.86 | 0.5693 | -0.0036 | |||
| CLH / Clean Harbors, Inc. | 0.04 | 8.34 | 9.69 | 27.08 | 0.4209 | -0.0559 | |||
| VICI / VICI Properties Inc. | 0.29 | 12.09 | 9.51 | 12.02 | 0.4131 | -0.1177 | |||
| KO / The Coca-Cola Company | 0.13 | 8.54 | 9.42 | 7.22 | 0.5473 | -0.0016 | |||
| ABBV / AbbVie Inc. | 0.05 | 12.75 | 9.29 | -0.11 | 0.5402 | -0.0414 | |||
| O / Realty Income Corporation | 0.16 | 13.84 | 9.27 | 13.06 | 0.5390 | 0.0263 | |||
| IJH / iShares Trust - iShares Core S&P Mid-Cap ETF | 0.15 | 7.39 | 9.21 | 14.15 | 0.4001 | -0.1045 | |||
| LKQ / LKQ Corporation | 0.24 | -0.07 | 8.98 | -13.06 | 0.3901 | -0.2558 | |||
| PG / The Procter & Gamble Company | 0.06 | 11.33 | 8.93 | 4.08 | 0.3879 | -0.1486 | |||
| CRH / CRH plc | 0.10 | -0.19 | 8.75 | 4.15 | 0.5089 | -0.0165 | |||
| DUK / Duke Energy Corporation | 0.07 | 10.86 | 8.60 | 7.24 | 0.5002 | -0.0013 | |||
| DOC / Healthpeak Properties, Inc. | 0.49 | 21.28 | 8.60 | 5.03 | 0.3737 | -0.1385 | |||
| IJR / iShares Trust - iShares Core S&P Small-Cap ETF | 0.08 | 6.99 | 8.45 | 11.83 | 0.3670 | -0.1054 | |||
| CIEN / Ciena Corporation | 0.10 | 12.86 | 8.40 | 51.88 | 0.3649 | 0.0191 | |||
| PAYX / Paychex, Inc. | 0.06 | 10.18 | 8.37 | 3.87 | 0.3633 | -0.1402 | |||
| AZO / AutoZone, Inc. | 0.00 | 8.00 | 8.22 | 5.14 | 0.3571 | -0.1318 | |||
| SGI / Somnigroup International Inc. | 0.12 | -0.26 | 8.20 | 13.34 | 0.4766 | 0.0244 | |||
| MRK / Merck & Co., Inc. | 0.10 | 26.23 | 8.05 | 11.33 | 0.4678 | 0.0159 | |||
| ED / Consolidated Edison, Inc. | 0.08 | 9.24 | 8.02 | -0.88 | 0.4660 | -0.0396 | |||
| HRB / H&R Block, Inc. | 0.14 | 8.70 | 7.91 | 8.66 | 0.4596 | 0.0047 | |||
| PEP / PepsiCo, Inc. | 0.06 | 18.78 | 7.89 | 4.60 | 0.3427 | -0.1290 | |||
| MSM / MSC Industrial Direct Co., Inc. | 0.09 | 13.75 | 7.85 | 24.52 | 0.3409 | -0.0532 | |||
| PNFP / Pinnacle Financial Partners, Inc. | 0.07 | 0.59 | 7.36 | 4.74 | 0.3198 | -0.1198 | |||
| PFE / Pfizer Inc. | 0.30 | 22.10 | 7.24 | 16.81 | 0.3144 | -0.0731 | |||
| MSFT / Microsoft Corporation | 0.01 | -7.68 | 5.97 | 22.32 | 0.3470 | 0.0419 | |||
| MAS / Masco Corporation | 0.09 | 2.55 | 5.61 | -5.09 | 0.3260 | -0.0434 | |||
| WES / Western Midstream Partners, LP - Limited Partnership | 0.14 | 2.32 | 5.51 | -3.32 | 0.2394 | -0.1171 | |||
| RBA / RB Global, Inc. | 0.05 | -28.99 | 5.34 | -24.82 | 0.2319 | -0.2122 | |||
| AAPL / Apple Inc. | 0.03 | -17.46 | 5.25 | -23.77 | 0.3055 | -0.1254 | |||
| AMCR / Amcor plc | 0.56 | 5.13 | 0.2982 | 0.2982 | |||||
| PGR / The Progressive Corporation | 0.02 | -30.22 | 4.81 | -34.20 | 0.2090 | -0.2482 | |||
| ORCL / Oracle Corporation | 0.02 | -2.72 | 4.53 | 52.13 | 0.2635 | 0.0772 | |||
| GPK / Graphic Packaging Holding Company | 0.21 | 3.51 | 4.50 | -15.99 | 0.1953 | -0.1393 | |||
| FANG / Diamondback Energy, Inc. | 0.03 | 4.57 | 4.34 | -10.14 | 0.2524 | -0.0496 | |||
| EDV / Vanguard World Fund - Vanguard Extended Duration Treasury ETF | 0.06 | 8.73 | 4.04 | 2.90 | 0.1754 | -0.0700 | |||
| HQY / HealthEquity, Inc. | 0.03 | 3.62 | 0.2104 | 0.2104 | |||||
| GOOG / Alphabet Inc. | 0.02 | -0.05 | 3.25 | 13.48 | 0.1411 | -0.0379 | |||
| LLY / Eli Lilly and Company | 0.00 | 0.52 | 3.19 | -5.15 | 0.1854 | -0.0248 | |||
| FLR / Fluor Corporation | 0.06 | 0.00 | 3.13 | 43.13 | 0.1818 | 0.0452 | |||
| AMZN / Amazon.com, Inc. | 0.01 | -23.60 | 2.91 | -11.92 | 0.1265 | -0.0802 | |||
| BRK.B / Berkshire Hathaway Inc. | 0.01 | -10.32 | 2.87 | -18.21 | 0.1245 | -0.0946 | |||
| KNX / Knight-Swift Transportation Holdings Inc. | 0.06 | 3.18 | 2.86 | 4.95 | 0.1243 | -0.0462 | |||
| ADBE / Adobe Inc. | 0.01 | 7.82 | 2.79 | 8.80 | 0.1624 | 0.0018 | |||
| IWS / iShares Trust - iShares Russell Mid-Cap Value ETF | 0.02 | 13.84 | 2.74 | 19.43 | 0.1188 | -0.0244 | |||
| TCBI / Texas Capital Bancshares, Inc. | 0.03 | 0.91 | 2.59 | 7.24 | 0.1508 | -0.0004 | |||
| VSS / Vanguard International Equity Index Funds - Vanguard FTSE All-World ex-US Small-Cap ETF | 0.02 | 2.03 | 2.51 | 18.65 | 0.1089 | -0.0233 | |||
| GPOR / Gulfport Energy Corporation | 0.01 | 15.57 | 2.49 | 26.25 | 0.1082 | -0.0152 | |||
| KLAC / KLA Corporation | 0.00 | -7.48 | 2.48 | 21.87 | 0.1077 | -0.0195 | |||
| AMAT / Applied Materials, Inc. | 0.01 | 5.93 | 2.45 | 33.66 | 0.1066 | -0.0082 | |||
| MA / Mastercard Incorporated | 0.00 | -7.60 | 2.43 | -5.30 | 0.1413 | -0.0191 | |||
| META / Meta Platforms, Inc. | 0.00 | -7.22 | 2.35 | 18.79 | 0.1368 | 0.0130 | |||
| ABT / Abbott Laboratories | 0.02 | -1.23 | 2.31 | 1.27 | 0.1341 | -0.0083 | |||
| HOMB / Home Bancshares, Inc. (Conway, AR) | 0.08 | -1.77 | 2.28 | -1.13 | 0.0992 | -0.0452 | |||
| GBIL / Goldman Sachs ETF Trust - Goldman Sachs Access Treasury 0-1 Year ETF | 0.02 | -4.50 | 2.28 | -4.52 | 0.0991 | -0.0503 | |||
| TRV / The Travelers Companies, Inc. | 0.01 | -5.15 | 2.24 | -4.07 | 0.1303 | -0.0157 | |||
| ROP / Roper Technologies, Inc. | 0.00 | -8.23 | 2.09 | -11.76 | 0.0909 | -0.0574 | |||
| ASO / Academy Sports and Outdoors, Inc. | 0.05 | 2.70 | 2.02 | 0.90 | 0.0876 | -0.0374 | |||
| SCVL / Shoe Carnival, Inc. | 0.11 | 12.03 | 1.98 | -4.68 | 0.0859 | -0.0438 | |||
| BANF / BancFirst Corporation | 0.02 | 6.62 | 1.96 | 19.94 | 0.0852 | -0.0170 | |||
| EXP / Eagle Materials Inc. | 0.01 | 0.65 | 1.95 | -8.36 | 0.1134 | -0.0197 | |||
| CBRE / CBRE Group, Inc. | 0.01 | 5.41 | 1.95 | 12.94 | 0.0846 | -0.0232 | |||
| DIS / The Walt Disney Company | 0.02 | 6.25 | 1.95 | 33.49 | 0.0845 | -0.0066 | |||
| ETD / Ethan Allen Interiors Inc. | 0.07 | 5.29 | 1.92 | 5.90 | 0.0834 | -0.0300 | |||
| AMP / Ameriprise Financial, Inc. | 0.00 | 6.15 | 1.92 | 17.04 | 0.0832 | -0.0192 | |||
| AMH / American Homes 4 Rent | 0.05 | 0.39 | 1.88 | -4.19 | 0.0814 | -0.0410 | |||
| VUG / Vanguard Index Funds - Vanguard Growth ETF | 0.00 | 25.03 | 1.83 | 47.85 | 0.0793 | 0.0021 | |||
| BNDX / Vanguard Charlotte Funds - Vanguard Total International Bond ETF | 0.04 | 2.39 | 1.82 | 3.88 | 0.0790 | -0.0305 | |||
| HPQ / HP Inc. | 0.07 | 6.69 | 1.75 | -5.76 | 0.1019 | -0.0144 | |||
| BC / Brunswick Corporation | 0.03 | 1.73 | 0.0753 | 0.0753 | |||||
| STKL / SunOpta Inc. | 0.30 | -16.48 | 1.72 | -0.35 | 0.0749 | -0.0333 | |||
| GOOGL / Alphabet Inc. | 0.01 | 17.47 | 1.72 | 33.83 | 0.0748 | -0.0056 | |||
| PX / P10, Inc. | 0.17 | 15.11 | 1.72 | 0.17 | 0.0747 | -0.0327 | |||
| TFIN / Triumph Financial, Inc. | 0.03 | 13.71 | 1.66 | 8.44 | 0.0720 | -0.0236 | |||
| TLT / iShares Trust - iShares 20+ Year Treasury Bond ETF | 0.02 | 5.89 | 1.59 | 2.64 | 0.0692 | -0.0278 | |||
| CMC / Commercial Metals Company | 0.03 | 12.81 | 1.58 | 19.95 | 0.0687 | -0.0138 | |||
| BAC / Bank of America Corporation | 0.03 | 10.06 | 1.57 | 24.82 | 0.0913 | 0.0126 | |||
| L / Loews Corporation | 0.02 | -11.38 | 1.57 | -11.61 | 0.0912 | -0.0198 | |||
| JPM / JPMorgan Chase & Co. | 0.01 | 1.66 | 1.56 | 20.17 | 0.0908 | 0.0095 | |||
| SBUX / Starbucks Corporation | 0.02 | 19.86 | 1.53 | 11.93 | 0.0889 | 0.0035 | |||
| APTV / Aptiv PLC | 0.02 | -4.93 | 1.50 | 9.02 | 0.0651 | -0.0209 | |||
| UL / Unilever PLC - Depositary Receipt (Common Stock) | 0.02 | -6.46 | 1.47 | -3.92 | 0.0639 | -0.0318 | |||
| NFLX / Netflix, Inc. | 0.00 | -1.35 | 1.47 | 41.76 | 0.0855 | 0.0206 | |||
| BANC / Banc of California, Inc. | 0.10 | -22.71 | 1.45 | -23.48 | 0.0842 | -0.0341 | |||
| CLF / Cleveland-Cliffs Inc. | 0.19 | 0.32 | 1.44 | -7.21 | 0.0626 | -0.0346 | |||
| PRIM / Primoris Services Corporation | 0.02 | 1.41 | 0.0613 | 0.0613 | |||||
| TMO / Thermo Fisher Scientific Inc. | 0.00 | 7.73 | 1.40 | -12.20 | 0.0812 | -0.0183 | |||
| SHOP / Shopify Inc. | 0.01 | -0.76 | 1.38 | 19.95 | 0.0801 | 0.0082 | |||
| V / Visa Inc. | 0.00 | -2.66 | 1.38 | -1.36 | 0.0598 | -0.0275 | |||
| DRI / Darden Restaurants, Inc. | 0.01 | -18.67 | 1.37 | -14.68 | 0.0596 | -0.0410 | |||
| PWR / Quanta Services, Inc. | 0.00 | 12.09 | 1.36 | 66.87 | 0.0791 | 0.0281 | |||
| DHI / D.R. Horton, Inc. | 0.01 | 0.98 | 1.34 | 2.46 | 0.0580 | -0.0235 | |||
| VIGI / Vanguard Whitehall Funds - Vanguard International Dividend Appreciation ETF | 0.01 | 0.61 | 1.33 | 9.30 | 0.0577 | -0.0183 | |||
| KTB / Kontoor Brands, Inc. | 0.02 | 2.02 | 1.33 | 4.90 | 0.0577 | -0.0214 | |||
| FNV / Franco-Nevada Corporation | 0.01 | -2.84 | 1.32 | 1.07 | 0.0573 | -0.0243 | |||
| HALO / Halozyme Therapeutics, Inc. | 0.03 | -17.24 | 1.32 | -32.53 | 0.0571 | -0.0648 | |||
| AVNW / Aviat Networks, Inc. | 0.05 | 2.71 | 1.31 | 28.85 | 0.0570 | -0.0067 | |||
| NVGS / Navigator Holdings Ltd. | 0.09 | 25.22 | 1.30 | 33.06 | 0.0567 | -0.0046 | |||
| MET / MetLife, Inc. | 0.02 | 5.90 | 1.29 | 6.01 | 0.0560 | -0.0200 | |||
| TMHC / Taylor Morrison Home Corporation | 0.02 | -26.72 | 1.28 | -25.04 | 0.0741 | -0.0322 | |||
| LOW / Lowe's Companies, Inc. | 0.01 | 0.48 | 1.26 | -4.39 | 0.0734 | -0.0092 | |||
| BX / Blackstone Inc. | 0.01 | 0.68 | 1.25 | 7.77 | 0.0542 | -0.0182 | |||
| GPI / Group 1 Automotive, Inc. | 0.00 | 8.27 | 1.25 | 23.86 | 0.0725 | 0.0095 | |||
| WMT / Walmart Inc. | 0.01 | -0.52 | 1.23 | 10.78 | 0.0536 | -0.0160 | |||
| HMN / Horace Mann Educators Corporation | 0.03 | 6.55 | 1.20 | 7.13 | 0.0522 | -0.0179 | |||
| JMX / MaxLinear, Inc. | 0.08 | 1.19 | 0.0691 | 0.0691 | |||||
| KMI / Kinder Morgan, Inc. | 0.04 | 49.60 | 1.17 | 54.16 | 0.0507 | 0.0034 | |||
| MDT / Medtronic plc | 0.01 | -17.20 | 1.16 | -19.64 | 0.0503 | -0.0398 | |||
| TSEM / Tower Semiconductor Ltd. | 0.03 | 17.25 | 1.14 | 42.64 | 0.0497 | -0.0005 | |||
| WAB / Westinghouse Air Brake Technologies Corporation | 0.01 | 5.36 | 1.14 | 21.60 | 0.0497 | -0.0091 | |||
| FI / Fiserv, Inc. | 0.01 | 8.47 | 1.11 | -15.36 | 0.0481 | -0.0337 | |||
| STRS / Stratus Properties Inc. | 0.06 | 6.76 | 1.09 | 13.49 | 0.0475 | -0.0127 | |||
| URI / United Rentals, Inc. | 0.00 | 8.60 | 1.09 | 30.59 | 0.0636 | 0.0112 | |||
| THG / The Hanover Insurance Group, Inc. | 0.01 | 7.72 | 1.09 | 5.20 | 0.0636 | -0.0014 | |||
| AON / Aon plc | 0.00 | 3.90 | 1.09 | -7.14 | 0.0475 | -0.0261 | |||
| PBPB / Potbelly Corporation | 0.09 | 1.18 | 1.09 | 30.38 | 0.0473 | -0.0049 | |||
| BLBD / Blue Bird Corporation | 0.03 | -4.22 | 1.09 | 27.67 | 0.0473 | -0.0060 | |||
| AEM / Agnico Eagle Mines Limited | 0.01 | -10.51 | 1.09 | -1.80 | 0.0633 | -0.0060 | |||
| CVX / Chevron Corporation | 0.01 | 3.48 | 1.09 | -11.42 | 0.0472 | -0.0295 | |||
| MCD / McDonald's Corporation | 0.00 | 0.57 | 1.04 | -5.98 | 0.0603 | -0.0086 | |||
| CMI / Cummins Inc. | 0.00 | 13.19 | 1.04 | 18.26 | 0.0603 | 0.0055 | |||
| UNP / Union Pacific Corporation | 0.00 | 5.26 | 1.03 | 2.49 | 0.0600 | -0.0029 | |||
| KDP / Keurig Dr Pepper Inc. | 0.03 | 3.83 | 1.02 | 0.39 | 0.0443 | -0.0193 | |||
| TGT / Target Corporation | 0.01 | 43.33 | 1.01 | 35.53 | 0.0437 | -0.0027 | |||
| PBA / Pembina Pipeline Corporation | 0.03 | 64.58 | 0.99 | 54.19 | 0.0431 | 0.0029 | |||
| MTDR / Matador Resources Company | 0.02 | 0.99 | 0.0576 | 0.0576 | |||||
| AZZ / AZZ Inc. | 0.01 | 61.85 | 0.98 | 82.93 | 0.0424 | 0.0090 | |||
| TSN / Tyson Foods, Inc. | 0.02 | 6.18 | 0.97 | -6.88 | 0.0566 | -0.0088 | |||
| HTH / Hilltop Holdings Inc. | 0.03 | -31.93 | 0.97 | -32.21 | 0.0420 | -0.0471 | |||
| DNL / WisdomTree Trust - WisdomTree Global ex-U.S. Quality Dividend Growth Fund | 0.02 | 0.82 | 0.97 | 13.78 | 0.0420 | -0.0111 | |||
| CNK / Cinemark Holdings, Inc. | 0.03 | -23.57 | 0.96 | -7.34 | 0.0417 | -0.0231 | |||
| RXO / RXO, Inc. | 0.06 | 7.40 | 0.94 | -11.56 | 0.0409 | -0.0257 | |||
| TRP / TC Energy Corporation | 0.02 | 54.51 | 0.94 | 59.73 | 0.0407 | 0.0040 | |||
| MCK / McKesson Corporation | 0.00 | 0.16 | 0.94 | 9.09 | 0.0406 | -0.0130 | |||
| NATL / NCR Atleos Corporation | 0.03 | 8.39 | 0.93 | 17.21 | 0.0405 | -0.0092 | |||
| XEL / Xcel Energy Inc. | 0.01 | -8.88 | 0.92 | -12.38 | 0.0535 | -0.0121 | |||
| STZ / Constellation Brands, Inc. | 0.01 | 27.36 | 0.92 | 12.95 | 0.0533 | 0.0025 | |||
| BLDR / Builders FirstSource, Inc. | 0.01 | -9.83 | 0.90 | -15.84 | 0.0393 | -0.0279 | |||
| INCY / Incyte Corporation | 0.01 | 15.60 | 0.90 | 30.10 | 0.0391 | -0.0042 | |||
| MRTN / Marten Transport, Ltd. | 0.07 | 7.88 | 0.90 | 2.05 | 0.0390 | -0.0160 | |||
| BK / The Bank of New York Mellon Corporation | 0.01 | 2.24 | 0.90 | 11.03 | 0.0521 | 0.0017 | |||
| CVS / CVS Health Corporation | 0.01 | -11.53 | 0.90 | -9.96 | 0.0521 | -0.0101 | |||
| ZTS / Zoetis Inc. | 0.01 | -0.30 | 0.88 | -5.48 | 0.0512 | -0.0071 | |||
| SYK / Stryker Corporation | 0.00 | 6.48 | 0.88 | 13.16 | 0.0381 | -0.0104 | |||
| BELFB / Bel Fuse Inc. | 0.01 | -42.24 | 0.87 | -24.61 | 0.0379 | -0.0345 | |||
| NEA / Nuveen AMT-Free Quality Municipal Income Fund | 0.08 | -15.45 | 0.87 | -17.59 | 0.0377 | -0.0281 | |||
| NOW / ServiceNow, Inc. | 0.00 | 35.99 | 0.86 | 75.82 | 0.0373 | 0.0067 | |||
| CTVA / Corteva, Inc. | 0.01 | -7.80 | 0.84 | 9.27 | 0.0487 | 0.0007 | |||
| HLMN / Hillman Solutions Corp. | 0.12 | 0.83 | 0.0484 | 0.0484 | |||||
| DHR / Danaher Corporation | 0.00 | 24.82 | 0.81 | 20.27 | 0.0469 | 0.0050 | |||
| NOV / NOV Inc. | 0.06 | 0.00 | 0.78 | -18.34 | 0.0453 | -0.0144 | |||
| EOG / EOG Resources, Inc. | 0.01 | -9.43 | 0.75 | -15.48 | 0.0435 | -0.0119 | |||
| VLO / Valero Energy Corporation | 0.01 | 5.62 | 0.75 | 7.48 | 0.0434 | -0.0000 | |||
| HSY / The Hershey Company | 0.00 | -4.16 | 0.74 | -7.06 | 0.0320 | -0.0176 | |||
| PEG / Public Service Enterprise Group Incorporated | 0.01 | 7.21 | 0.73 | 9.76 | 0.0425 | 0.0008 | |||
| DTE / DTE Energy Company | 0.01 | -1.46 | 0.73 | -5.68 | 0.0425 | -0.0059 | |||
| PHYS / Sprott Physical Gold Trust | 0.03 | -10.18 | 0.72 | -5.29 | 0.0416 | -0.0057 | |||
| SLB / Schlumberger Limited | 0.02 | 70.98 | 0.71 | 38.40 | 0.0413 | 0.0092 | |||
| CMCSA / Comcast Corporation | 0.02 | -7.30 | 0.71 | -10.38 | 0.0412 | -0.0082 | |||
| TIPT / Tiptree Inc. | 0.03 | -5.54 | 0.70 | -7.51 | 0.0305 | -0.0170 | |||
| DG / Dollar General Corporation | 0.01 | 1.91 | 0.69 | 32.69 | 0.0401 | 0.0076 | |||
| MSCI / MSCI Inc. | 0.00 | -0.75 | 0.69 | 1.33 | 0.0398 | -0.0025 | |||
| COP / ConocoPhillips | 0.01 | 8.34 | 0.68 | -7.41 | 0.0293 | -0.0163 | |||
| LHX / L3Harris Technologies, Inc. | 0.00 | 2.37 | 0.67 | 22.63 | 0.0391 | 0.0048 | |||
| NVG / Nuveen AMT-Free Municipal Credit Income Fund | 0.06 | -24.04 | 0.66 | -26.79 | 0.0289 | -0.0279 | |||
| LOVE / The Lovesac Company | 0.04 | 0.66 | 0.0384 | 0.0384 | |||||
| REGN / Regeneron Pharmaceuticals, Inc. | 0.00 | 39.82 | 0.66 | 15.79 | 0.0384 | 0.0027 | |||
| AEE / Ameren Corporation | 0.01 | 3.82 | 0.66 | -0.76 | 0.0285 | -0.0128 | |||
| WRB / W. R. Berkley Corporation | 0.01 | 2.55 | 0.66 | 5.82 | 0.0381 | -0.0006 | |||
| GLD / SPDR Gold Trust | 0.00 | 3.88 | 0.65 | 9.76 | 0.0380 | 0.0008 | |||
| GBX / The Greenbrier Companies, Inc. | 0.01 | -46.63 | 0.65 | -52.02 | 0.0379 | -0.0471 | |||
| EHC / Encompass Health Corporation | 0.01 | -19.02 | 0.64 | -1.98 | 0.0375 | -0.0036 | |||
| SSNC / SS&C Technologies Holdings, Inc. | 0.01 | 2.84 | 0.64 | 1.91 | 0.0279 | -0.0115 | |||
| XOM / Exxon Mobil Corporation | 0.01 | 0.89 | 0.64 | -8.50 | 0.0276 | -0.0158 | |||
| ABNB / Airbnb, Inc. | 0.00 | -2.89 | 0.63 | 7.46 | 0.0369 | 0.0000 | |||
| MCHP / Microchip Technology Incorporated | 0.01 | 10.65 | 0.63 | 60.93 | 0.0364 | 0.0121 | |||
| HON / Honeywell International Inc. | 0.00 | -5.93 | 0.62 | 3.51 | 0.0361 | -0.0014 | |||
| OGE / OGE Energy Corp. | 0.01 | 2.02 | 0.61 | -1.61 | 0.0265 | -0.0122 | |||
| HIG / The Hartford Insurance Group, Inc. | 0.00 | 2.58 | 0.61 | 5.18 | 0.0265 | -0.0098 | |||
| SAP / SAP SE - Depositary Receipt (Common Stock) | 0.00 | -0.05 | 0.61 | 13.25 | 0.0264 | -0.0072 | |||
| PB / Prosperity Bancshares, Inc. | 0.01 | 3.15 | 0.60 | 1.52 | 0.0350 | -0.0021 | |||
| AIZ / Assurant, Inc. | 0.00 | 3.31 | 0.60 | -2.76 | 0.0348 | -0.0037 | |||
| DGX / Quest Diagnostics Incorporated | 0.00 | 3.39 | 0.60 | 9.76 | 0.0259 | -0.0081 | |||
| ACN / Accenture plc | 0.00 | -3.95 | 0.60 | -8.02 | 0.0347 | -0.0059 | |||
| CAT / Caterpillar Inc. | 0.00 | 0.39 | 0.60 | 18.25 | 0.0347 | 0.0031 | |||
| JNJ / Johnson & Johnson | 0.00 | -0.59 | 0.59 | -8.47 | 0.0258 | -0.0148 | |||
| ARW / Arrow Electronics, Inc. | 0.00 | 2.46 | 0.59 | 25.90 | 0.0258 | -0.0037 | |||
| GEHC / GE HealthCare Technologies Inc. | 0.01 | 1.41 | 0.59 | -6.91 | 0.0345 | -0.0054 | |||
| PYLD / PIMCO ETF Trust - PIMCO Multisector Bond Active Exchange-Traded Fund | 0.02 | 25.85 | 0.59 | 26.72 | 0.0256 | -0.0035 | |||
| JAZZ / Jazz Pharmaceuticals plc | 0.01 | 20.08 | 0.59 | 2.62 | 0.0342 | -0.0016 | |||
| CE / Celanese Corporation | 0.01 | 22.45 | 0.59 | 19.31 | 0.0255 | -0.0053 | |||
| GEO / The GEO Group, Inc. | 0.02 | 0.58 | 0.0339 | 0.0339 | |||||
| HDV / iShares Trust - iShares Core High Dividend ETF | 0.00 | -3.94 | 0.58 | -7.06 | 0.0252 | -0.0138 | |||
| SHW / The Sherwin-Williams Company | 0.00 | 4.40 | 0.58 | 2.67 | 0.0251 | -0.0101 | |||
| TTWO / Take-Two Interactive Software, Inc. | 0.00 | 1.81 | 0.57 | 19.33 | 0.0334 | 0.0033 | |||
| ATO / Atmos Energy Corporation | 0.00 | 2.99 | 0.57 | 2.68 | 0.0249 | -0.0100 | |||
| BWA / BorgWarner Inc. | 0.02 | 2.34 | 0.57 | 19.79 | 0.0331 | 0.0033 | |||
| MMM / 3M Company | 0.00 | 0.00 | 0.56 | 3.69 | 0.0327 | -0.0012 | |||
| LFUS / Littelfuse, Inc. | 0.00 | 21.74 | 0.56 | 40.20 | 0.0325 | 0.0076 | |||
| RGA / Reinsurance Group of America, Incorporated | 0.00 | 6.47 | 0.56 | 7.32 | 0.0242 | -0.0083 | |||
| DOV / Dover Corporation | 0.00 | 2.74 | 0.56 | 7.32 | 0.0242 | -0.0083 | |||
| GTES / Gates Industrial Corporation plc | 0.02 | 15.44 | 0.56 | 44.68 | 0.0242 | 0.0001 | |||
| WDAY / Workday, Inc. | 0.00 | -0.56 | 0.55 | 2.23 | 0.0320 | -0.0017 | |||
| USFD / US Foods Holding Corp. | 0.01 | 1.64 | 0.55 | 19.61 | 0.0239 | -0.0049 | |||
| CNP / CenterPoint Energy, Inc. | 0.01 | -21.44 | 0.54 | -20.38 | 0.0236 | -0.0191 | |||
| REG / Regency Centers Corporation | 0.01 | 7.95 | 0.53 | 4.35 | 0.0307 | -0.0010 | |||
| AVY / Avery Dennison Corporation | 0.00 | 22.62 | 0.53 | 20.92 | 0.0306 | 0.0034 | |||
| ITT / ITT Inc. | 0.00 | 1.73 | 0.53 | 23.53 | 0.0228 | -0.0038 | |||
| VTI / Vanguard Index Funds - Vanguard Total Stock Market ETF | 0.00 | -1.15 | 0.52 | 9.22 | 0.0227 | -0.0072 | |||
| IFF / International Flavors & Fragrances Inc. | 0.01 | -45.78 | 0.51 | -48.65 | 0.0223 | -0.0403 | |||
| RF / Regions Financial Corporation | 0.02 | 2.36 | 0.51 | 10.78 | 0.0299 | 0.0009 | |||
| WY / Weyerhaeuser Company | 0.02 | 26.00 | 0.51 | 10.63 | 0.0222 | -0.0067 | |||
| PR / Permian Resources Corporation | 0.04 | 8.27 | 0.51 | 6.51 | 0.0295 | -0.0003 | |||
| CAG / Conagra Brands, Inc. | 0.02 | 3.74 | 0.50 | -20.41 | 0.0291 | -0.0102 | |||
| CTRA / Coterra Energy Inc. | 0.02 | 32.26 | 0.50 | 16.12 | 0.0216 | -0.0052 | |||
| RJF / Raymond James Financial, Inc. | 0.00 | 2.56 | 0.49 | 13.16 | 0.0213 | -0.0058 | |||
| IDXX / IDEXX Laboratories, Inc. | 0.00 | 0.49 | 0.0283 | 0.0283 | |||||
| SYY / Sysco Corporation | 0.01 | 0.48 | 0.0282 | 0.0282 | |||||
| AGCO / AGCO Corporation | 0.00 | -0.13 | 0.48 | 11.32 | 0.0209 | -0.0061 | |||
| HD / The Home Depot, Inc. | 0.00 | -1.28 | 0.48 | -1.23 | 0.0209 | -0.0096 | |||
| MELI / MercadoLibre, Inc. | 0.00 | 0.00 | 0.48 | 34.08 | 0.0280 | 0.0055 | |||
| AVB / AvalonBay Communities, Inc. | 0.00 | 11.31 | 0.48 | 5.49 | 0.0209 | -0.0076 | |||
| BR / Broadridge Financial Solutions, Inc. | 0.00 | 3.25 | 0.48 | 3.68 | 0.0208 | -0.0081 | |||
| RRX / Regal Rexnord Corporation | 0.00 | 16.52 | 0.47 | 48.28 | 0.0275 | 0.0076 | |||
| RSG / Republic Services, Inc. | 0.00 | -15.05 | 0.47 | -13.53 | 0.0205 | -0.0137 | |||
| STAG / STAG Industrial, Inc. | 0.01 | 2.39 | 0.47 | 2.83 | 0.0275 | -0.0013 | |||
| BJ / BJ's Wholesale Club Holdings, Inc. | 0.00 | -18.07 | 0.46 | -22.52 | 0.0200 | -0.0172 | |||
| OMC / Omnicom Group Inc. | 0.01 | 14.36 | 0.45 | -0.66 | 0.0195 | -0.0088 | |||
| VFMO / Vanguard Wellington Fund - Vanguard U.S. Momentum Factor ETF | 0.00 | -12.59 | 0.45 | -0.67 | 0.0195 | -0.0087 | |||
| PDO / Pimco Dynamic Income Opportunities Fund | 0.03 | 2.83 | 0.45 | -0.22 | 0.0194 | -0.0086 | |||
| IXUS / iShares Trust - iShares Core MSCI Total International Stock ETF | 0.01 | 0.43 | 0.0253 | 0.0253 | |||||
| ZBH / Zimmer Biomet Holdings, Inc. | 0.00 | 6.84 | 0.43 | -13.94 | 0.0188 | -0.0126 | |||
| EMN / Eastman Chemical Company | 0.01 | 0.43 | 0.0188 | 0.0188 | |||||
| BKR / Baker Hughes Company | 0.01 | 3.34 | 0.43 | -9.81 | 0.0188 | -0.0112 | |||
| CB / Chubb Limited | 0.00 | 0.28 | 0.42 | -3.65 | 0.0183 | -0.0091 | |||
| LAD / Lithia Motors, Inc. | 0.00 | 13.78 | 0.42 | 31.15 | 0.0183 | -0.0018 | |||
| PHM / PulteGroup, Inc. | 0.00 | 14.31 | 0.42 | 17.37 | 0.0182 | -0.0041 | |||
| QQQ / Invesco QQQ Trust, Series 1 | 0.00 | 0.00 | 0.42 | 17.70 | 0.0182 | -0.0041 | |||
| MOH / Molina Healthcare, Inc. | 0.00 | 4.94 | 0.41 | -5.08 | 0.0179 | -0.0092 | |||
| PAYC / Paycom Software, Inc. | 0.00 | -0.95 | 0.41 | 5.13 | 0.0238 | -0.0006 | |||
| WCC / WESCO International, Inc. | 0.00 | 0.41 | 0.0236 | 0.0236 | |||||
| DE / Deere & Company | 0.00 | 0.00 | 0.40 | 8.36 | 0.0234 | 0.0002 | |||
| JPC / Nuveen Preferred & Income Opportunities Fund | 0.05 | 0.00 | 0.40 | 0.75 | 0.0174 | -0.0075 | |||
| GPN / Global Payments Inc. | 0.00 | 6.13 | 0.40 | -13.35 | 0.0230 | -0.0055 | |||
| HDB / HDFC Bank Limited - Depositary Receipt (Common Stock) | 0.00 | 2.30 | 0.38 | 17.96 | 0.0222 | 0.0020 | |||
| CSGP / CoStar Group, Inc. | 0.00 | 13.79 | 0.37 | 15.43 | 0.0218 | 0.0015 | |||
| CPB / The Campbell's Company | 0.01 | 61.01 | 0.37 | 23.84 | 0.0218 | 0.0028 | |||
| APD / Air Products and Chemicals, Inc. | 0.00 | 0.37 | 0.0213 | 0.0213 | |||||
| CPT / Camden Property Trust | 0.00 | 65.60 | 0.36 | 52.54 | 0.0157 | 0.0009 | |||
| PMO / Putnam Municipal Opportunities Trust | 0.04 | 1.16 | 0.36 | -1.92 | 0.0156 | -0.0073 | |||
| SKX / Skechers U.S.A., Inc. | 0.01 | 0.04 | 0.36 | 11.29 | 0.0207 | 0.0007 | |||
| VOT / Vanguard Index Funds - Vanguard Mid-Cap Growth ETF | 0.00 | 32.45 | 0.36 | 54.35 | 0.0154 | 0.0010 | |||
| CME / CME Group Inc. | 0.00 | -4.54 | 0.35 | -0.85 | 0.0151 | -0.0068 | |||
| SHY / iShares Trust - iShares 1-3 Year Treasury Bond ETF | 0.00 | -2.01 | 0.34 | -2.00 | 0.0200 | -0.0019 | |||
| UGI / UGI Corporation | 0.01 | 13.22 | 0.33 | 25.00 | 0.0141 | -0.0022 | |||
| ASML / ASML Holding N.V. - Depositary Receipt (Common Stock) | 0.00 | -4.36 | 0.32 | 15.75 | 0.0184 | 0.0013 | |||
| WTW / Willis Towers Watson Public Limited Company | 0.00 | 0.00 | 0.32 | -9.22 | 0.0137 | -0.0080 | |||
| ZVIA / Zevia PBC | 0.10 | 0.31 | 0.0183 | 0.0183 | |||||
| FBTC / Fidelity Wise Origin Bitcoin Fund | 0.00 | -48.20 | 0.31 | -32.40 | 0.0136 | -0.0154 | |||
| TM / Toyota Motor Corporation - Depositary Receipt (Common Stock) | 0.00 | 0.00 | 0.28 | -2.44 | 0.0122 | -0.0058 | |||
| SPMO / Invesco Exchange-Traded Fund Trust II - Invesco S&P 500 Momentum ETF | 0.00 | -5.23 | 0.28 | 15.42 | 0.0120 | -0.0030 | |||
| GIS / General Mills, Inc. | 0.01 | 1.07 | 0.27 | -12.66 | 0.0117 | -0.0075 | |||
| IBIT / iShares Bitcoin Trust ETF | 0.00 | 0.00 | 0.26 | 30.69 | 0.0115 | -0.0012 | |||
| VONG / Vanguard Scottsdale Funds - Vanguard Russell 1000 Growth ETF | 0.00 | 0.13 | 0.25 | 17.67 | 0.0110 | -0.0024 | |||
| PPA / Invesco Exchange-Traded Fund Trust - Invesco Aerospace & Defense ETF | 0.00 | 0.12 | 0.24 | 21.39 | 0.0106 | -0.0019 | |||
| IT / Gartner, Inc. | 0.00 | -0.66 | 0.24 | -4.31 | 0.0142 | -0.0018 | |||
| HUBB / Hubbell Incorporated | 0.00 | 0.24 | 0.0141 | 0.0141 | |||||
| TYL / Tyler Technologies, Inc. | 0.00 | -0.26 | 0.23 | 1.76 | 0.0101 | -0.0042 | |||
| ICLR / ICON Public Limited Company | 0.00 | -0.26 | 0.22 | -17.23 | 0.0129 | -0.0038 | |||
| MNDY / monday.com Ltd. | 0.00 | 0.22 | 0.0125 | 0.0125 | |||||
| SNEX / StoneX Group Inc. | 0.00 | 0.21 | 0.0093 | 0.0093 | |||||
| NVDA / NVIDIA Corporation | 0.00 | -49.03 | 0.21 | -25.54 | 0.0090 | -0.0084 | |||
| TSLA / Tesla, Inc. | 0.00 | -19.08 | 0.20 | -0.49 | 0.0117 | -0.0010 | |||
| HYBI / Neos ETF Trust - Neos Enhanced Income Credit Select ETF | 0.00 | 0.20 | 0.0117 | 0.0117 | |||||
| NU / Nu Holdings Ltd. | 0.01 | -0.02 | 0.20 | 33.56 | 0.0087 | -0.0006 | |||
| AHH / Armada Hoffler Properties, Inc. | 0.02 | 0.14 | 0.0082 | 0.0082 | |||||
| CASY / Casey's General Stores, Inc. | 0.00 | -100.00 | 0.00 | 0.0000 | |||||
| THC / Tenet Healthcare Corporation | 0.00 | -100.00 | 0.00 | 0.0000 | |||||
| YUMC / Yum China Holdings, Inc. | 0.00 | -100.00 | 0.00 | 0.0000 | |||||
| CHRD / Chord Energy Corporation | 0.00 | -100.00 | 0.00 | 0.0000 | |||||
| UNH / UnitedHealth Group Incorporated | 0.00 | -100.00 | 0.00 | 0.0000 | |||||
| DEO / Diageo plc - Depositary Receipt (Common Stock) | 0.00 | -100.00 | 0.00 | 0.0000 | |||||
| ICHR / Ichor Holdings, Ltd. | 0.00 | -100.00 | 0.00 | 0.0000 | |||||
| EQC / Equity Commonwealth | 0.00 | -100.00 | 0.00 | 0.0000 | |||||
| SPY / SPDR S&P 500 ETF | 0.00 | -100.00 | 0.00 | 0.0000 | |||||
| ETR / Entergy Corporation | 0.00 | -100.00 | 0.00 | 0.0000 | |||||
| MQT / BlackRock MuniYield Quality Fund II, Inc. | 0.00 | -100.00 | 0.00 | 0.0000 | |||||
| MTW / The Manitowoc Company, Inc. | 0.00 | -100.00 | 0.00 | 0.0000 | |||||
| DD / DuPont de Nemours, Inc. | 0.00 | -100.00 | 0.00 | 0.0000 | |||||
| VYM / Vanguard Whitehall Funds - Vanguard High Dividend Yield ETF | 0.00 | -100.00 | 0.00 | 0.0000 | |||||
| AESI / Atlas Energy Solutions Inc. | 0.00 | -100.00 | 0.00 | 0.0000 | |||||
| NVO / Novo Nordisk A/S - Depositary Receipt (Common Stock) | 0.00 | -100.00 | 0.00 | -100.00 | -0.0127 | ||||
| PLAB / Photronics, Inc. | 0.00 | -100.00 | 0.00 | 0.0000 | |||||
| IQI / Invesco Quality Municipal Income Trust | 0.00 | -100.00 | 0.00 | 0.0000 | |||||
| BERY / Berry Global Group, Inc. | 0.00 | -100.00 | 0.00 | 0.0000 |