Basic Stats
| Portfolio Value | $ 245,480,702 |
| Current Positions | 111 |
Latest Holdings, Performance, AUM (from 13F, 13D)
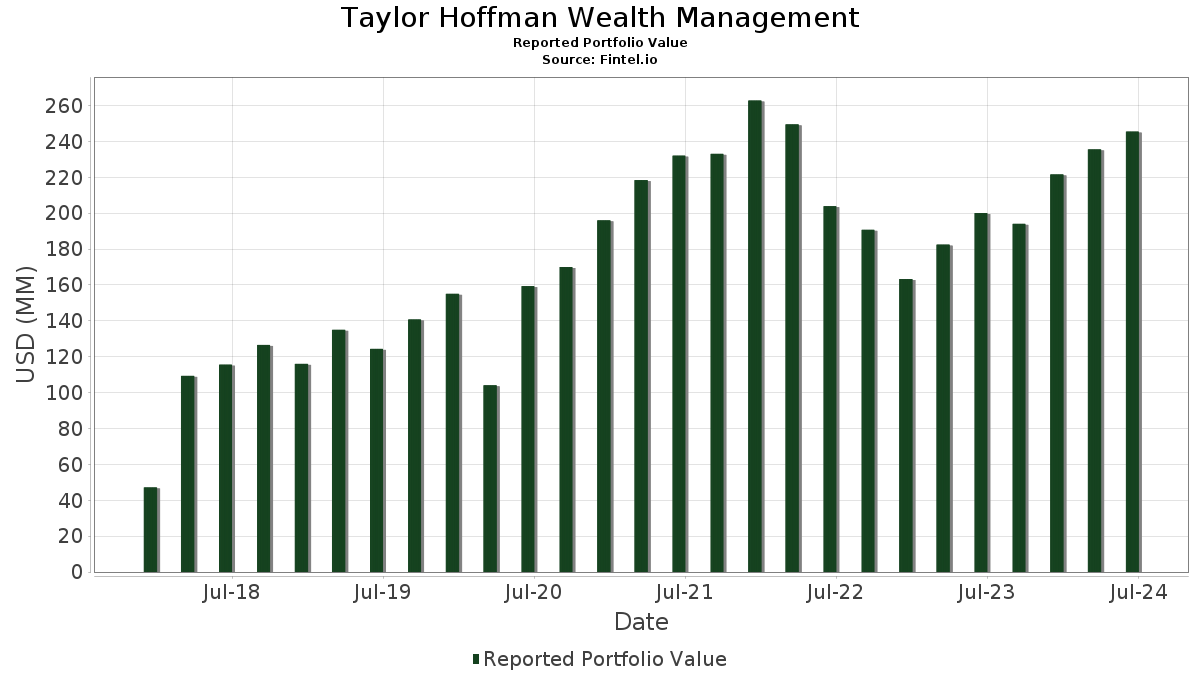
Taylor Hoffman Wealth Management has disclosed 111 total holdings in their latest SEC filings. Most recent portfolio value is calculated to be $ 245,480,702 USD. Actual Assets Under Management (AUM) is this value plus cash (which is not disclosed). Taylor Hoffman Wealth Management’s top holdings are Apple Inc. (US:AAPL) , Arista Networks Inc (US:ANET) , Applied Materials, Inc. (US:AMAT) , Meta Platforms, Inc. (US:META) , and Lam Research Corporation (US:LRCX) . Taylor Hoffman Wealth Management’s new positions include NVR, Inc. (US:NVR) , .
Top Increases This Quarter
We use the change in the portfolio allocation because this is the most meaningful metric. Changes can be due to trades or changes in share prices.
| Security | Shares (MM) |
Value (MM$) |
Portfolio % | ΔPortfolio % |
|---|---|---|---|---|
| 0.10 | 20.96 | 8.5383 | 1.5196 | |
| 0.02 | 2.85 | 1.1614 | 1.1614 | |
| 0.04 | 12.76 | 5.1988 | 0.7378 | |
| 0.04 | 7.05 | 2.8732 | 0.4639 | |
| 0.01 | 8.36 | 3.4054 | 0.4478 | |
| 0.04 | 10.61 | 4.3201 | 0.4088 | |
| 0.01 | 6.43 | 2.6175 | 0.2035 | |
| 0.01 | 9.30 | 3.7888 | 0.1690 | |
| 0.00 | 2.83 | 1.1533 | 0.1390 | |
| 0.00 | 0.33 | 0.1341 | 0.1341 |
Top Decreases This Quarter
We use the change in the portfolio allocation because this is the most meaningful metric. Changes can be due to trades or changes in share prices.
| Security | Shares (MM) |
Value (MM$) |
Portfolio % | ΔPortfolio % |
|---|---|---|---|---|
| 0.00 | 0.00 | -1.6792 | ||
| 0.02 | 5.90 | 2.4054 | -0.3933 | |
| 0.02 | 5.10 | 2.0759 | -0.3145 | |
| 0.04 | 3.30 | 1.3449 | -0.3062 | |
| 0.02 | 3.55 | 1.4469 | -0.2405 | |
| 0.06 | 4.35 | 1.7739 | -0.2271 | |
| 0.06 | 4.05 | 1.6506 | -0.2196 | |
| 0.05 | 2.49 | 1.0145 | -0.2014 | |
| 0.02 | 4.01 | 1.6354 | -0.1990 | |
| 0.06 | 4.23 | 1.7226 | -0.1895 |
13F and Fund Filings
This form was filed on 2024-08-09 for the reporting period 2024-06-30. Click the link icon to see the full transaction history.
Upgrade to unlock premium data and export to Excel ![]() .
.
| Security | Type | Avg Share Price | Shares (MM) |
ΔShares (%) |
ΔShares (%) |
Value ($MM) |
Portfolio (%) |
ΔPortfolio (%) |
|
|---|---|---|---|---|---|---|---|---|---|
| AAPL / Apple Inc. | 0.10 | 0.30 | 20.96 | 26.77 | 8.5383 | 1.5196 | |||
| ANET / Arista Networks Inc | 0.04 | -1.27 | 12.76 | 21.45 | 5.1988 | 0.7378 | |||
| AMAT / Applied Materials, Inc. | 0.04 | -0.01 | 10.61 | 15.11 | 4.3201 | 0.4088 | |||
| META / Meta Platforms, Inc. | 0.02 | 0.64 | 10.46 | 4.60 | 4.2604 | 0.0157 | |||
| LRCX / Lam Research Corporation | 0.01 | -0.08 | 9.30 | 9.08 | 3.7888 | 0.1690 | |||
| FICO / Fair Isaac Corporation | 0.01 | 0.20 | 8.36 | 20.00 | 3.4054 | 0.4478 | |||
| GOOGL / Alphabet Inc. | 0.04 | 2.51 | 7.05 | 24.28 | 2.8732 | 0.4639 | |||
| ADBE / Adobe Inc. | 0.01 | 1.82 | 6.43 | 13.00 | 2.6175 | 0.2035 | |||
| DE / Deere & Company | 0.02 | 1.91 | 5.90 | -10.44 | 2.4054 | -0.3933 | |||
| VEA / Vanguard Tax-Managed Funds - Vanguard FTSE Developed Markets ETF | 0.11 | 0.85 | 5.35 | -0.58 | 2.1804 | -0.1051 | |||
| SNA / Snap-on Incorporated | 0.02 | 4.36 | 5.10 | -9.50 | 2.0759 | -0.3145 | |||
| GJR / Strats Trust For Procter & Gambel Security - Preferred Security | 0.03 | 1.47 | 5.04 | 1.78 | 2.0544 | -0.0495 | |||
| EBAY / eBay Inc. | 0.10 | 2.39 | 5.03 | 2.20 | 2.0476 | -0.0404 | |||
| MSFT / Microsoft Corporation | 0.01 | 2.00 | 5.02 | 10.73 | 2.0436 | 0.1202 | |||
| CSCO / Cisco Systems, Inc. | 0.10 | 4.33 | 4.80 | -0.66 | 1.9544 | -0.0960 | |||
| AWI / Armstrong World Industries, Inc. | 0.04 | 6.67 | 4.76 | -4.30 | 1.9399 | -0.1728 | |||
| GNTX / Gentex Corporation | 0.13 | 5.60 | 4.51 | -1.74 | 1.8365 | -0.1113 | |||
| PAYX / Paychex, Inc. | 0.04 | 2.28 | 4.48 | -2.54 | 1.8267 | -0.1269 | |||
| BND / Vanguard Bond Index Funds - Vanguard Total Bond Market ETF | 0.06 | -6.09 | 4.35 | -7.62 | 1.7739 | -0.2271 | |||
| CNS / Cohen & Steers, Inc. | 0.06 | 1.84 | 4.23 | -6.13 | 1.7226 | -0.1895 | |||
| TROW / T. Rowe Price Group, Inc. | 0.04 | 2.50 | 4.18 | -4.29 | 1.7009 | -0.1509 | |||
| SPGI / S&P Global Inc. | 0.01 | 1.78 | 4.17 | 6.75 | 1.7003 | 0.0408 | |||
| MCO / Moody's Corporation | 0.01 | 1.70 | 4.11 | 9.07 | 1.6760 | 0.0745 | |||
| SEIC / SEI Investments Company | 0.06 | 2.43 | 4.05 | -8.04 | 1.6506 | -0.2196 | |||
| UNP / Union Pacific Corporation | 0.02 | 1.62 | 4.01 | -7.08 | 1.6354 | -0.1990 | |||
| CHD / Church & Dwight Co., Inc. | 0.04 | 1.01 | 3.81 | 1.55 | 1.5507 | -0.0407 | |||
| JNJ / Johnson & Johnson | 0.02 | 3.65 | 3.64 | -4.03 | 1.4824 | -0.1276 | |||
| QLYS / Qualys, Inc. | 0.02 | 4.80 | 3.55 | -10.64 | 1.4469 | -0.2405 | |||
| ALSN / Allison Transmission Holdings, Inc. | 0.05 | 4.28 | 3.49 | -3.68 | 1.4201 | -0.1165 | |||
| EA / Electronic Arts Inc. | 0.02 | 2.89 | 3.39 | 6.50 | 1.3824 | 0.0297 | |||
| GGG / Graco Inc. | 0.04 | 1.95 | 3.30 | -15.12 | 1.3449 | -0.3062 | |||
| VRSN / VeriSign, Inc. | 0.02 | 2.85 | 1.1614 | 1.1614 | |||||
| FTXP / Foothills Exploration, Inc. | 0.00 | 0.00 | 2.83 | 18.50 | 1.1533 | 0.1390 | |||
| MNST / Monster Beverage Corporation | 0.05 | 3.30 | 2.49 | -13.06 | 1.0145 | -0.2014 | |||
| VOO / Vanguard Index Funds - Vanguard S&P 500 ETF | 0.00 | 7.45 | 2.40 | 12.05 | 0.9773 | 0.0684 | |||
| BKFOF / Brookfield Corporation - Preferred Stock | 0.05 | 0.65 | 1.93 | -1.64 | 0.7845 | -0.0464 | |||
| VUG / Vanguard Index Funds - Vanguard Growth ETF | 0.01 | -2.08 | 1.92 | 7.16 | 0.7805 | 0.0215 | |||
| CBOE / Cboe Global Markets, Inc. | 0.01 | 0.00 | 1.47 | -6.45 | 0.5974 | -0.0679 | |||
| NVDD / Direxion Shares ETF Trust - Direxion Daily NVDA Bear 1X Shares | 0.01 | 846.37 | 1.43 | 30.14 | 0.5808 | 0.1159 | |||
| PEP / PepsiCo, Inc. | 0.01 | 0.54 | 1.38 | -6.39 | 0.5610 | -0.0638 | |||
| NOW / ServiceNow, Inc. | 0.00 | -0.77 | 1.32 | 2.73 | 0.5358 | -0.0080 | |||
| VTV / Vanguard Index Funds - Vanguard Value ETF | 0.01 | -0.39 | 1.31 | -2.31 | 0.5347 | -0.0356 | |||
| GOOGL / Alphabet Inc. | 0.01 | 0.00 | 1.28 | 21.21 | 0.5216 | 0.0730 | |||
| PM / Philip Morris International Inc. | 0.01 | 0.00 | 1.20 | 10.55 | 0.4869 | 0.0277 | |||
| DUK / Duke Energy Corporation | 0.01 | 0.00 | 1.19 | 2.77 | 0.4836 | -0.0070 | |||
| VTEB / Vanguard Municipal Bond Funds - Vanguard Tax-Exempt Bond ETF | 0.02 | 0.00 | 1.17 | -1.27 | 0.4751 | -0.0267 | |||
| ZTS / Zoetis Inc. | 0.01 | 0.00 | 1.11 | 2.03 | 0.4511 | -0.0098 | |||
| UNH / UnitedHealth Group Incorporated | 0.00 | 4.76 | 1.09 | 4.82 | 0.4433 | 0.0023 | |||
| MCD / McDonald's Corporation | 0.00 | 0.00 | 1.07 | -11.32 | 0.4373 | -0.0767 | |||
| CSX / CSX Corporation | 0.03 | -0.18 | 1.06 | -9.54 | 0.4328 | -0.0659 | |||
| XOM / Exxon Mobil Corporation | 0.01 | 3.37 | 1.06 | 2.22 | 0.4315 | -0.0084 | |||
| NSC / Norfolk Southern Corporation | 0.00 | 2.80 | 1.05 | -13.68 | 0.4295 | -0.0889 | |||
| JPM / JPMorgan Chase & Co. | 0.00 | 5.78 | 1.01 | 8.51 | 0.4103 | 0.0162 | |||
| UPS / United Parcel Service, Inc. | 0.01 | 0.00 | 1.01 | -8.55 | 0.4100 | -0.0571 | |||
| MDLZ / Mondelez International, Inc. | 0.01 | 1.03 | 0.96 | -5.88 | 0.3917 | -0.0418 | |||
| BRK.A / Berkshire Hathaway Inc. | 0.00 | 18.11 | 0.89 | 13.81 | 0.3628 | 0.0306 | |||
| MO / Altria Group, Inc. | 0.02 | 0.00 | 0.89 | 5.60 | 0.3615 | 0.0045 | |||
| D / Dominion Energy, Inc. | 0.02 | 0.00 | 0.81 | -2.42 | 0.3293 | -0.0223 | |||
| ELV / Elevance Health, Inc. | 0.00 | 0.00 | 0.78 | 3.05 | 0.3173 | -0.0035 | |||
| KEYS / Keysight Technologies, Inc. | 0.01 | -0.12 | 0.77 | -13.90 | 0.3156 | -0.0661 | |||
| MRK / Merck & Co., Inc. | 0.01 | 2.23 | 0.74 | -0.94 | 0.3010 | -0.0156 | |||
| ITW / Illinois Tool Works Inc. | 0.00 | -2.17 | 0.71 | -14.94 | 0.2878 | -0.0646 | |||
| LLY / Eli Lilly and Company | 0.00 | 15.90 | 0.67 | 36.20 | 0.2715 | 0.0638 | |||
| KO / The Coca-Cola Company | 0.01 | 0.00 | 0.63 | 3.45 | 0.2565 | -0.0019 | |||
| IVOO / Vanguard Admiral Funds - Vanguard S&P Mid-Cap 400 ETF | 0.01 | 0.07 | 0.59 | -4.84 | 0.2408 | -0.0226 | |||
| GIS / General Mills, Inc. | 0.01 | 0.00 | 0.59 | -9.54 | 0.2398 | -0.0364 | |||
| CAT / Caterpillar Inc. | 0.00 | -0.35 | 0.56 | -10.49 | 0.2294 | -0.0377 | |||
| MU / Micron Technology, Inc. | 0.00 | 10.51 | 0.55 | 23.44 | 0.2254 | 0.0349 | |||
| NKSH / National Bankshares, Inc. | 0.02 | 0.00 | 0.53 | -12.71 | 0.2155 | -0.0419 | |||
| VTI / Vanguard Index Funds - Vanguard Total Stock Market ETF | 0.00 | 0.00 | 0.51 | 3.26 | 0.2067 | -0.0022 | |||
| MKL / Markel Group Inc. | 0.00 | 0.00 | 0.50 | 3.70 | 0.2054 | -0.0013 | |||
| SYY / Sysco Corporation | 0.01 | 0.00 | 0.50 | -13.91 | 0.2019 | -0.0425 | |||
| CHH / Choice Hotels International, Inc. | 0.00 | 0.00 | 0.47 | -5.80 | 0.1919 | -0.0206 | |||
| FAST / Fastenal Company | 0.01 | 0.00 | 0.46 | -19.48 | 0.1887 | -0.0556 | |||
| EFA / iShares Trust - iShares MSCI EAFE ETF | 0.01 | 0.00 | 0.46 | -1.71 | 0.1879 | -0.0114 | |||
| BAM / Brookfield Asset Management Ltd. | 0.01 | 0.03 | 0.45 | -10.76 | 0.1829 | -0.0306 | |||
| EMR / Emerson Electric Co. | 0.00 | 0.00 | 0.44 | -4.77 | 0.1791 | -0.0168 | |||
| AMGN / Amgen Inc. | 0.00 | 0.00 | 0.43 | 9.23 | 0.1738 | 0.0082 | |||
| CVX / Chevron Corporation | 0.00 | 11.24 | 0.41 | 10.43 | 0.1685 | 0.0094 | |||
| BKNG / Booking Holdings Inc. | 0.00 | 10.64 | 0.40 | 18.48 | 0.1646 | 0.0198 | |||
| TFC / Truist Financial Corporation | 0.01 | 0.00 | 0.40 | 0.50 | 0.1629 | -0.0057 | |||
| LIN / Linde plc | 0.00 | 0.00 | 0.40 | -7.66 | 0.1623 | -0.0208 | |||
| DOV / Dover Corporation | 0.00 | 0.00 | 0.40 | 0.00 | 0.1609 | -0.0070 | |||
| UVV / Universal Corporation | 0.01 | 0.00 | 0.39 | -8.02 | 0.1592 | -0.0209 | |||
| NEE.PRN / NextEra Energy Capital Holdings, Inc. - Corporate Bond/Note | 0.01 | -1.54 | 0.39 | 7.76 | 0.1586 | 0.0051 | |||
| GE / General Electric Company | 0.00 | 0.00 | 0.34 | -9.57 | 0.1388 | -0.0209 | |||
| ADI / Analog Devices, Inc. | 0.00 | 0.00 | 0.34 | 13.71 | 0.1387 | 0.0117 | |||
| VIOO / Vanguard Admiral Funds - Vanguard S&P Small-Cap 600 ETF | 0.00 | 0.23 | 0.34 | -3.68 | 0.1385 | -0.0116 | |||
| NVO / Novo Nordisk A/S - Depositary Receipt (Common Stock) | 0.00 | 4.27 | 0.34 | 18.25 | 0.1374 | 0.0162 | |||
| KMX / CarMax, Inc. | 0.00 | -2.97 | 0.33 | -20.85 | 0.1364 | -0.0428 | |||
| WSO / Watsco, Inc. | 0.00 | 0.00 | 0.33 | 7.05 | 0.1362 | 0.0035 | |||
| NVR / NVR, Inc. | 0.00 | 0.33 | 0.1341 | 0.1341 | |||||
| AMZN / Amazon.com, Inc. | 0.00 | 37.49 | 0.33 | 50.46 | 0.1338 | 0.0410 | |||
| AEP / American Electric Power Company, Inc. | 0.00 | 0.00 | 0.33 | 1.24 | 0.1332 | -0.0037 | |||
| ORLY / O'Reilly Automotive, Inc. | 0.00 | 0.00 | 0.31 | -10.20 | 0.1259 | -0.0198 | |||
| ORCL / Oracle Corporation | 0.00 | 0.00 | 0.31 | 14.23 | 0.1243 | 0.0106 | |||
| SHW / The Sherwin-Williams Company | 0.00 | 22.31 | 0.28 | 4.12 | 0.1136 | -0.0001 | |||
| CHKP / Check Point Software Technologies Ltd. | 0.00 | 5.91 | 0.26 | 6.91 | 0.1071 | 0.0024 | |||
| TXN / Texas Instruments Incorporated | 0.00 | 0.25 | 0.1025 | 0.1025 | |||||
| WMT / Walmart Inc. | 0.00 | 5.75 | 0.25 | 18.57 | 0.1017 | 0.0123 | |||
| BDX / Becton, Dickinson and Company | 0.00 | 7.04 | 0.23 | -0.85 | 0.0952 | -0.0048 | |||
| KMB / Kimberly-Clark Corporation | 0.00 | 0.00 | 0.23 | 6.45 | 0.0944 | 0.0021 | |||
| VZ / Verizon Communications Inc. | 0.01 | 0.00 | 0.22 | -0.45 | 0.0910 | -0.0043 | |||
| V / Visa Inc. | 0.00 | 10.74 | 0.22 | 4.83 | 0.0885 | 0.0002 | |||
| TFI / SPDR Series Trust - SPDR Nuveen ICE Municipal Bond ETF | 0.00 | 0.00 | 0.21 | -1.85 | 0.0865 | -0.0054 | |||
| SBUX / Starbucks Corporation | 0.00 | 0.00 | 0.21 | -15.66 | 0.0857 | -0.0201 | |||
| SO / The Southern Company | 0.00 | 0.21 | 0.0845 | 0.0845 | |||||
| VEEV / Veeva Systems Inc. | 0.00 | 0.00 | 0.21 | -21.59 | 0.0844 | -0.0278 | |||
| HRB / H&R Block, Inc. | 0.00 | 0.21 | 0.0841 | 0.0841 | |||||
| HSY / The Hershey Company | 0.00 | 0.00 | 0.20 | -6.48 | 0.0826 | -0.0092 | |||
| NBB / Nuveen Taxable Municipal Income Fund | 0.01 | 0.00 | 0.17 | 0.58 | 0.0708 | -0.0026 | |||
| INTC / Intel Corporation | 0.00 | -100.00 | 0.00 | -100.00 | -1.6792 | ||||
| SWKS / Skyworks Solutions, Inc. | 0.00 | -100.00 | 0.00 | 0.0000 |