Basic Stats
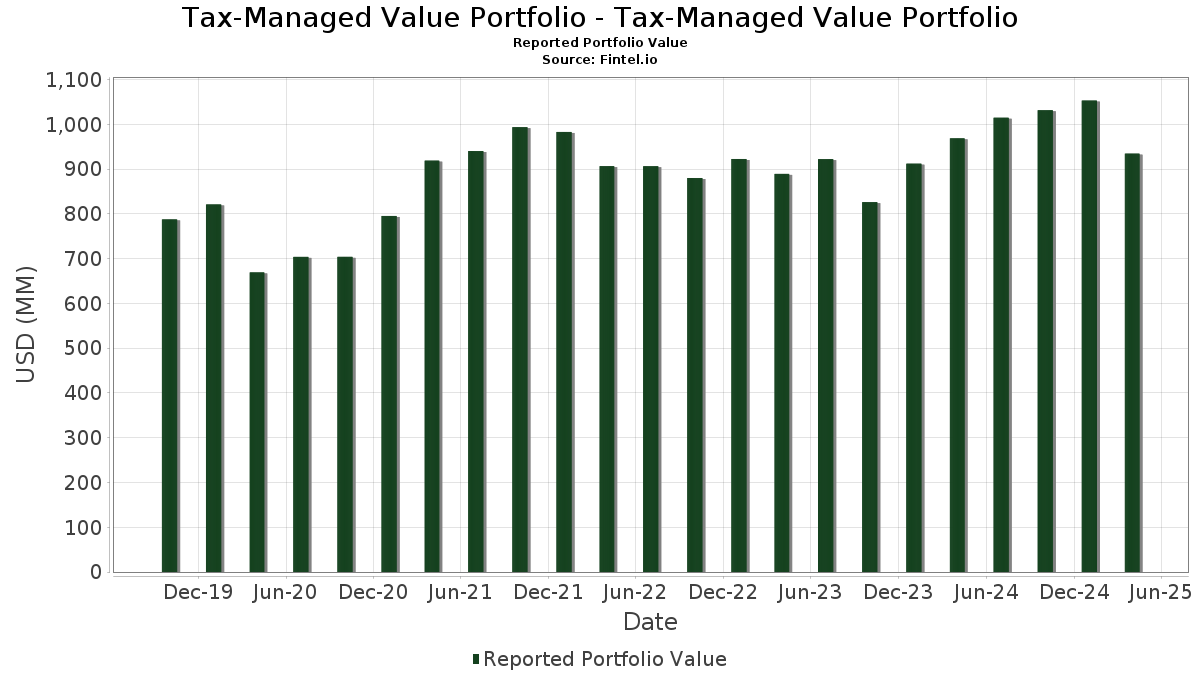
| Portfolio Value | $ 934,684,409 |
| Current Positions | 71 |
Latest Holdings, Performance, AUM (from 13F, 13D)
Tax-Managed Value Portfolio - Tax-Managed Value Portfolio has disclosed 71 total holdings in their latest SEC filings. Most recent portfolio value is calculated to be $ 934,684,409 USD. Actual Assets Under Management (AUM) is this value plus cash (which is not disclosed). Tax-Managed Value Portfolio - Tax-Managed Value Portfolio’s top holdings are JPMorgan Chase & Co. (US:JPM) , The Charles Schwab Corporation (US:SCHW) , The Home Depot, Inc. (US:HD) , Chevron Corporation (US:CVX) , and Sempra (US:SRE) . Tax-Managed Value Portfolio - Tax-Managed Value Portfolio’s new positions include Abbott Laboratories (US:ABT) , Meritage Homes Corporation (US:MTH) , NICE Ltd. - Depositary Receipt (Common Stock) (US:NICE) , Baker Hughes Company (US:BKR) , and Chewy, Inc. (US:CHWY) .
Top Increases This Quarter
We use the change in the portfolio allocation because this is the most meaningful metric. Changes can be due to trades or changes in share prices.
| Security | Shares (MM) |
Value (MM$) |
Portfolio % | ΔPortfolio % |
|---|---|---|---|---|
| 0.32 | 16.63 | 1.7778 | 1.4129 | |
| 0.09 | 11.88 | 1.2703 | 1.2703 | |
| 0.10 | 9.87 | 1.0556 | 1.0556 | |
| 0.13 | 9.03 | 0.9655 | 0.9655 | |
| 0.24 | 11.63 | 1.2432 | 0.8613 | |
| 0.05 | 7.83 | 0.8371 | 0.8371 | |
| 0.21 | 7.55 | 0.8069 | 0.8069 | |
| 0.20 | 7.32 | 0.7828 | 0.7828 | |
| 0.11 | 14.65 | 1.5665 | 0.7663 | |
| 0.28 | 20.17 | 2.1568 | 0.7445 |
Top Decreases This Quarter
We use the change in the portfolio allocation because this is the most meaningful metric. Changes can be due to trades or changes in share prices.
| Security | Shares (MM) |
Value (MM$) |
Portfolio % | ΔPortfolio % |
|---|---|---|---|---|
| 0.09 | 14.76 | 1.5781 | -0.7383 | |
| 0.04 | 17.55 | 1.8765 | -0.7312 | |
| 0.00 | 0.00 | -0.7110 | ||
| 0.14 | 33.72 | 3.6059 | -0.7070 | |
| 0.03 | 11.69 | 1.2497 | -0.5992 | |
| 0.04 | 8.21 | 0.8778 | -0.5607 | |
| 2.22 | 2.22 | 0.2372 | -0.4927 | |
| 0.09 | 5.35 | 0.5717 | -0.4545 | |
| 0.12 | 10.58 | 1.1313 | -0.4353 | |
| 0.21 | 4.23 | 0.4519 | -0.3824 |
13F and Fund Filings
This form was filed on 2025-06-23 for the reporting period 2025-04-30. Click the link icon to see the full transaction history.
Upgrade to unlock premium data and export to Excel ![]() .
.
| Security | Type | Avg Share Price | Shares (MM) |
ΔShares (%) |
ΔShares (%) |
Value ($MM) |
Portfolio (%) |
ΔPortfolio (%) |
|
|---|---|---|---|---|---|---|---|---|---|
| JPM / JPMorgan Chase & Co. | 0.14 | -18.91 | 33.72 | -25.79 | 3.6059 | -0.7070 | |||
| SCHW / The Charles Schwab Corporation | 0.37 | 0.00 | 30.28 | -1.60 | 3.2376 | 0.3174 | |||
| HD / The Home Depot, Inc. | 0.08 | 0.00 | 29.22 | -12.50 | 3.1245 | -0.0449 | |||
| CVX / Chevron Corporation | 0.18 | 0.00 | 24.80 | -8.80 | 2.6523 | 0.0710 | |||
| SRE / Sempra | 0.33 | 0.00 | 24.14 | -10.44 | 2.5816 | 0.0230 | |||
| PNC / The PNC Financial Services Group, Inc. | 0.14 | 0.00 | 22.82 | -20.04 | 2.4403 | -0.2683 | |||
| GOOGL / Alphabet Inc. | 0.14 | 0.00 | 22.53 | -22.17 | 2.4086 | -0.3380 | |||
| SYK / Stryker Corporation | 0.06 | 0.00 | 21.72 | -4.44 | 2.3227 | 0.1653 | |||
| IR / Ingersoll Rand Inc. | 0.29 | 0.00 | 21.69 | -19.59 | 2.3193 | -0.2406 | |||
| MU / Micron Technology, Inc. | 0.28 | 0.00 | 21.52 | -15.66 | 2.3006 | -0.1206 | |||
| MMM / 3M Company | 0.15 | 0.00 | 21.36 | -8.73 | 2.2834 | 0.0628 | |||
| NEE / NextEra Energy, Inc. | 0.31 | 5.66 | 21.04 | -1.25 | 2.2499 | 0.2276 | |||
| WAB / Westinghouse Air Brake Technologies Corporation | 0.11 | 0.00 | 20.28 | -11.15 | 2.1685 | 0.0023 | |||
| WFC / Wells Fargo & Company | 0.28 | 50.42 | 20.17 | 35.54 | 2.1568 | 0.7445 | |||
| PH / Parker-Hannifin Corporation | 0.03 | 0.00 | 19.91 | -14.43 | 2.1294 | -0.0792 | |||
| TMO / Thermo Fisher Scientific Inc. | 0.04 | -11.01 | 17.55 | -36.13 | 1.8765 | -0.7312 | |||
| LIN / Linde plc | 0.04 | -4.86 | 17.50 | -3.34 | 1.8711 | 0.1529 | |||
| TRV / The Travelers Companies, Inc. | 0.06 | 0.00 | 16.91 | 7.73 | 1.8084 | 0.3184 | |||
| FI / Fiserv, Inc. | 0.09 | 0.00 | 16.83 | -14.57 | 1.8001 | -0.0701 | |||
| ACGL / Arch Capital Group Ltd. | 0.18 | 0.00 | 16.68 | -2.57 | 1.7839 | 0.1588 | |||
| BLL / Ball Corp. | 0.32 | 363.70 | 16.63 | 332.41 | 1.7778 | 1.4129 | |||
| ZTS / Zoetis Inc. | 0.10 | 0.00 | 15.84 | -8.49 | 1.6940 | 0.0510 | |||
| V / Visa Inc. | 0.04 | 0.00 | 15.44 | 1.08 | 1.6512 | 0.2013 | |||
| MAA / Mid-America Apartment Communities, Inc. | 0.09 | -42.21 | 14.76 | -39.53 | 1.5781 | -0.7383 | |||
| IBKR / Interactive Brokers Group, Inc. | 0.09 | 0.00 | 14.66 | -20.96 | 1.5677 | -0.1929 | |||
| STLD / Steel Dynamics, Inc. | 0.11 | -48.66 | 14.65 | 122.90 | 1.5665 | 0.7663 | |||
| RTX / RTX Corporation | 0.11 | 0.00 | 14.25 | -2.19 | 1.5240 | 0.1411 | |||
| DIS / The Walt Disney Company | 0.15 | 0.00 | 13.45 | -19.56 | 1.4384 | -0.1487 | |||
| BJ / BJ's Wholesale Club Holdings, Inc. | 0.11 | -37.88 | 13.44 | -26.27 | 1.4366 | -0.2930 | |||
| LLY / Eli Lilly and Company | 0.01 | -5.14 | 12.69 | 5.14 | 1.3569 | 0.2114 | |||
| CLX / The Clorox Company | 0.09 | -17.55 | 12.66 | -26.06 | 1.3534 | -0.2712 | |||
| ABBV / AbbVie Inc. | 0.06 | -31.92 | 12.66 | -27.77 | 1.3532 | -0.3098 | |||
| DHI / D.R. Horton, Inc. | 0.10 | 0.00 | 12.55 | -10.97 | 1.3423 | 0.0042 | |||
| GS / The Goldman Sachs Group, Inc. | 0.02 | 0.00 | 12.53 | -14.50 | 1.3403 | -0.0511 | |||
| HON / Honeywell International Inc. | 0.06 | 0.00 | 12.53 | -5.91 | 1.3397 | 0.0759 | |||
| ABT / Abbott Laboratories | 0.09 | 11.88 | 1.2703 | 1.2703 | |||||
| GIS / General Mills, Inc. | 0.21 | 163.85 | 11.73 | 120.12 | 1.2541 | 0.7377 | |||
| UNH / UnitedHealth Group Incorporated | 0.03 | -20.90 | 11.69 | -40.01 | 1.2497 | -0.5992 | |||
| EQT / EQT Corporation | 0.24 | 198.72 | 11.63 | 188.94 | 1.2432 | 0.8613 | |||
| CSCO / Cisco Systems, Inc. | 0.19 | 0.00 | 11.06 | -4.74 | 1.1823 | 0.0807 | |||
| UNP / Union Pacific Corporation | 0.05 | 0.00 | 10.97 | -12.97 | 1.1732 | -0.0233 | |||
| MRK / Merck & Co., Inc. | 0.12 | -25.66 | 10.58 | -35.91 | 1.1313 | -0.4353 | |||
| HSY / The Hershey Company | 0.06 | 7.05 | 10.56 | -22.62 | 1.1290 | -0.3502 | |||
| GILD / Gilead Sciences, Inc. | 0.10 | -19.82 | 10.35 | -12.11 | 1.1071 | -0.0110 | |||
| QCOM / QUALCOMM Incorporated | 0.07 | 0.00 | 10.35 | -14.14 | 1.1066 | -0.0375 | |||
| AVB / AvalonBay Communities, Inc. | 0.05 | 0.00 | 10.06 | -5.20 | 1.0758 | 0.0685 | |||
| BSX / Boston Scientific Corporation | 0.10 | 9.87 | 1.0556 | 1.0556 | |||||
| NSRGY / Nestlé S.A. - Depositary Receipt (Common Stock) | 0.09 | 0.00 | 9.58 | 25.31 | 1.0243 | 0.2988 | |||
| NBIX / Neurocrine Biosciences, Inc. | 0.09 | 9.46 | 9.24 | -22.36 | 0.9884 | -0.1415 | |||
| MTH / Meritage Homes Corporation | 0.13 | 9.03 | 0.9655 | 0.9655 | |||||
| ROK / Rockwell Automation, Inc. | 0.03 | 0.00 | 8.40 | -11.05 | 0.8982 | 0.0020 | |||
| STZ / Constellation Brands, Inc. | 0.04 | -31.49 | 8.21 | -44.70 | 0.8778 | -0.5607 | |||
| CMS / CMS Energy Corporation | 0.11 | 0.00 | 8.20 | 11.59 | 0.8771 | 0.1795 | |||
| NICE / NICE Ltd. - Depositary Receipt (Common Stock) | 0.05 | 7.83 | 0.8371 | 0.8371 | |||||
| BKR / Baker Hughes Company | 0.21 | 7.55 | 0.8069 | 0.8069 | |||||
| ORCL / Oracle Corporation | 0.05 | 0.00 | 7.44 | -17.26 | 0.7957 | -0.0578 | |||
| CHWY / Chewy, Inc. | 0.20 | 7.32 | 0.7828 | 0.7828 | |||||
| INVH / Invitation Homes Inc. | 0.21 | -27.09 | 7.30 | -19.98 | 0.7805 | -0.0852 | |||
| CARR / Carrier Global Corporation | 0.11 | 0.00 | 7.07 | -4.33 | 0.7557 | 0.0545 | |||
| CSX / CSX Corporation | 0.24 | 6.76 | 0.7231 | 0.7231 | |||||
| RGA / Reinsurance Group of America, Incorporated | 0.03 | 0.00 | 6.29 | -17.79 | 0.6729 | -0.0536 | |||
| EOG / EOG Resources, Inc. | 0.05 | 0.00 | 5.67 | -12.30 | 0.6067 | -0.0073 | |||
| OTIS / Otis Worldwide Corporation | 0.06 | 0.00 | 5.44 | 0.89 | 0.5816 | 0.0699 | |||
| HAS / Hasbro, Inc. | 0.09 | -53.79 | 5.35 | -50.55 | 0.5717 | -0.4545 | |||
| PSX / Phillips 66 | 0.05 | 0.00 | 5.12 | -11.73 | 0.5473 | -0.0029 | |||
| CBOE / Cboe Global Markets, Inc. | 0.02 | 0.00 | 5.00 | 8.57 | 0.5351 | 0.0976 | |||
| POOL / Pool Corporation | 0.02 | 4.44 | 0.4747 | 0.4747 | |||||
| INTC / Intel Corporation | 0.21 | -18.63 | 4.23 | -42.48 | 0.4519 | -0.3824 | |||
| MCK / McKesson Corporation | 0.01 | 0.00 | 3.76 | 19.87 | 0.4025 | 0.1044 | |||
| TTC / The Toro Company | 0.04 | 0.00 | 3.07 | -17.99 | 0.3281 | -0.0270 | |||
| US61747C7074 / Morgan Stanley Institutional Liquidity Funds Government Portfolio, Institutional Class | 2.22 | -71.15 | 2.22 | -71.16 | 0.2372 | -0.4927 | |||
| UPS / United Parcel Service, Inc. | 0.00 | -100.00 | 0.00 | -100.00 | -0.7110 |