Basic Stats
| Portfolio Value | $ 932,576,921 |
| Current Positions | 23 |
Latest Holdings, Performance, AUM (from 13F, 13D)
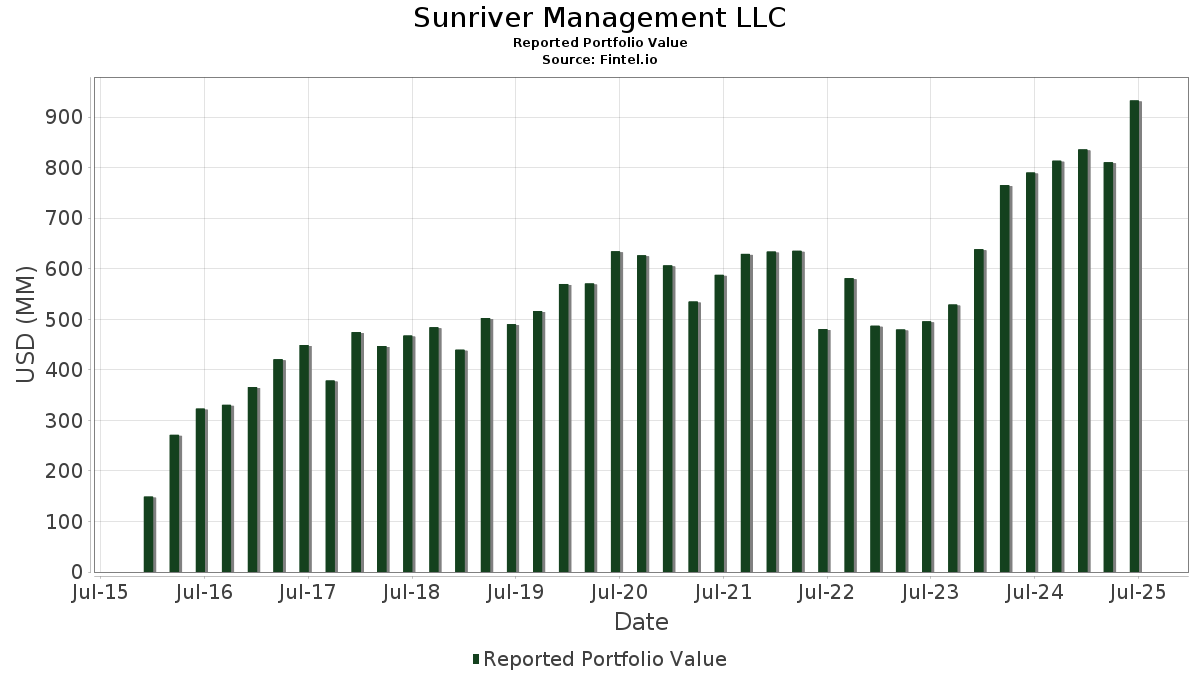
Sunriver Management LLC has disclosed 23 total holdings in their latest SEC filings. Most recent portfolio value is calculated to be $ 932,576,921 USD. Actual Assets Under Management (AUM) is this value plus cash (which is not disclosed). Sunriver Management LLC’s top holdings are Integral Ad Science Holding Corp. (US:IAS) , Performance Food Group Company (US:PFGC) , OPENLANE, Inc. (US:KAR) , Verra Mobility Corporation (US:VRRM) , and Huron Consulting Group Inc. (US:HURN) . Sunriver Management LLC’s new positions include Huntington Ingalls Industries, Inc. (US:HII) , . Sunriver Management LLC’s top industries are "Industrial And Commercial Machinery And Computer Equipment" (sic 35) , "Chemicals And Allied Products" (sic 28) , and "Automotive Dealers And Gasoline Service Stations" (sic 55) .
Top Increases This Quarter
We use the change in the portfolio allocation because this is the most meaningful metric. Changes can be due to trades or changes in share prices.
| Security | Shares (MM) |
Value (MM$) |
Portfolio % | ΔPortfolio % |
|---|---|---|---|---|
| 1.24 | 51.86 | 5.5615 | 5.5615 | |
| 0.27 | 47.23 | 5.0647 | 5.0647 | |
| 0.48 | 40.10 | 4.3003 | 4.3003 | |
| 0.39 | 38.81 | 4.1615 | 4.1615 | |
| 0.13 | 31.53 | 3.3812 | 3.3812 | |
| 2.06 | 49.37 | 5.2940 | 2.5959 | |
| 6.40 | 51.83 | 5.5576 | 1.5498 | |
| 2.27 | 55.42 | 5.9428 | 0.5575 | |
| 2.06 | 52.43 | 5.6215 | 0.2870 |
Top Decreases This Quarter
We use the change in the portfolio allocation because this is the most meaningful metric. Changes can be due to trades or changes in share prices.
| Security | Shares (MM) |
Value (MM$) |
Portfolio % | ΔPortfolio % |
|---|---|---|---|---|
| 1.61 | 26.72 | 2.8652 | -3.0823 | |
| 0.14 | 9.62 | 1.0313 | -2.6223 | |
| 3.72 | 17.92 | 1.9220 | -2.3180 | |
| 0.08 | 24.05 | 2.5787 | -1.8690 | |
| 1.16 | 39.59 | 4.2448 | -1.6461 | |
| 0.69 | 8.69 | 0.9316 | -1.4028 | |
| 0.55 | 44.97 | 4.8220 | -1.1996 | |
| 0.66 | 57.33 | 6.1473 | -0.9140 | |
| 0.34 | 50.08 | 5.3704 | -0.7153 | |
| 0.38 | 52.02 | 5.5780 | -0.4746 |
13D/G Filings
This is a list of 13D and 13G filings made in the last year (if any). Click the link icon to see the full transaction history. Green rows indicate new positions. Red rows indicate closed positions.
| File Date | Form | Security | Prev Shares |
Current Shares |
ΔShares % | % Ownership |
% ΔOwnership | |
|---|---|---|---|---|---|---|---|---|
| 2025-08-13 | IAS / Integral Ad Science Holding Corp. | 8,822,914 | 5.30 | |||||
| 2025-08-13 | RPAY / Repay Holdings Corporation | 5,416,840 | 3,718,652 | -31.35 | 3.90 | -29.09 |
13F and Fund Filings
This form was filed on 2025-08-13 for the reporting period 2025-06-30. Click the link icon to see the full transaction history.
Upgrade to unlock premium data and export to Excel ![]() .
.
| Security | Type | Avg Share Price | Shares (MM) |
ΔShares (%) |
ΔShares (%) |
Value ($MM) |
Portfolio (%) |
ΔPortfolio (%) |
|
|---|---|---|---|---|---|---|---|---|---|
| IAS / Integral Ad Science Holding Corp. | 8.82 | 8.03 | 73.32 | 11.38 | 7.8619 | -0.2611 | |||
| PFGC / Performance Food Group Company | 0.66 | -9.94 | 57.33 | 0.19 | 6.1473 | -0.9140 | |||
| KAR / OPENLANE, Inc. | 2.27 | 0.14 | 55.42 | 27.00 | 5.9428 | 0.5575 | |||
| VRRM / Verra Mobility Corporation | 2.06 | 7.52 | 52.43 | 21.28 | 5.6215 | 0.2870 | |||
| HURN / Huron Consulting Group Inc. | 0.38 | 10.62 | 52.02 | 6.06 | 5.5780 | -0.4746 | |||
| ARMK / Aramark | 1.24 | 51.86 | 5.5615 | 5.5615 | |||||
| NABL / N-able, Inc. | 6.40 | 39.69 | 51.83 | 59.59 | 5.5576 | 1.5498 | |||
| WEX / WEX Inc. | 0.34 | 8.56 | 50.08 | 1.56 | 5.3704 | -0.7153 | |||
| RTO / Rentokil Initial plc - Depositary Receipt (Common Stock) | 2.06 | 115.46 | 49.37 | 125.81 | 5.2940 | 2.5959 | |||
| FI / Fiserv, Inc. | 0.27 | 47.23 | 5.0647 | 5.0647 | |||||
| FIS / Fidelity National Information Services, Inc. | 0.55 | -15.46 | 44.97 | -7.84 | 4.8220 | -1.1996 | |||
| JAMF / Jamf Holding Corp. | 4.52 | 46.85 | 42.98 | 14.94 | 4.6089 | -0.0057 | |||
| AMPL / Amplitude, Inc. | 3.34 | -13.29 | 41.41 | 5.52 | 4.4401 | -0.4024 | |||
| SSNC / SS&C Technologies Holdings, Inc. | 0.48 | 40.10 | 4.3003 | 4.3003 | |||||
| BOX / Box, Inc. | 1.16 | -25.11 | 39.59 | -17.08 | 4.2448 | -1.6461 | |||
| DLTR / Dollar Tree, Inc. | 0.39 | 38.81 | 4.1615 | 4.1615 | |||||
| HII / Huntington Ingalls Industries, Inc. | 0.13 | 31.53 | 3.3812 | 3.3812 | |||||
| FA / First Advantage Corporation | 1.61 | -52.97 | 26.72 | -44.56 | 2.8652 | -3.0823 | |||
| DV / DoubleVerify Holdings, Inc. | 1.69 | 0.48 | 25.30 | 12.51 | 2.7127 | -0.0621 | |||
| WTW / Willis Towers Watson Public Limited Company | 0.08 | -26.43 | 24.05 | -33.28 | 2.5787 | -1.8690 | |||
| RPAY / Repay Holdings Corporation | 3.72 | -39.72 | 17.92 | -47.83 | 1.9220 | -2.3180 | |||
| SWK / Stanley Black & Decker, Inc. | 0.14 | -63.14 | 9.62 | -67.51 | 1.0313 | -2.6223 | |||
| PSFE / Paysafe Limited | 0.69 | -42.90 | 8.69 | -54.07 | 0.9316 | -1.4028 | |||
| ICLR / ICON Public Limited Company | 0.00 | -100.00 | 0.00 | 0.0000 | |||||
| INFA / Informatica Inc. | 0.00 | -100.00 | 0.00 | 0.0000 | |||||
| CRSR / Corsair Gaming, Inc. | 0.00 | -100.00 | 0.00 | 0.0000 | |||||
| SYY / Sysco Corporation | 0.00 | -100.00 | 0.00 | 0.0000 |