Basic Stats
| Portfolio Value | $ 157,060,000 |
| Current Positions | 114 |
Latest Holdings, Performance, AUM (from 13F, 13D)
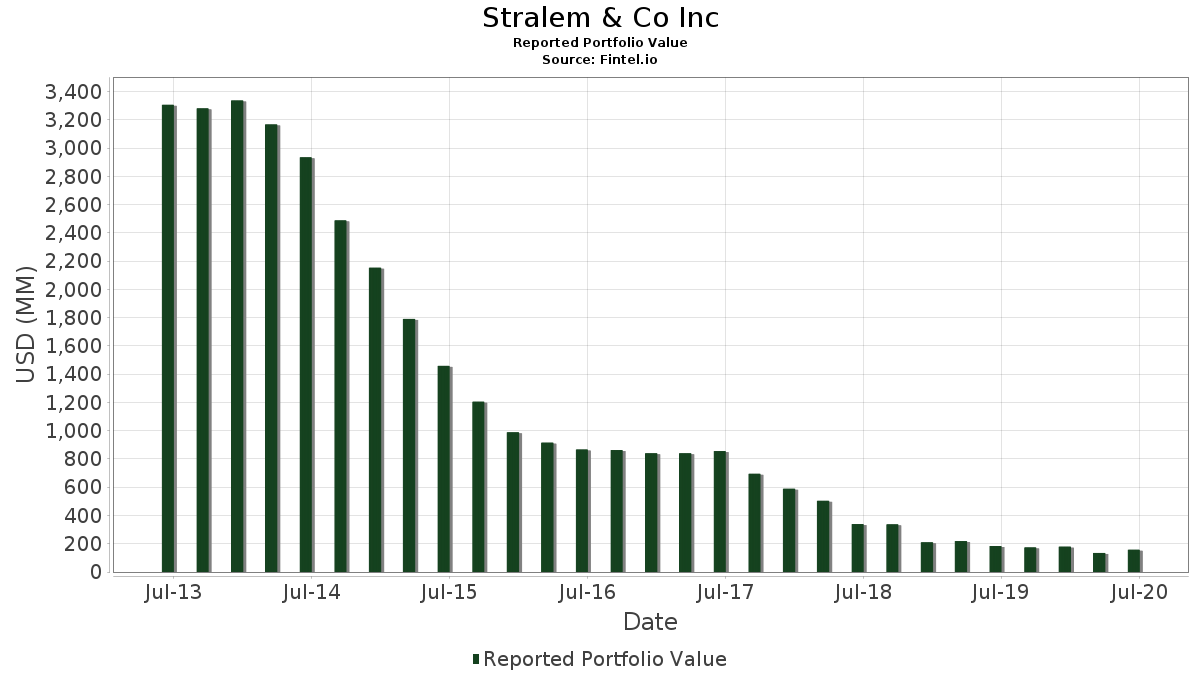
Stralem & Co Inc has disclosed 114 total holdings in their latest SEC filings. Most recent portfolio value is calculated to be $ 157,060,000 USD. Actual Assets Under Management (AUM) is this value plus cash (which is not disclosed). Stralem & Co Inc’s top holdings are Meta Platforms, Inc. (US:META) , Adobe Inc. (US:ADBE) , Danaher Corporation (US:DHR) , Visa Inc. (US:V) , and Microsoft Corporation (US:MSFT) . Stralem & Co Inc’s new positions include Activision Blizzard Inc (US:ATVI) , SPDR S&P 500 ETF (US:SPY) , iShares Trust - iShares MSCI EAFE ETF (US:EFA) , .
Top Increases This Quarter
We use the change in the portfolio allocation because this is the most meaningful metric. Changes can be due to trades or changes in share prices.
| Security | Shares (MM) |
Value (MM$) |
Portfolio % | ΔPortfolio % |
|---|---|---|---|---|
| 0.07 | 4.98 | 3.1733 | 3.1733 | |
| 0.02 | 4.82 | 3.0714 | 3.0714 | |
| 0.06 | 3.96 | 2.5188 | 2.5188 | |
| 0.09 | 5.19 | 3.3051 | 0.7853 | |
| 0.03 | 6.79 | 4.3238 | 0.5786 | |
| 0.00 | 0.86 | 0.5463 | 0.5463 | |
| 0.03 | 5.87 | 3.7362 | 0.3199 | |
| 0.02 | 5.34 | 3.3981 | 0.2997 | |
| 0.00 | 0.43 | 0.2751 | 0.2751 | |
| 0.01 | 6.47 | 4.1207 | 0.2292 |
Top Decreases This Quarter
We use the change in the portfolio allocation because this is the most meaningful metric. Changes can be due to trades or changes in share prices.
| Security | Shares (MM) |
Value (MM$) |
Portfolio % | ΔPortfolio % |
|---|---|---|---|---|
| 0.00 | 0.00 | -2.8711 | ||
| 0.00 | 0.00 | -2.7419 | ||
| 0.00 | 0.00 | -2.7115 | ||
| 0.05 | 4.38 | 2.7887 | -0.5399 | |
| 0.05 | 4.17 | 2.6576 | -0.4920 | |
| 0.05 | 4.22 | 2.6881 | -0.4667 | |
| 0.12 | 4.07 | 2.5920 | -0.4596 | |
| 0.08 | 3.63 | 2.3099 | -0.3859 | |
| 0.12 | 3.77 | 2.3991 | -0.3272 | |
| 0.05 | 3.22 | 2.0508 | -0.2915 |
13F and Fund Filings
This form was filed on 2020-07-20 for the reporting period 2020-06-30. Click the link icon to see the full transaction history.
Upgrade to unlock premium data and export to Excel ![]() .
.
| Security | Type | Avg Share Price | Shares (MM) |
ΔShares (%) |
ΔShares (%) |
Value ($MM) |
Portfolio (%) |
ΔPortfolio (%) |
|
|---|---|---|---|---|---|---|---|---|---|
| META / Meta Platforms, Inc. | 0.03 | -1.08 | 6.79 | 34.66 | 4.3238 | 0.5786 | |||
| ADBE / Adobe Inc. | 0.01 | -9.71 | 6.47 | 23.51 | 4.1207 | 0.2292 | |||
| DHR / Danaher Corporation | 0.04 | -3.77 | 6.30 | 22.93 | 4.0138 | 0.2054 | |||
| V / Visa Inc. | 0.03 | -0.95 | 6.12 | 18.76 | 3.8979 | 0.0695 | |||
| MSFT / Microsoft Corporation | 0.03 | -1.15 | 5.87 | 27.57 | 3.7362 | 0.3199 | |||
| GOOGL / Alphabet Inc. | 0.00 | -1.23 | 5.58 | 20.54 | 3.5528 | 0.1150 | |||
| AVGO / Broadcom Inc. | 0.02 | -3.89 | 5.34 | 27.92 | 3.3981 | 0.2997 | |||
| DHI / D.R. Horton, Inc. | 0.09 | -6.19 | 5.19 | 52.99 | 3.3051 | 0.7853 | |||
| ICE / Intercontinental Exchange, Inc. | 0.06 | -1.16 | 5.18 | 12.10 | 3.2962 | -0.1334 | |||
| UNH / UnitedHealth Group Incorporated | 0.02 | -1.31 | 5.11 | 16.74 | 3.2554 | 0.0026 | |||
| ORCL / Oracle Corporation | 0.09 | -1.20 | 5.05 | 13.00 | 3.2147 | -0.1035 | |||
| ATVI / Activision Blizzard Inc | 0.07 | 4.98 | 3.1733 | 3.1733 | |||||
| CSCO / Cisco Systems, Inc. | 0.10 | -1.07 | 4.89 | 17.38 | 3.1135 | 0.0195 | |||
| FDX / FedEx Corporation | 0.03 | -1.07 | 4.87 | 14.42 | 3.0975 | -0.0603 | |||
| COST / Costco Wholesale Corporation | 0.02 | 4.82 | 3.0714 | 3.0714 | |||||
| PGR / The Progressive Corporation | 0.06 | -1.03 | 4.73 | 7.37 | 3.0135 | -0.2602 | |||
| D / Dominion Energy, Inc. | 0.06 | -1.10 | 4.72 | 11.23 | 3.0071 | -0.1462 | |||
| DUK / Duke Energy Corporation | 0.05 | -1.07 | 4.38 | -2.28 | 2.7887 | -0.5399 | |||
| MRK / Merck & Co., Inc. | 0.05 | -1.12 | 4.22 | -0.61 | 2.6881 | -0.4667 | |||
| AEP / American Electric Power Company, Inc. | 0.05 | -1.16 | 4.17 | -1.58 | 2.6576 | -0.4920 | |||
| ABT / Abbott Laboratories | 0.05 | -1.82 | 4.17 | 13.76 | 2.6538 | -0.0673 | |||
| PFE / Pfizer Inc. | 0.12 | -1.12 | 4.07 | -0.92 | 2.5920 | -0.4596 | |||
| ABBV / AbbVie Inc. | 0.04 | -1.22 | 4.03 | 27.28 | 2.5665 | 0.2145 | |||
| TMO / Thermo Fisher Scientific Inc. | 0.01 | -1.11 | 3.97 | 26.37 | 2.5264 | 0.1945 | |||
| RTX / RTX Corporation | 0.06 | 3.96 | 2.5188 | 2.5188 | |||||
| US0153511094 / Alexion Pharmaceuticals, Inc. | 0.04 | -1.15 | 3.95 | 23.56 | 2.5175 | 0.1410 | |||
| T / AT&T Inc. | 0.12 | -1.04 | 3.77 | 2.64 | 2.3991 | -0.3272 | |||
| KO / The Coca-Cola Company | 0.08 | -1.00 | 3.63 | -0.06 | 2.3099 | -0.3859 | |||
| JNJ / Johnson & Johnson | 0.03 | -1.36 | 3.57 | 5.78 | 2.2717 | -0.2333 | |||
| CVX / Chevron Corporation | 0.04 | -1.11 | 3.47 | 21.75 | 2.2093 | 0.0928 | |||
| KEYS / Keysight Technologies, Inc. | 0.03 | -5.22 | 3.42 | 14.17 | 2.1807 | -0.0473 | |||
| TSN / Tyson Foods, Inc. | 0.05 | -1.03 | 3.22 | 2.12 | 2.0508 | -0.2915 | |||
| KMI / Kinder Morgan, Inc. | 0.21 | -1.09 | 3.12 | 7.80 | 1.9884 | -0.1631 | |||
| AMZN / Amazon.com, Inc. | 0.00 | 0.00 | 0.86 | 41.58 | 0.5463 | 0.5463 | |||
| SPY / SPDR S&P 500 ETF | 0.00 | 0.43 | 0.2751 | 0.2751 | |||||
| QQQ / Invesco QQQ Trust, Series 1 | 0.00 | 0.00 | 0.28 | 30.23 | 0.1783 | 0.1783 | |||
| VB / Vanguard Index Funds - Vanguard Small-Cap ETF | 0.00 | 0.00 | 0.17 | 26.92 | 0.1051 | 0.1051 | |||
| VEA / Vanguard Tax-Managed Funds - Vanguard FTSE Developed Markets ETF | 0.00 | 0.00 | 0.16 | 16.06 | 0.1012 | 0.1012 | |||
| VBMFX / Vanguard Bond Index Funds - Vanguard Bond Index Fund Total Bond Market Index Fund | 0.00 | 0.00 | 0.16 | 3.95 | 0.1006 | 0.1006 | |||
| VLCSX / Vanguard Large-Cap Index Fund | 0.00 | 36.01 | 0.16 | 63.54 | 0.1000 | 0.1000 | |||
| VEU / Vanguard International Equity Index Funds - Vanguard FTSE All-World ex-US ETF | 0.00 | 0.00 | 0.12 | 15.74 | 0.0796 | 0.0796 | |||
| SHM / SPDR Series Trust - SPDR Nuveen ICE Short Term Municipal Bond ETF | 0.00 | 0.00 | 0.12 | 1.64 | 0.0790 | 0.0790 | |||
| IWD / iShares Trust - iShares Russell 1000 Value ETF | 0.00 | 0.00 | 0.12 | 14.02 | 0.0777 | 0.0777 | |||
| IVW / iShares Trust - iShares S&P 500 Growth ETF | 0.00 | 0.00 | 0.12 | 26.04 | 0.0770 | 0.0770 | |||
| EFA / iShares Trust - iShares MSCI EAFE ETF | 0.00 | 0.11 | 0.0713 | 0.0713 | |||||
| BIV / Vanguard Bond Index Funds - Vanguard Intermediate-Term Bond ETF | 0.00 | 0.00 | 0.09 | 4.82 | 0.0554 | 0.0554 | |||
| AGG / iShares Trust - iShares Core U.S. Aggregate Bond ETF | 0.00 | 0.00 | 0.09 | 3.66 | 0.0541 | 0.0541 | |||
| IWS / iShares Trust - iShares Russell Mid-Cap Value ETF | 0.00 | 0.00 | 0.09 | 19.72 | 0.0541 | 0.0541 | |||
| QCOM / QUALCOMM Incorporated | 0.00 | 0.00 | 0.08 | 33.33 | 0.0535 | 0.0067 | |||
| EFV / iShares Trust - iShares MSCI EAFE Value ETF | 0.00 | 23.53 | 0.08 | 38.98 | 0.0522 | 0.0522 | |||
| ALLO / Allogene Therapeutics, Inc. | 0.00 | 0.00 | 0.07 | 121.88 | 0.0452 | 0.0452 | |||
| AAPL / Apple Inc. | 0.00 | 0.00 | 0.06 | 43.59 | 0.0357 | 0.0067 | |||
| IWM / iShares Trust - iShares Russell 2000 ETF | 0.00 | -38.19 | 0.06 | -22.22 | 0.0357 | 0.0357 | |||
| VTV / Vanguard Index Funds - Vanguard Value ETF | 0.00 | 0.00 | 0.05 | 10.42 | 0.0337 | 0.0337 | |||
| IWP / iShares Trust - iShares Russell Mid-Cap Growth ETF | 0.00 | 0.00 | 0.05 | 27.78 | 0.0293 | 0.0293 | |||
| EFG / iShares Trust - iShares MSCI EAFE Growth ETF | 0.00 | -37.02 | 0.04 | -26.67 | 0.0280 | 0.0280 | |||
| TWTR / Twitter Inc | 0.00 | 0.00 | 0.04 | 19.35 | 0.0236 | 0.0236 | |||
| SCZ / iShares Trust - iShares MSCI EAFE Small-Cap ETF | 0.00 | 0.00 | 0.03 | 20.83 | 0.0185 | 0.0185 | |||
| BIDU / Baidu, Inc. - Depositary Receipt (Common Stock) | 0.00 | 0.00 | 0.03 | 17.39 | 0.0172 | 0.0172 | |||
| BIIB / Biogen Inc. | 0.00 | 0.00 | 0.03 | -15.62 | 0.0172 | 0.0172 | |||
| CPRX / Catalyst Pharmaceuticals, Inc. | 0.00 | 0.00 | 0.01 | 18.18 | 0.0083 | 0.0083 | |||
| BFAM / Bright Horizons Family Solutions Inc. | 0.00 | 0.00 | 0.01 | 20.00 | 0.0076 | 0.0076 | |||
| TMUS / T-Mobile US, Inc. | 0.00 | 0.00 | 0.01 | 20.00 | 0.0076 | 0.0076 | |||
| BAC / Bank of America Corporation | 0.00 | 0.00 | 0.01 | 11.11 | 0.0064 | 0.0064 | |||
| INTC / Intel Corporation | 0.00 | 0.00 | 0.01 | 14.29 | 0.0051 | 0.0051 | |||
| UAA / Under Armour, Inc. | 0.00 | 0.00 | 0.01 | 16.67 | 0.0045 | 0.0045 | |||
| AZN / AstraZeneca PLC - Depositary Receipt (Common Stock) | 0.00 | 0.00 | 0.01 | 20.00 | 0.0038 | 0.0038 | |||
| MCK / McKesson Corporation | 0.00 | 0.00 | 0.01 | 20.00 | 0.0038 | 0.0038 | |||
| WFC / Wells Fargo & Company | 0.00 | 0.00 | 0.01 | -14.29 | 0.0038 | -0.0014 | |||
| RE / Everest Re Group Ltd | 0.00 | 0.00 | 0.01 | 20.00 | 0.0038 | 0.0038 | |||
| PEP / PepsiCo, Inc. | 0.00 | 0.00 | 0.01 | 20.00 | 0.0038 | 0.0001 | |||
| GILD / Gilead Sciences, Inc. | 0.00 | 0.00 | 0.01 | 0.00 | 0.0038 | -0.0006 | |||
| CMCSA / Comcast Corporation | 0.00 | 0.00 | 0.01 | 0.00 | 0.0038 | 0.0038 | |||
| CI / The Cigna Group | 0.00 | 0.00 | 0.01 | 0.00 | 0.0038 | 0.0038 | |||
| SYF / Synchrony Financial | 0.00 | 0.00 | 0.01 | 25.00 | 0.0032 | 0.0032 | |||
| LBRDA / Liberty Broadband Corporation | 0.00 | 0.00 | 0.01 | 25.00 | 0.0032 | 0.0002 | |||
| FNF / Fidelity National Financial, Inc. | 0.00 | 0.00 | 0.01 | 25.00 | 0.0032 | 0.0032 | |||
| HES / Hess Corporation | 0.00 | 0.00 | 0.01 | 66.67 | 0.0032 | 0.0032 | |||
| AIG / American International Group, Inc. | 0.00 | 0.00 | 0.01 | 25.00 | 0.0032 | 0.0032 | |||
| JNPR / Juniper Networks, Inc. | 0.00 | 0.00 | 0.01 | 25.00 | 0.0032 | 0.0032 | |||
| EOG / EOG Resources, Inc. | 0.00 | 0.00 | 0.01 | 66.67 | 0.0032 | 0.0010 | |||
| PM / Philip Morris International Inc. | 0.00 | 0.00 | 0.01 | -16.67 | 0.0032 | -0.0013 | |||
| SUI / Sun Communities, Inc. | 0.00 | 0.00 | 0.00 | 0.00 | 0.0025 | 0.0025 | |||
| HPQ / HP Inc. | 0.00 | 0.00 | 0.00 | 0.00 | 0.0025 | 0.0025 | |||
| NI / NiSource Inc. | 0.00 | 0.00 | 0.00 | 0.00 | 0.0025 | 0.0025 | |||
| GS / The Goldman Sachs Group, Inc. | 0.00 | 0.00 | 0.00 | 33.33 | 0.0025 | 0.0025 | |||
| MGA / Magna International Inc. | 0.00 | 0.00 | 0.00 | 33.33 | 0.0025 | 0.0025 | |||
| PG / The Procter & Gamble Company | 0.00 | 0.00 | 0.00 | 33.33 | 0.0025 | 0.0003 | |||
| FOXA / Fox Corporation | 0.00 | 0.00 | 0.00 | 33.33 | 0.0025 | 0.0025 | |||
| NOK / Nokia Oyj - Depositary Receipt (Common Stock) | 0.00 | 0.00 | 0.00 | 33.33 | 0.0025 | 0.0025 | |||
| OSK / Oshkosh Corporation | 0.00 | 0.00 | 0.00 | 0.00 | 0.0019 | 0.0019 | |||
| COF / Capital One Financial Corporation | 0.00 | 0.00 | 0.00 | 50.00 | 0.0019 | 0.0019 | |||
| HCC / Warrior Met Coal, Inc. | 0.00 | 0.00 | 0.00 | 0.00 | 0.0019 | 0.0019 | |||
| MPC / Marathon Petroleum Corporation | 0.00 | 0.00 | 0.00 | 50.00 | 0.0019 | 0.0019 | |||
| EIX / Edison International | 0.00 | 0.00 | 0.00 | 0.00 | 0.0019 | 0.0019 | |||
| BAH / Booz Allen Hamilton Holding Corporation | 0.00 | 0.00 | 0.00 | 50.00 | 0.0019 | 0.0019 | |||
| MOS / The Mosaic Company | 0.00 | 0.00 | 0.00 | 0.00 | 0.0013 | -0.0002 | |||
| ZION / Zions Bancorporation, National Association | 0.00 | 0.00 | 0.00 | 0.00 | 0.0013 | 0.0013 | |||
| LEA / Lear Corporation | 0.00 | 0.00 | 0.00 | 100.00 | 0.0013 | 0.0013 | |||
| SJM / The J. M. Smucker Company | 0.00 | 0.00 | 0.00 | 0.00 | 0.0013 | 0.0013 | |||
| OMF / OneMain Holdings, Inc. | 0.00 | 0.00 | 0.00 | 100.00 | 0.0013 | 0.0013 | |||
| BTI / British American Tobacco p.l.c. - Depositary Receipt (Common Stock) | 0.00 | 0.00 | 0.00 | 0.00 | 0.0013 | 0.0013 | |||
| JBLU / JetBlue Airways Corporation | 0.00 | 0.00 | 0.00 | 100.00 | 0.0013 | 0.0005 | |||
| TEVA / Teva Pharmaceutical Industries Limited - Depositary Receipt (Common Stock) | 0.00 | 0.00 | 0.00 | 100.00 | 0.0013 | 0.0013 | |||
| CMA / Comerica Incorporated | 0.00 | 0.00 | 0.00 | 0.00 | 0.0013 | 0.0013 | |||
| CF / CF Industries Holdings, Inc. | 0.00 | 0.00 | 0.00 | 0.00 | 0.0013 | 0.0013 | |||
| XRX / Xerox Holdings Corporation | 0.00 | 0.00 | 0.00 | -50.00 | 0.0006 | 0.0006 | |||
| CNQ / Canadian Natural Resources Limited | 0.00 | 0.00 | 0.00 | 0.00 | 0.0006 | 0.0006 | |||
| AA / Alcoa Corporation | 0.00 | 0.00 | 0.00 | 0.0006 | 0.0006 | ||||
| NCR / NCR Corp. | 0.00 | 0.00 | 0.00 | 0.00 | 0.0006 | 0.0006 | |||
| US59408Q1067 / Michaels Companies Inc. (The) | 0.00 | 0.00 | 0.00 | 0.0006 | 0.0006 | ||||
| RES / RPC, Inc. | 0.00 | 0.00 | 0.00 | 0.0006 | 0.0006 | ||||
| DVN / Devon Energy Corporation | 0.00 | 0.00 | 0.00 | 0.00 | 0.0006 | -0.0001 | |||
| DRQ / Dril-Quip, Inc. | 0.00 | 0.00 | 0.00 | 0.00 | 0.0006 | 0.0006 | |||
| UAL / United Airlines Holdings, Inc. | 0.00 | 0.00 | 0.00 | 0.0000 | 0.0000 | ||||
| RTN / Raytheon Co. | 0.00 | -100.00 | 0.00 | -100.00 | -2.7115 | ||||
| BLDP / Ballard Power Systems Inc. | 0.00 | 0.00 | 0.00 | 0.0000 | 0.0000 | ||||
| SIG / Signet Jewelers Limited | 0.00 | 0.00 | 0.00 | 0.0000 | 0.0000 | ||||
| APTV / Aptiv PLC | 0.00 | -100.00 | 0.00 | -100.00 | -2.7419 | ||||
| DOW / Dow Inc. | 0.00 | -100.00 | 0.00 | -100.00 | -2.8711 | ||||
| CSIQ / Canadian Solar Inc. | 0.00 | 0.00 | 0.00 | 0.0000 | 0.0000 |