Basic Stats
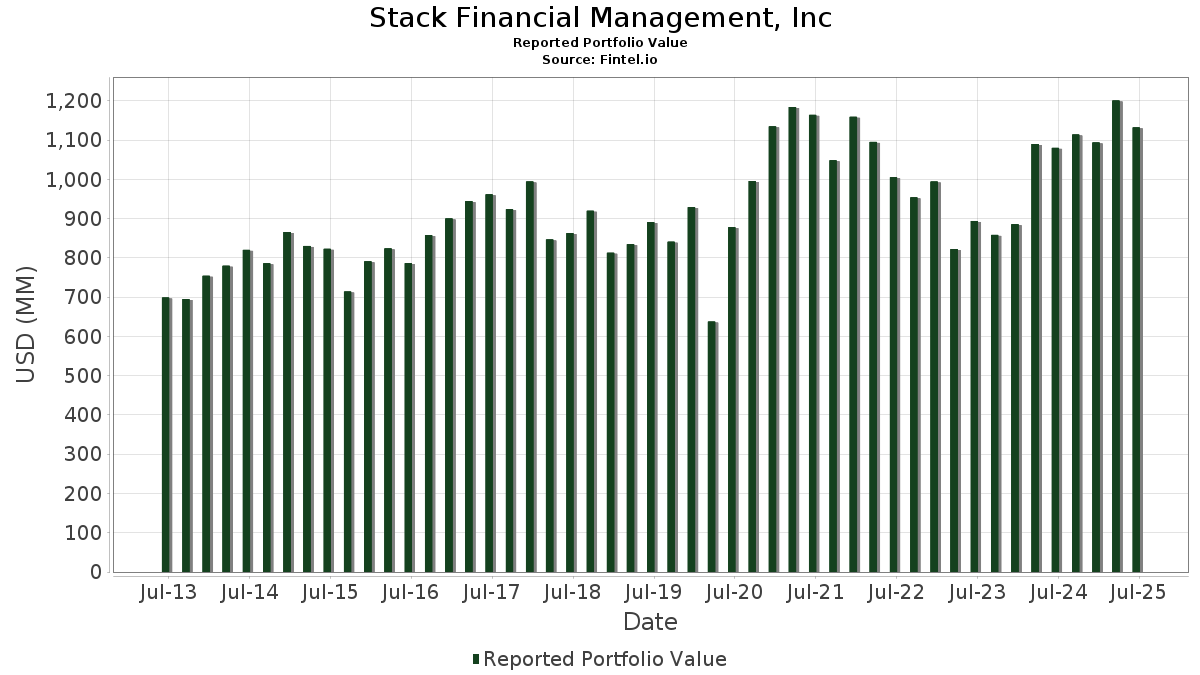
| Portfolio Value | $ 1,132,028,157 |
| Current Positions | 49 |
Latest Holdings, Performance, AUM (from 13F, 13D)
Stack Financial Management, Inc has disclosed 49 total holdings in their latest SEC filings. Most recent portfolio value is calculated to be $ 1,132,028,157 USD. Actual Assets Under Management (AUM) is this value plus cash (which is not disclosed). Stack Financial Management, Inc’s top holdings are Microsoft Corporation (US:MSFT) , Walmart Inc. (US:WMT) , Berkshire Hathaway Inc. (US:BRK.A) , Quanta Services, Inc. (US:PWR) , and Accenture plc (US:ACN) . Stack Financial Management, Inc’s new positions include American Tower Corporation (US:AMT) , .
Top Increases This Quarter
We use the change in the portfolio allocation because this is the most meaningful metric. Changes can be due to trades or changes in share prices.
| Security | Shares (MM) |
Value (MM$) |
Portfolio % | ΔPortfolio % |
|---|---|---|---|---|
| 0.23 | 116.44 | 10.2856 | 2.8009 | |
| 0.32 | 21.88 | 1.9331 | 1.9331 | |
| 0.13 | 50.73 | 4.4815 | 1.5948 | |
| 1.05 | 103.02 | 9.1005 | 1.2488 | |
| 0.06 | 13.02 | 1.1502 | 1.1502 | |
| 0.14 | 36.33 | 3.2090 | 0.6410 | |
| 0.35 | 31.67 | 2.7980 | 0.4799 | |
| 0.16 | 21.02 | 1.8565 | 0.3819 | |
| 0.10 | 17.56 | 1.5509 | 0.3318 | |
| 0.07 | 29.02 | 2.5634 | 0.2594 |
Top Decreases This Quarter
We use the change in the portfolio allocation because this is the most meaningful metric. Changes can be due to trades or changes in share prices.
| Security | Shares (MM) |
Value (MM$) |
Portfolio % | ΔPortfolio % |
|---|---|---|---|---|
| 0.26 | 30.56 | 2.6995 | -0.6630 | |
| 0.27 | 39.38 | 3.4783 | -0.4003 | |
| 0.12 | 58.15 | 5.1366 | -0.2533 | |
| 0.20 | 11.39 | 1.0061 | -0.1902 | |
| 0.18 | 16.58 | 1.4647 | -0.1607 | |
| 0.22 | 17.16 | 1.5157 | -0.1350 | |
| 0.12 | 15.65 | 1.3822 | -0.1219 | |
| 0.29 | 11.05 | 0.9761 | -0.0976 | |
| 0.11 | 16.65 | 1.4710 | -0.0640 | |
| 0.20 | 23.99 | 2.1193 | -0.0527 |
13F and Fund Filings
This form was filed on 2025-07-25 for the reporting period 2025-06-30. Click the link icon to see the full transaction history.
Upgrade to unlock premium data and export to Excel ![]() .
.
| Security | Type | Avg Share Price | Shares (MM) |
ΔShares (%) |
ΔShares (%) |
Value ($MM) |
Portfolio (%) |
ΔPortfolio (%) |
|
|---|---|---|---|---|---|---|---|---|---|
| MSFT / Microsoft Corporation | 0.23 | -2.20 | 116.44 | 29.58 | 10.2856 | 2.8009 | |||
| WMT / Walmart Inc. | 1.05 | -1.87 | 103.02 | 9.29 | 9.1005 | 1.2488 | |||
| BRK.A / Berkshire Hathaway Inc. | 0.12 | -1.48 | 58.15 | -10.14 | 5.1366 | -0.2533 | |||
| PWR / Quanta Services, Inc. | 0.13 | -1.58 | 50.73 | 46.39 | 4.4815 | 1.5948 | |||
| ACN / Accenture plc | 0.14 | -1.36 | 40.91 | -5.52 | 3.6138 | 0.0070 | |||
| CVX / Chevron Corporation | 0.27 | -1.20 | 39.38 | -15.44 | 3.4783 | -0.4003 | |||
| LHX / L3Harris Technologies, Inc. | 0.14 | -1.68 | 36.33 | 17.83 | 3.2090 | 0.6410 | |||
| WM / Waste Management, Inc. | 0.15 | -1.10 | 33.53 | -2.25 | 2.9616 | 0.1046 | |||
| WPM / Wheaton Precious Metals Corp. | 0.35 | -1.61 | 31.67 | 13.82 | 2.7980 | 0.4799 | |||
| AEM / Agnico Eagle Mines Limited | 0.26 | -30.99 | 30.56 | -24.30 | 2.6995 | -0.6630 | |||
| AEP / American Electric Power Company, Inc. | 0.29 | -1.56 | 30.23 | -6.53 | 2.6706 | -0.0235 | |||
| SYK / Stryker Corporation | 0.07 | -1.29 | 29.02 | 4.91 | 2.5634 | 0.2594 | |||
| CNP / CenterPoint Energy, Inc. | 0.72 | -1.08 | 26.57 | 0.31 | 2.3468 | 0.1408 | |||
| PSX / Phillips 66 | 0.22 | -1.02 | 26.47 | -4.36 | 2.3381 | 0.0327 | |||
| CBOE / Cboe Global Markets, Inc. | 0.11 | -1.56 | 24.85 | 1.45 | 2.1956 | 0.1549 | |||
| CI / The Cigna Group | 0.07 | -1.78 | 24.17 | -1.31 | 2.1355 | 0.0951 | |||
| EOG / EOG Resources, Inc. | 0.20 | -1.35 | 23.99 | -7.99 | 2.1193 | -0.0527 | |||
| MDLZ / Mondelez International, Inc. | 0.34 | -1.43 | 23.02 | -2.03 | 2.0340 | 0.0764 | |||
| KO / The Coca-Cola Company | 0.32 | -1.80 | 22.80 | -2.99 | 2.0141 | 0.0564 | |||
| DUK / Duke Energy Corporation | 0.19 | -1.29 | 22.70 | -4.50 | 2.0051 | 0.0252 | |||
| NEE / NextEra Energy, Inc. | 0.32 | 21.88 | 1.9331 | 1.9331 | |||||
| EMR / Emerson Electric Co. | 0.16 | -2.38 | 21.02 | 18.71 | 1.8565 | 0.3819 | |||
| LMT / Lockheed Martin Corporation | 0.04 | -2.17 | 20.84 | 1.43 | 1.8407 | 0.1294 | |||
| PCAR / PACCAR Inc | 0.21 | -1.36 | 19.82 | -3.70 | 1.7511 | 0.0364 | |||
| LH / Labcorp Holdings Inc. | 0.07 | -1.43 | 19.31 | 11.18 | 1.7060 | 0.2590 | |||
| CAH / Cardinal Health, Inc. | 0.10 | -1.63 | 17.56 | 19.97 | 1.5509 | 0.3318 | |||
| MRK / Merck & Co., Inc. | 0.22 | -1.82 | 17.16 | -13.42 | 1.5157 | -0.1350 | |||
| JNJ / Johnson & Johnson | 0.11 | -1.89 | 16.65 | -9.64 | 1.4710 | -0.0640 | |||
| COP / ConocoPhillips | 0.18 | -0.56 | 16.58 | -15.02 | 1.4647 | -0.1607 | |||
| PEP / PepsiCo, Inc. | 0.12 | -1.60 | 15.65 | -13.35 | 1.3822 | -0.1219 | |||
| MDT / Medtronic plc | 0.18 | -1.65 | 15.52 | -4.60 | 1.3711 | 0.0159 | |||
| DHR / Danaher Corporation | 0.08 | -0.76 | 15.20 | -4.37 | 1.3431 | 0.0187 | |||
| GJR / Strats Trust For Procter & Gambel Security - Preferred Security | 0.10 | -1.46 | 15.18 | -7.88 | 1.3407 | -0.0317 | |||
| AEE / Ameren Corporation | 0.16 | -1.13 | 14.90 | -5.43 | 1.3159 | 0.0038 | |||
| DTE / DTE Energy Company | 0.11 | -0.93 | 14.74 | -5.09 | 1.3024 | 0.0084 | |||
| DOV / Dover Corporation | 0.08 | -2.06 | 14.71 | 2.15 | 1.2993 | 0.0999 | |||
| AMT / American Tower Corporation | 0.06 | 13.02 | 1.1502 | 1.1502 | |||||
| UNP / Union Pacific Corporation | 0.05 | -1.26 | 11.47 | -3.84 | 1.0134 | 0.0197 | |||
| NEM / Newmont Corporation | 0.20 | -34.28 | 11.39 | -20.69 | 1.0061 | -0.1902 | |||
| BKR / Baker Hughes Company | 0.29 | -1.73 | 11.05 | -14.28 | 0.9761 | -0.0976 | |||
| GPC / Genuine Parts Company | 0.09 | -2.01 | 10.40 | -0.22 | 0.9191 | 0.0504 | |||
| GDX / VanEck ETF Trust - VanEck Gold Miners ETF | 0.02 | -22.72 | 0.88 | -12.50 | 0.0780 | -0.0060 | |||
| SPY / SPDR S&P 500 ETF | 0.00 | 0.00 | 0.85 | 10.52 | 0.0752 | 0.0110 | |||
| AAPL / Apple Inc. | 0.00 | -2.10 | 0.43 | -9.47 | 0.0380 | -0.0016 | |||
| JPM / JPMorgan Chase & Co. | 0.00 | 0.00 | 0.32 | 18.35 | 0.0279 | 0.0056 | |||
| XLI / The Select Sector SPDR Trust - The Industrial Select Sector SPDR Fund | 0.00 | -0.42 | 0.31 | 12.14 | 0.0278 | 0.0044 | |||
| XLV / The Select Sector SPDR Trust - The Health Care Select Sector SPDR Fund | 0.00 | 2.82 | 0.22 | -5.15 | 0.0196 | 0.0001 | |||
| ITW / Illinois Tool Works Inc. | 0.00 | 0.00 | 0.21 | -0.47 | 0.0188 | 0.0010 | |||
| XLE / The Select Sector SPDR Trust - The Energy Select Sector SPDR Fund | 0.00 | 1.60 | 0.21 | -7.93 | 0.0185 | -0.0004 | |||
| CMCSA / Comcast Corporation | 0.00 | -100.00 | 0.00 | 0.0000 | |||||
| IQV / IQVIA Holdings Inc. | 0.00 | -100.00 | 0.00 | 0.0000 | |||||
| SPYV / SPDR Series Trust - SPDR Portfolio S&P 500 Value ETF | 0.00 | -100.00 | 0.00 | 0.0000 | |||||
| SH / ProShares Trust - ProShares Short S&P500 | 0.00 | -100.00 | 0.00 | 0.0000 | |||||
| UNH / UnitedHealth Group Incorporated | 0.00 | -100.00 | 0.00 | 0.0000 | |||||
| KHC / The Kraft Heinz Company | 0.00 | -100.00 | 0.00 | 0.0000 |