Basic Stats
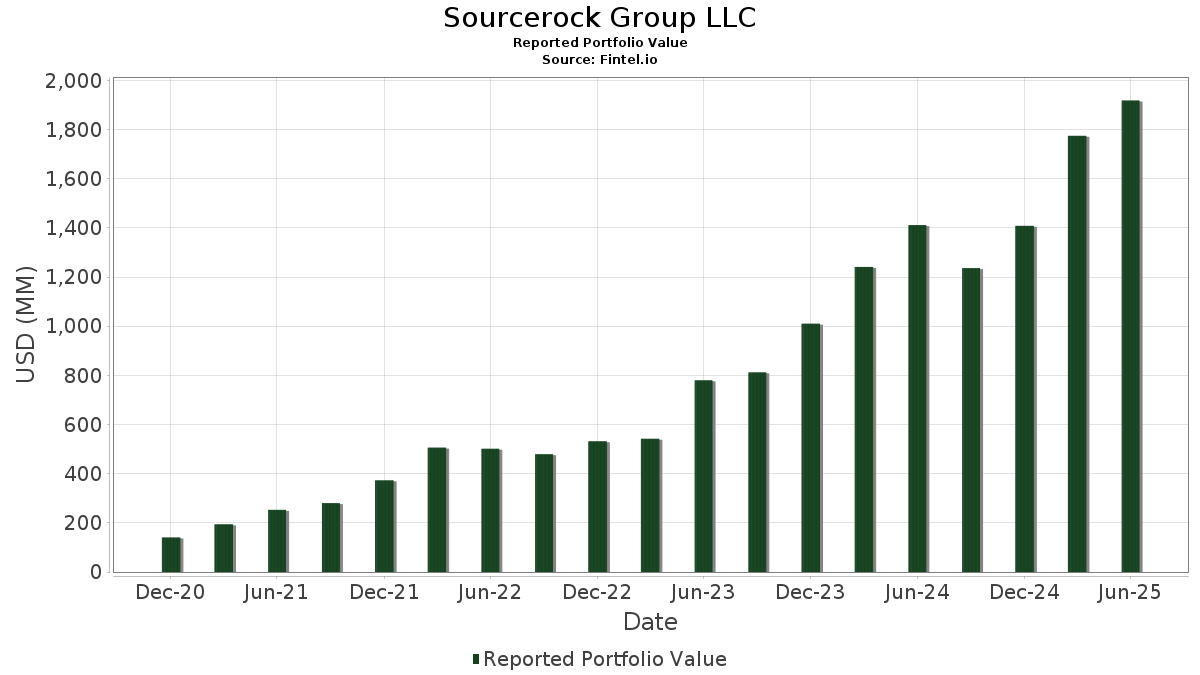
| Portfolio Value | $ 1,917,938,032 |
| Current Positions | 39 |
Latest Holdings, Performance, AUM (from 13F, 13D)
Sourcerock Group LLC has disclosed 39 total holdings in their latest SEC filings. Most recent portfolio value is calculated to be $ 1,917,938,032 USD. Actual Assets Under Management (AUM) is this value plus cash (which is not disclosed). Sourcerock Group LLC’s top holdings are Antero Resources Corporation (US:AR) , EQT Corporation (US:EQT) , Noble Corporation plc (US:NE) , Tenaris S.A. - Depositary Receipt (Common Stock) (US:TS) , and Chord Energy Corporation (US:CHRD) . Sourcerock Group LLC’s new positions include Cameco Corporation (US:CCJ) , Peabody Energy Corporation (US:BTU) , Coterra Energy Inc. (US:CTRA) , Range Resources Corporation (US:RRC) , and Kinder Morgan, Inc. (US:KMI) . Sourcerock Group LLC’s top industries are "Engineering, Accounting, Research, Management, And Related Services" (sic 87) , "Amusement And Recreation Services" (sic 79) , and "Heavy Construction Other Than Building Construction Contractors" (sic 16) .
Top Increases This Quarter
We use the change in the portfolio allocation because this is the most meaningful metric. Changes can be due to trades or changes in share prices.
| Security | Shares (MM) |
Value (MM$) |
Portfolio % | ΔPortfolio % |
|---|---|---|---|---|
| 1.66 | 85.33 | 4.4489 | 4.4489 | |
| 1.75 | 55.71 | 2.9046 | 2.7392 | |
| 0.58 | 43.24 | 2.2546 | 2.2546 | |
| 5.18 | 137.64 | 7.1767 | 1.7985 | |
| 2.00 | 91.37 | 4.7640 | 1.7374 | |
| 2.09 | 28.09 | 1.4647 | 1.4647 | |
| 2.06 | 23.65 | 1.2333 | 1.2333 | |
| 13.80 | 81.86 | 4.2679 | 1.2113 | |
| 0.54 | 44.45 | 2.3174 | 1.1979 | |
| 0.86 | 21.80 | 1.1365 | 1.1365 |
Top Decreases This Quarter
We use the change in the portfolio allocation because this is the most meaningful metric. Changes can be due to trades or changes in share prices.
| Security | Shares (MM) |
Value (MM$) |
Portfolio % | ΔPortfolio % |
|---|---|---|---|---|
| 2.73 | 159.01 | 8.2909 | -8.0486 | |
| 3.62 | 99.76 | 5.2014 | -3.6917 | |
| 0.20 | 4.08 | 0.2125 | -3.5480 | |
| 1.03 | 99.95 | 5.2111 | -1.2117 | |
| 0.00 | 0.00 | -0.9597 | ||
| 0.36 | 2.27 | 0.1182 | -0.8653 | |
| 2.93 | 86.56 | 4.5131 | -0.8181 | |
| 11.19 | 94.92 | 4.9490 | -0.5742 | |
| 0.79 | 12.30 | 0.6411 | -0.3778 | |
| 2.28 | 31.85 | 1.6607 | -0.3232 |
13D/G Filings
This is a list of 13D and 13G filings made in the last year (if any). Click the link icon to see the full transaction history. Green rows indicate new positions. Red rows indicate closed positions.
| File Date | Form | Security | Prev Shares |
Current Shares |
ΔShares % | % Ownership |
% ΔOwnership | |
|---|---|---|---|---|---|---|---|---|
| 2025-08-15 | PUMP / ProPetro Holding Corp. | 8,408,391 | 8.10 | |||||
| 2025-08-15 | TALO / Talos Energy Inc. | 7,465,773 | 11,193,177 | 49.93 | 6.30 | 5.00 |
13F and Fund Filings
This form was filed on 2025-08-14 for the reporting period 2025-06-30. Click the link icon to see the full transaction history.
Upgrade to unlock premium data and export to Excel ![]() .
.
| Security | Type | Avg Share Price | Shares (MM) |
ΔShares (%) |
ΔShares (%) |
Value ($MM) |
Portfolio (%) |
ΔPortfolio (%) |
|
|---|---|---|---|---|---|---|---|---|---|
| AR / Antero Resources Corporation | 8.16 | 10.62 | 328.53 | 10.18 | 17.1293 | 0.3255 | |||
| EQT / EQT Corporation | 2.73 | -49.75 | 159.01 | -45.15 | 8.2909 | -8.0486 | |||
| NE / Noble Corporation plc | 5.18 | 28.75 | 137.64 | 44.24 | 7.1767 | 1.7985 | |||
| TS / Tenaris S.A. - Depositary Receipt (Common Stock) | 3.09 | 25.95 | 115.42 | 20.44 | 6.0179 | 0.6172 | |||
| CHRD / Chord Energy Corporation | 1.03 | 2.07 | 99.95 | -12.30 | 5.2111 | -1.2117 | |||
| CIVI / Civitas Resources, Inc. | 3.62 | -19.85 | 99.76 | -36.78 | 5.2014 | -3.6917 | |||
| TALO / Talos Energy Inc. | 11.19 | 11.02 | 94.92 | -3.15 | 4.9490 | -0.5742 | |||
| CRC / California Resources Corporation | 2.00 | 63.80 | 91.37 | 70.14 | 4.7640 | 1.7374 | |||
| AA / Alcoa Corporation | 2.93 | -5.43 | 86.56 | -8.50 | 4.5131 | -0.8181 | |||
| FLR / Fluor Corporation | 1.66 | 85.33 | 4.4489 | 4.4489 | |||||
| PTEN / Patterson-UTI Energy, Inc. | 13.80 | 109.21 | 81.86 | 50.93 | 4.2679 | 1.2113 | |||
| DVN / Devon Energy Corporation | 1.75 | 2,132.29 | 55.71 | 1,798.70 | 2.9046 | 2.7392 | |||
| PUMP / ProPetro Holding Corp. | 8.41 | 66.42 | 50.20 | 35.17 | 2.6173 | 0.5244 | |||
| OKE / ONEOK, Inc. | 0.54 | 171.97 | 44.45 | 123.76 | 2.3174 | 1.1979 | |||
| CCJ / Cameco Corporation | 0.58 | 43.24 | 2.2546 | 2.2546 | |||||
| PCG / PG&E Corporation | 2.28 | 11.51 | 31.85 | -9.52 | 1.6607 | -0.3232 | |||
| PR / Permian Resources Corporation | 2.09 | -0.30 | 28.40 | -1.95 | 1.4808 | -0.1517 | |||
| BTU / Peabody Energy Corporation | 2.09 | 28.09 | 1.4647 | 1.4647 | |||||
| CENX / Century Aluminum Company | 1.42 | 612.04 | 25.66 | 591.33 | 1.3380 | 1.1288 | |||
| LNG / Cheniere Energy, Inc. | 0.10 | 94.23 | 24.72 | 104.41 | 1.2889 | 0.6073 | |||
| LBRT / Liberty Energy Inc. | 2.06 | 23.65 | 1.2333 | 1.2333 | |||||
| CTRA / Coterra Energy Inc. | 0.86 | 21.80 | 1.1365 | 1.1365 | |||||
| UGI / UGI Corporation | 0.56 | -22.27 | 20.56 | -14.40 | 1.0721 | -0.2817 | |||
| DTM / DT Midstream, Inc. | 0.16 | -23.17 | 17.65 | -12.47 | 0.9203 | -0.2162 | |||
| TRP / TC Energy Corporation | 0.31 | 15.10 | 0.7871 | 0.7871 | |||||
| SR / Spire Inc. | 0.18 | -8.58 | 13.05 | -14.73 | 0.6803 | -0.1820 | |||
| RRC / Range Resources Corporation | 0.31 | 12.57 | 0.6552 | 0.6552 | |||||
| VG / Venture Global, Inc. | 0.79 | -55.04 | 12.30 | -31.99 | 0.6411 | -0.3778 | |||
| KMI / Kinder Morgan, Inc. | 0.41 | 12.12 | 0.6320 | 0.6320 | |||||
| XEL / Xcel Energy Inc. | 0.14 | 102.37 | 9.65 | 94.67 | 0.5030 | 0.2237 | |||
| FCX / Freeport-McMoRan Inc. | 0.22 | 9.54 | 0.4973 | 0.4973 | |||||
| SWX / Southwest Gas Holdings, Inc. | 0.12 | 8.94 | 0.4662 | 0.4662 | |||||
| GLNG / Golar LNG Limited | 0.18 | 77.98 | 7.34 | 92.98 | 0.3826 | 0.1683 | |||
| KGS / Kodiak Gas Services, Inc. | 0.18 | -36.67 | 6.21 | -41.82 | 0.3238 | -0.2777 | |||
| CMS / CMS Energy Corporation | 0.07 | 5.04 | 0.2626 | 0.2626 | |||||
| HAL / Halliburton Company | 0.20 | -92.40 | 4.08 | -93.89 | 0.2125 | -3.5480 | |||
| HLX / Helix Energy Solutions Group, Inc. | 0.36 | -82.70 | 2.27 | -87.01 | 0.1182 | -0.8653 | |||
| XOP / SPDR Series Trust - SPDR S&P Oil & Gas Exploration & Production ETF | 0.02 | -12.43 | 2.26 | -16.37 | 0.1177 | -0.0344 | |||
| EE / Excelerate Energy, Inc. | 0.04 | 1.17 | 0.0611 | 0.0611 | |||||
| TLNE / Talen Energy Corporation | 0.00 | -100.00 | 0.00 | 0.0000 | |||||
| FRO / Frontline plc | 0.00 | -100.00 | 0.00 | 0.0000 | |||||
| DHT / DHT Holdings, Inc. | 0.00 | -100.00 | 0.00 | 0.0000 | |||||
| VST / Vistra Corp. | 0.00 | -100.00 | 0.00 | 0.0000 | |||||
| SGML / Sigma Lithium Corporation | 0.00 | -100.00 | 0.00 | -100.00 | -0.9597 | ||||
| LNT / Alliant Energy Corporation | 0.00 | -100.00 | 0.00 | 0.0000 | |||||
| STNG / Scorpio Tankers Inc. | 0.00 | -100.00 | 0.00 | 0.0000 | |||||
| NRG / NRG Energy, Inc. | 0.00 | -100.00 | 0.00 | 0.0000 | |||||
| NFG / National Fuel Gas Company | 0.00 | -100.00 | 0.00 | 0.0000 | |||||
| BTE / Baytex Energy Corp. | 0.00 | -100.00 | 0.00 | 0.0000 | |||||
| NXT / Nextracker Inc. | 0.00 | -100.00 | 0.00 | 0.0000 |