Basic Stats
| Portfolio Value | $ 4,994,660,284 |
| Current Positions | 33 |
Latest Holdings, Performance, AUM (from 13F, 13D)
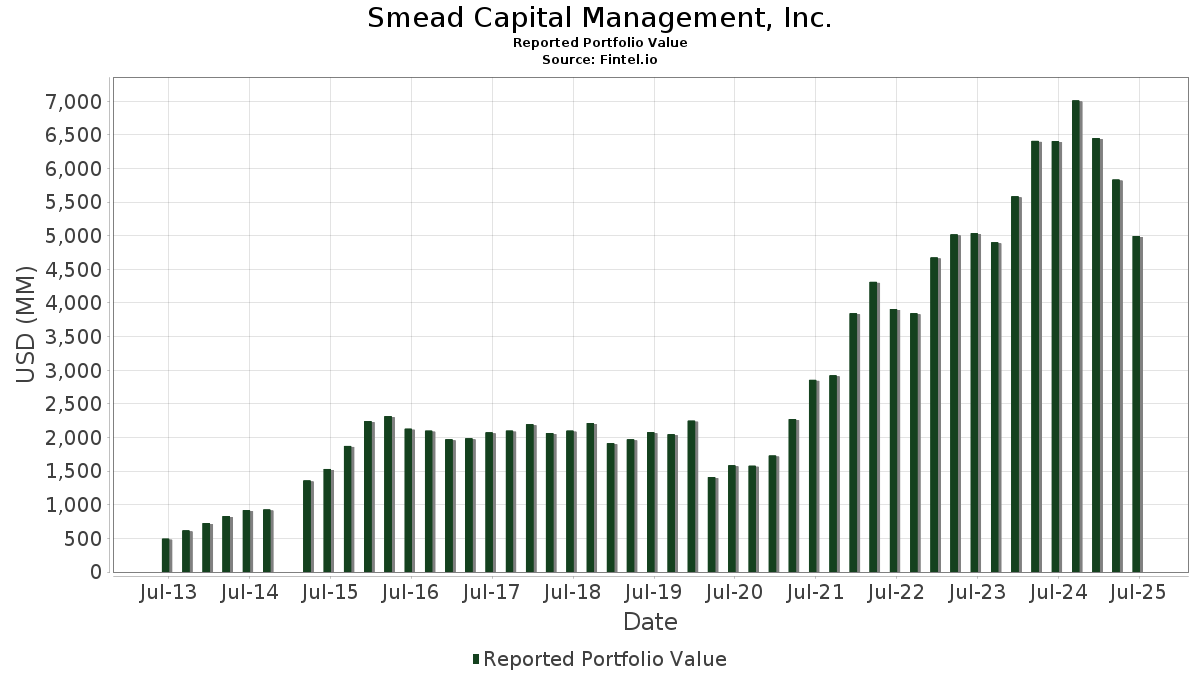
Smead Capital Management, Inc. has disclosed 33 total holdings in their latest SEC filings. Most recent portfolio value is calculated to be $ 4,994,660,284 USD. Actual Assets Under Management (AUM) is this value plus cash (which is not disclosed). Smead Capital Management, Inc.’s top holdings are Simon Property Group, Inc. (US:SPG) , American Express Company (US:AXP) , The Macerich Company (US:MAC) , Merck & Co., Inc. (US:MRK) , and Amgen Inc. (US:AMGN) . Smead Capital Management, Inc.’s new positions include Diamondback Energy, Inc. (US:FANG) , UnitedHealth Group Incorporated (US:UNH) , . Smead Capital Management, Inc.’s top industries are "Printing, Publishing, And Allied Industries" (sic 27) , "Wholesale Trade-non-durable Goods" (sic 51) , and "Restaurants, Dining, Eating And Drinking Places" (sic 58) .
Top Increases This Quarter
We use the change in the portfolio allocation because this is the most meaningful metric. Changes can be due to trades or changes in share prices.
| Security | Shares (MM) |
Value (MM$) |
Portfolio % | ΔPortfolio % |
|---|---|---|---|---|
| 1.05 | 144.78 | 2.8986 | 2.8986 | |
| 0.25 | 78.75 | 1.5767 | 1.5767 | |
| 17.55 | 239.00 | 4.7851 | 1.0922 | |
| 1.97 | 194.65 | 3.8971 | 0.9662 | |
| 0.72 | 114.93 | 2.3012 | 0.6867 | |
| 2.84 | 154.54 | 3.0941 | 0.6582 | |
| 1.44 | 111.92 | 2.2408 | 0.6549 | |
| 0.22 | 110.45 | 2.2114 | 0.5705 | |
| 2.93 | 218.35 | 4.3716 | 0.5130 | |
| 0.17 | 77.26 | 1.5469 | 0.3709 |
Top Decreases This Quarter
We use the change in the portfolio allocation because this is the most meaningful metric. Changes can be due to trades or changes in share prices.
| Security | Shares (MM) |
Value (MM$) |
Portfolio % | ΔPortfolio % |
|---|---|---|---|---|
| 2.40 | 76.37 | 1.5289 | -2.1296 | |
| 0.00 | 0.00 | -1.7261 | ||
| 4.07 | 171.05 | 3.4247 | -1.5998 | |
| 4.36 | 165.73 | 3.3181 | -1.1205 | |
| 3.65 | 172.66 | 3.4569 | -0.5924 | |
| 10.94 | 200.12 | 4.0066 | -0.4634 | |
| 1.89 | 169.38 | 3.3912 | -0.4604 | |
| 0.92 | 257.70 | 5.1595 | -0.4270 | |
| 0.65 | 187.86 | 3.7613 | -0.3898 | |
| 16.07 | 260.08 | 5.2071 | -0.1541 |
13D/G Filings
This is a list of 13D and 13G filings made in the last year (if any). Click the link icon to see the full transaction history. Green rows indicate new positions. Red rows indicate closed positions.
| File Date | Form | Security | Prev Shares |
Current Shares |
ΔShares % | % Ownership |
% ΔOwnership | |
|---|---|---|---|---|---|---|---|---|
| 2025-05-14 | MAC / The Macerich Company | 0 | 18,214,281 | 7.21 | -24.11 |
13F and Fund Filings
This form was filed on 2025-08-14 for the reporting period 2025-06-30. Click the link icon to see the full transaction history.
Upgrade to unlock premium data and export to Excel ![]() .
.
| Security | Type | Avg Share Price | Shares (MM) |
ΔShares (%) |
ΔShares (%) |
Value ($MM) |
Portfolio (%) |
ΔPortfolio (%) |
|
|---|---|---|---|---|---|---|---|---|---|
| SPG / Simon Property Group, Inc. | 2.06 | -11.76 | 331.49 | -14.59 | 6.6369 | -0.0161 | |||
| AXP / American Express Company | 0.88 | -27.97 | 282.21 | -14.60 | 5.6503 | -0.0148 | |||
| MAC / The Macerich Company | 16.07 | -11.75 | 260.08 | -16.84 | 5.2071 | -0.1541 | |||
| MRK / Merck & Co., Inc. | 3.27 | -2.02 | 258.64 | -13.59 | 5.1783 | 0.0474 | |||
| AMGN / Amgen Inc. | 0.92 | -11.76 | 257.70 | -20.92 | 5.1595 | -0.4270 | |||
| DHI / D.R. Horton, Inc. | 1.98 | -11.76 | 255.24 | -10.52 | 5.1103 | 0.2205 | |||
| CVE / Cenovus Energy Inc. | 17.55 | 13.27 | 239.00 | 10.95 | 4.7851 | 1.0922 | |||
| LEN / Lennar Corporation | 2.10 | -11.76 | 232.05 | -14.97 | 4.6459 | -0.0321 | |||
| EBAY / eBay Inc. | 2.93 | -11.76 | 218.35 | -3.00 | 4.3716 | 0.5130 | |||
| NVR / NVR, Inc. | 0.03 | -11.76 | 210.39 | -10.04 | 4.2123 | 0.2031 | |||
| APA / APA Corporation | 10.94 | -11.80 | 200.12 | -23.25 | 4.0066 | -0.4634 | |||
| TGT / Target Corporation | 1.97 | 20.44 | 194.65 | 13.85 | 3.8971 | 0.9662 | |||
| JPM / JPMorgan Chase & Co. | 0.65 | -34.36 | 187.86 | -22.42 | 3.7613 | -0.3898 | |||
| BAC / Bank of America Corporation | 3.65 | -35.54 | 172.66 | -26.90 | 3.4569 | -0.5924 | |||
| OXY / Occidental Petroleum Corporation | 4.07 | -31.43 | 171.05 | -41.64 | 3.4247 | -1.5998 | |||
| COP / ConocoPhillips | 1.89 | -11.78 | 169.38 | -24.61 | 3.3912 | -0.4604 | |||
| OVV / Ovintiv Inc. | 4.36 | -28.00 | 165.73 | -35.99 | 3.3181 | -1.1205 | |||
| UHALB / U-Haul Holding Company - Series N | 2.84 | 18.38 | 154.54 | 8.76 | 3.0941 | 0.6582 | |||
| HD / The Home Depot, Inc. | 0.41 | -11.74 | 148.96 | -11.71 | 2.9823 | 0.0902 | |||
| FANG / Diamondback Energy, Inc. | 1.05 | 144.78 | 2.8986 | 2.8986 | |||||
| QCOM / QUALCOMM Incorporated | 0.72 | 17.71 | 114.93 | 22.04 | 2.3012 | 0.6867 | |||
| WAL / Western Alliance Bancorporation | 1.44 | 19.20 | 111.92 | 20.98 | 2.2408 | 0.6549 | |||
| CACC / Credit Acceptance Corporation | 0.22 | 16.96 | 110.45 | 15.39 | 2.2114 | 0.5705 | |||
| UNH / UnitedHealth Group Incorporated | 0.25 | 78.75 | 1.5767 | 1.5767 | |||||
| ULTA / Ulta Beauty, Inc. | 0.17 | -11.76 | 77.26 | 12.62 | 1.5469 | 0.3709 | |||
| DVN / Devon Energy Corporation | 2.40 | -57.93 | 76.37 | -64.22 | 1.5289 | -2.1296 | |||
| MTB / M&T Bank Corporation | 0.39 | -11.75 | 75.39 | -4.23 | 1.5094 | 0.1600 | |||
| FITB / Fifth Third Bancorp | 1.75 | -11.76 | 71.99 | -7.41 | 1.4414 | 0.1085 | |||
| FRO / Frontline plc | 0.59 | -13.84 | 9.75 | -2.65 | 0.1953 | 0.0235 | |||
| WFG / West Fraser Timber Co. Ltd. | 0.12 | -0.47 | 8.83 | -4.94 | 0.1769 | 0.0176 | |||
| OXY.WS / Occidental Petroleum Corporation - Equity Warrant | 0.15 | -0.47 | 3.19 | -25.51 | 0.0638 | -0.0095 | |||
| IWD / iShares Trust - iShares Russell 1000 Value ETF | 0.00 | -45.71 | 0.68 | -43.93 | 0.0136 | -0.0072 | |||
| VTV / Vanguard Index Funds - Vanguard Value ETF | 0.00 | 0.27 | 0.0054 | 0.0054 | |||||
| BRK.B / Berkshire Hathaway Inc. | 0.00 | -100.00 | 0.00 | -100.00 | -1.7261 | ||||
| UHAL / U-Haul Holding Company | 0.00 | -100.00 | 0.00 | 0.0000 | |||||
| MRP / Millrose Properties, Inc. | 0.00 | -100.00 | 0.00 | 0.0000 | |||||
| SIRI / Sirius XM Holdings Inc. | 0.00 | -100.00 | 0.00 | 0.0000 |