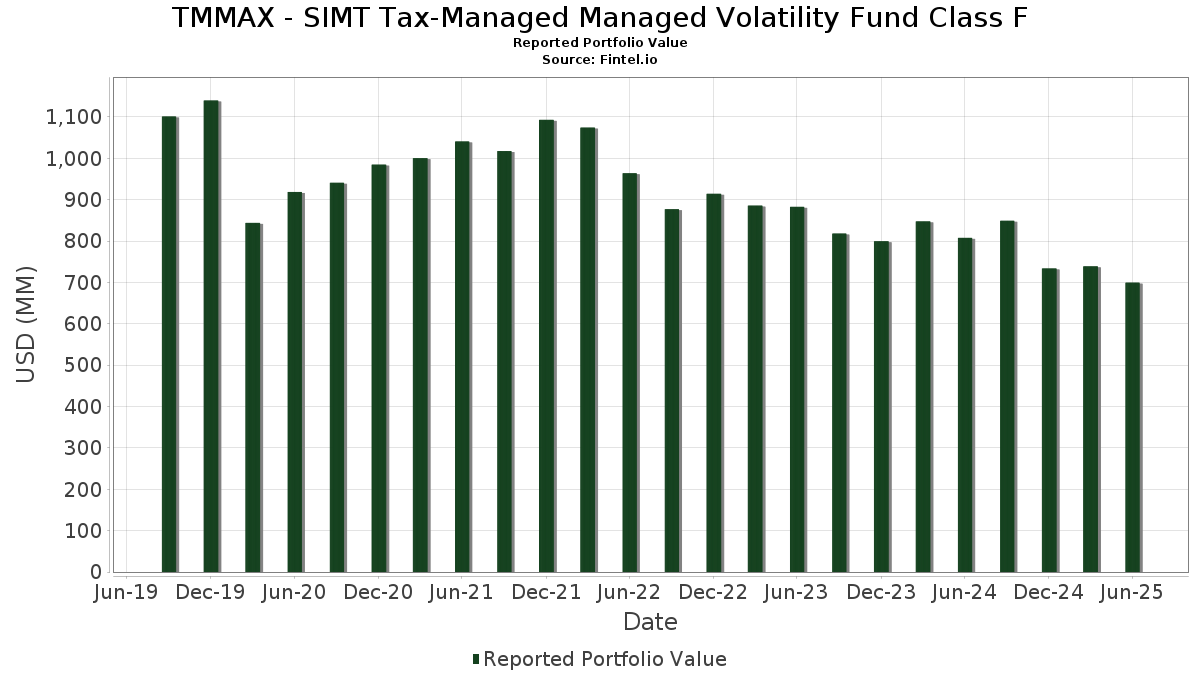
Basic Stats
| Portfolio Value | $ 699,241,715 |
| Current Positions | 179 |
Latest Holdings, Performance, AUM (from 13F, 13D)
TMMAX - SIMT Tax-Managed Managed Volatility Fund Class F has disclosed 179 total holdings in their latest SEC filings. Most recent portfolio value is calculated to be $ 699,241,715 USD. Actual Assets Under Management (AUM) is this value plus cash (which is not disclosed). TMMAX - SIMT Tax-Managed Managed Volatility Fund Class F’s top holdings are Microsoft Corporation (US:MSFT) , Cisco Systems, Inc. (US:CSCO) , AT&T Inc. (US:T) , Oracle Corporation (US:ORCL) , and Waste Management, Inc. (US:WM) . TMMAX - SIMT Tax-Managed Managed Volatility Fund Class F’s new positions include Adobe Inc. (US:ADBE) , Roper Technologies, Inc. (US:ROP) , Visa Inc. (US:V) , Mastercard Incorporated (US:MA) , and Cintas Corporation (US:CTAS) .
Top Increases This Quarter
We use the change in the portfolio allocation because this is the most meaningful metric. Changes can be due to trades or changes in share prices.
| Security | Shares (MM) |
Value (MM$) |
Portfolio % | ΔPortfolio % |
|---|---|---|---|---|
| 0.04 | 10.12 | 1.4542 | 1.3143 | |
| 0.20 | 14.03 | 2.0162 | 1.0650 | |
| 0.02 | 6.95 | 0.9992 | 0.9992 | |
| 0.01 | 6.84 | 0.9830 | 0.9830 | |
| 0.01 | 5.14 | 0.7382 | 0.7382 | |
| 0.06 | 12.77 | 1.8354 | 0.6825 | |
| 0.03 | 15.57 | 2.2377 | 0.6393 | |
| 0.04 | 7.08 | 1.0178 | 0.5947 | |
| 0.01 | 3.95 | 0.5682 | 0.5682 | |
| 3.75 | 0.5391 | 0.5391 |
Top Decreases This Quarter
We use the change in the portfolio allocation because this is the most meaningful metric. Changes can be due to trades or changes in share prices.
| Security | Shares (MM) |
Value (MM$) |
Portfolio % | ΔPortfolio % |
|---|---|---|---|---|
| 0.01 | 6.31 | 0.9060 | -0.8973 | |
| 0.04 | 10.28 | 1.4773 | -0.8557 | |
| 0.03 | 4.65 | 0.6677 | -0.8516 | |
| 0.00 | 3.60 | 0.5175 | -0.7831 | |
| 0.01 | 0.95 | 0.1358 | -0.7218 | |
| 0.02 | 1.42 | 0.2040 | -0.6031 | |
| 0.05 | 2.32 | 0.3340 | -0.5368 | |
| 0.02 | 7.21 | 1.0357 | -0.4372 | |
| 0.00 | 11.29 | 1.6225 | -0.4312 | |
| 0.01 | 0.58 | 0.0840 | -0.4183 |
13F and Fund Filings
This form was filed on 2025-08-28 for the reporting period 2025-06-30. Click the link icon to see the full transaction history.
Upgrade to unlock premium data and export to Excel ![]() .
.
| Security | Type | Avg Share Price | Shares (MM) |
ΔShares (%) |
ΔShares (%) |
Value ($MM) |
Portfolio (%) |
ΔPortfolio (%) |
|
|---|---|---|---|---|---|---|---|---|---|
| MSFT / Microsoft Corporation | 0.03 | 0.00 | 15.57 | 32.50 | 2.2377 | 0.6393 | |||
| CSCO / Cisco Systems, Inc. | 0.20 | 78.43 | 14.03 | 100.60 | 2.0162 | 1.0650 | |||
| T / AT&T Inc. | 0.48 | 0.00 | 13.81 | 2.33 | 1.9843 | 0.1491 | |||
| ORCL / Oracle Corporation | 0.06 | -3.64 | 12.77 | 50.69 | 1.8354 | 0.6825 | |||
| WM / Waste Management, Inc. | 0.05 | -9.44 | 12.39 | -10.49 | 1.7796 | -0.1021 | |||
| US7839655930 / SEI DAILY INCOME TRUST GOVERNMENT FUND (#36) | 12.27 | -16.47 | 12.27 | -16.46 | 1.7633 | -0.2345 | |||
| VZ / Verizon Communications Inc. | 0.28 | 0.00 | 11.99 | -4.61 | 1.7227 | 0.0135 | |||
| WMT / Walmart Inc. | 0.12 | -10.72 | 11.88 | -0.55 | 1.7068 | 0.0824 | |||
| DOX / Amdocs Limited | 0.13 | 11.84 | 11.63 | 11.53 | 1.6706 | 0.2529 | |||
| AZO / AutoZone, Inc. | 0.00 | -23.20 | 11.29 | -25.23 | 1.6225 | -0.4312 | |||
| AFL / Aflac Incorporated | 0.10 | -13.16 | 10.33 | -17.64 | 1.4844 | -0.2212 | |||
| PGR / The Progressive Corporation | 0.04 | -36.44 | 10.28 | -40.07 | 1.4773 | -0.8557 | |||
| VRSN / VeriSign, Inc. | 0.04 | 764.69 | 10.12 | 884.53 | 1.4542 | 1.3143 | |||
| ELV / Elevance Health, Inc. | 0.02 | -17.63 | 9.66 | -26.34 | 1.3874 | -0.3953 | |||
| COST / Costco Wholesale Corporation | 0.01 | 0.00 | 9.65 | 4.66 | 1.3865 | 0.1328 | |||
| SNPS / Synopsys, Inc. | 0.02 | 0.00 | 9.57 | 19.54 | 1.3756 | 0.2865 | |||
| MO / Altria Group, Inc. | 0.16 | 39.73 | 9.52 | 36.50 | 1.3676 | 0.4193 | |||
| MSI / Motorola Solutions, Inc. | 0.02 | 0.00 | 9.31 | -3.96 | 1.3371 | 0.0194 | |||
| AAPL / Apple Inc. | 0.04 | 0.00 | 9.06 | -7.64 | 1.3020 | -0.0321 | |||
| ABBV / AbbVie Inc. | 0.05 | 0.00 | 9.06 | -11.40 | 1.3015 | -0.0889 | |||
| ALL / The Allstate Corporation | 0.04 | -1.77 | 8.09 | -4.51 | 1.1620 | 0.0103 | |||
| IBM / International Business Machines Corporation | 0.03 | 35.45 | 7.89 | 60.57 | 1.1340 | 0.4656 | |||
| FOXA / Fox Corporation | 0.14 | 0.00 | 7.66 | -1.00 | 1.1004 | 0.0485 | |||
| COR / Cencora, Inc. | 0.03 | 1.43 | 7.65 | 9.37 | 1.0988 | 0.1479 | |||
| PEP / PepsiCo, Inc. | 0.05 | 0.00 | 7.25 | -11.93 | 1.0413 | -0.0778 | |||
| EG / Everest Group, Ltd. | 0.02 | -28.85 | 7.21 | -33.44 | 1.0357 | -0.4372 | |||
| KR / The Kroger Co. | 0.10 | -23.08 | 7.14 | -18.49 | 1.0266 | -0.1655 | |||
| CAH / Cardinal Health, Inc. | 0.04 | 86.72 | 7.08 | 127.68 | 1.0178 | 0.5947 | |||
| MCD / McDonald's Corporation | 0.02 | -0.66 | 6.97 | -7.08 | 1.0016 | -0.0187 | |||
| ADBE / Adobe Inc. | 0.02 | 6.95 | 0.9992 | 0.9992 | |||||
| ROP / Roper Technologies, Inc. | 0.01 | 6.84 | 0.9830 | 0.9830 | |||||
| CBOE / Cboe Global Markets, Inc. | 0.03 | -22.16 | 6.78 | -19.78 | 0.9744 | -0.1752 | |||
| MCK / McKesson Corporation | 0.01 | 0.00 | 6.56 | 8.89 | 0.9430 | 0.1233 | |||
| CHD / Church & Dwight Co., Inc. | 0.07 | 0.00 | 6.49 | -12.69 | 0.9321 | -0.0784 | |||
| GILD / Gilead Sciences, Inc. | 0.06 | 44.94 | 6.43 | 43.40 | 0.9240 | 0.3142 | |||
| NFG / National Fuel Gas Company | 0.07 | -31.23 | 6.32 | -26.44 | 0.9084 | -0.2604 | |||
| NOC / Northrop Grumman Corporation | 0.01 | -51.31 | 6.31 | -52.45 | 0.9060 | -0.8973 | |||
| TMUS / T-Mobile US, Inc. | 0.02 | -2.75 | 5.91 | -13.12 | 0.8487 | -0.0759 | |||
| MRK / Merck & Co., Inc. | 0.07 | -6.70 | 5.61 | -17.73 | 0.8063 | -0.1212 | |||
| EXEL / Exelixis, Inc. | 0.13 | -21.37 | 5.55 | -6.14 | 0.7980 | -0.0067 | |||
| MKC / McCormick & Company, Incorporated | 0.07 | 0.00 | 5.45 | -7.89 | 0.7832 | -0.0215 | |||
| LMT / Lockheed Martin Corporation | 0.01 | -8.83 | 5.41 | -5.47 | 0.7768 | -0.0010 | |||
| TRV / The Travelers Companies, Inc. | 0.02 | 0.00 | 5.39 | 1.16 | 0.7743 | 0.0499 | |||
| HSY / The Hershey Company | 0.03 | 0.00 | 5.33 | -2.97 | 0.7661 | 0.0188 | |||
| TXRH / Texas Roadhouse, Inc. | 0.03 | -23.81 | 5.30 | -14.32 | 0.7621 | -0.0796 | |||
| WMB / The Williams Companies, Inc. | 0.08 | -13.11 | 5.26 | -8.68 | 0.7560 | -0.0275 | |||
| AVT / Avnet, Inc. | 0.10 | 2.20 | 5.24 | 12.80 | 0.7523 | 0.1211 | |||
| RSG / Republic Services, Inc. | 0.02 | 64.44 | 5.15 | 67.45 | 0.7407 | 0.3220 | |||
| V / Visa Inc. | 0.01 | 5.14 | 0.7382 | 0.7382 | |||||
| FFIV / F5, Inc. | 0.02 | -10.84 | 5.08 | -1.43 | 0.7304 | 0.0290 | |||
| NTAP / NetApp, Inc. | 0.05 | 2.85 | 5.07 | 24.77 | 0.7290 | 0.1759 | |||
| NYT / The New York Times Company | 0.09 | 0.00 | 5.05 | 12.88 | 0.7255 | 0.1171 | |||
| TAP / Molson Coors Beverage Company | 0.10 | -16.70 | 4.95 | -34.19 | 0.7109 | -0.3114 | |||
| INCY / Incyte Corporation | 0.07 | -29.23 | 4.87 | -20.40 | 0.6997 | -0.1323 | |||
| AMGN / Amgen Inc. | 0.02 | 0.00 | 4.69 | -10.39 | 0.6740 | -0.0378 | |||
| RTX / RTX Corporation | 0.03 | -62.27 | 4.65 | -58.41 | 0.6677 | -0.8516 | |||
| AVY / Avery Dennison Corporation | 0.03 | 0.00 | 4.61 | -1.41 | 0.6631 | 0.0266 | |||
| JNJ / Johnson & Johnson | 0.03 | 105.48 | 4.49 | 89.29 | 0.6449 | 0.3224 | |||
| KO / The Coca-Cola Company | 0.06 | 0.00 | 4.16 | -1.21 | 0.5982 | 0.0251 | |||
| TJX / The TJX Companies, Inc. | 0.03 | 476.65 | 4.10 | 485.16 | 0.5894 | 0.4940 | |||
| FHI / Federated Hermes, Inc. | 0.09 | -16.21 | 4.09 | -8.90 | 0.5880 | -0.0230 | |||
| UTHR / United Therapeutics Corporation | 0.01 | -18.95 | 4.09 | -24.45 | 0.5874 | -0.1485 | |||
| DBX / Dropbox, Inc. | 0.14 | 139.21 | 4.05 | 156.13 | 0.5823 | 0.3671 | |||
| CTSH / Cognizant Technology Solutions Corporation | 0.05 | -15.53 | 4.01 | -13.83 | 0.5764 | -0.0568 | |||
| CMI / Cummins Inc. | 0.01 | 51.81 | 3.98 | 58.64 | 0.5715 | 0.2305 | |||
| MA / Mastercard Incorporated | 0.01 | 3.95 | 0.5682 | 0.5682 | |||||
| ARW / Arrow Electronics, Inc. | 0.03 | 109.62 | 3.88 | 157.36 | 0.5576 | 0.3525 | |||
| BKNG / Booking Holdings Inc. | 0.00 | 282.86 | 3.88 | 381.14 | 0.5573 | 0.4477 | |||
| INGR / Ingredion Incorporated | 0.03 | 0.00 | 3.84 | 0.31 | 0.5523 | 0.0312 | |||
| PM / Philip Morris International Inc. | 0.02 | 320.22 | 3.83 | 382.47 | 0.5498 | 0.4419 | |||
| HMC / Honda Motor Co., Ltd. - Depositary Receipt (Common Stock) | 0.13 | -4.70 | 3.81 | 1.28 | 0.5473 | 0.0358 | |||
| KMB / Kimberly-Clark Corporation | 0.03 | 0.00 | 3.78 | -9.35 | 0.5435 | -0.0240 | |||
| S&P500 EMINI FUT SEP25 PHYSICAL INDEX FUTURE. / DE (N/A) | 3.75 | 0.5391 | 0.5391 | ||||||
| BRK.B / Berkshire Hathaway Inc. | 0.01 | 0.00 | 3.69 | -8.80 | 0.5304 | -0.0200 | |||
| FOX / Fox Corporation | 0.07 | -23.50 | 3.67 | -25.08 | 0.5276 | -0.1388 | |||
| LLY / Eli Lilly and Company | 0.00 | -60.10 | 3.60 | -62.35 | 0.5175 | -0.7831 | |||
| CCEP / Coca-Cola Europacific Partners PLC | 0.04 | -21.89 | 3.58 | -16.79 | 0.5140 | -0.0706 | |||
| ADP / Automatic Data Processing, Inc. | 0.01 | 0.00 | 3.53 | 0.94 | 0.5075 | 0.0316 | |||
| C / Citigroup Inc. | 0.04 | 317.84 | 3.37 | 401.19 | 0.4840 | 0.3926 | |||
| DTE / DTE Energy Company | 0.03 | -33.43 | 3.36 | -36.23 | 0.4827 | -0.2337 | |||
| CB / Chubb Limited | 0.01 | 0.00 | 3.18 | -4.08 | 0.4564 | 0.0061 | |||
| DUK / Duke Energy Corporation | 0.03 | 0.00 | 3.11 | -3.23 | 0.4472 | 0.0097 | |||
| SLGN / Silgan Holdings Inc. | 0.06 | 0.00 | 3.11 | 6.00 | 0.4467 | 0.0478 | |||
| GOOG / Alphabet Inc. | 0.02 | 249.90 | 3.10 | 297.31 | 0.4459 | 0.3397 | |||
| AZN / AstraZeneca PLC - Depositary Receipt (Common Stock) | 0.04 | -27.16 | 3.08 | -30.76 | 0.4432 | -0.1625 | |||
| GIS / General Mills, Inc. | 0.06 | 25.28 | 3.05 | 8.53 | 0.4388 | 0.0562 | |||
| WEC / WEC Energy Group, Inc. | 0.03 | 0.00 | 3.05 | -4.39 | 0.4379 | 0.0044 | |||
| CARR / Carrier Global Corporation | 0.04 | -1.63 | 3.01 | 13.55 | 0.4324 | 0.0720 | |||
| CL / Colgate-Palmolive Company | 0.03 | 0.00 | 3.00 | -2.98 | 0.4311 | 0.0105 | |||
| RNR / RenaissanceRe Holdings Ltd. | 0.01 | -48.11 | 2.99 | -47.48 | 0.4298 | -0.3448 | |||
| SEE / Sealed Air Corporation | 0.10 | 64.93 | 2.99 | 77.12 | 0.4294 | 0.1999 | |||
| HRB / H&R Block, Inc. | 0.05 | 7.15 | 2.90 | 7.10 | 0.4160 | 0.0484 | |||
| ETR / Entergy Corporation | 0.03 | 0.00 | 2.89 | -2.79 | 0.4156 | 0.0110 | |||
| CTAS / Cintas Corporation | 0.01 | 2.88 | 0.4134 | 0.4134 | |||||
| MAT / Mattel, Inc. | 0.14 | 60.98 | 2.82 | 63.38 | 0.4053 | 0.1705 | |||
| EME / EMCOR Group, Inc. | 0.01 | -60.74 | 2.81 | -43.18 | 0.4035 | -0.2687 | |||
| NEU / NewMarket Corporation | 0.00 | 0.00 | 2.75 | 21.99 | 0.3946 | 0.0884 | |||
| SNX / TD SYNNEX Corporation | 0.02 | 174.86 | 2.74 | 258.92 | 0.3930 | 0.2893 | |||
| LHX / L3Harris Technologies, Inc. | 0.01 | -51.81 | 2.73 | -42.26 | 0.3925 | -0.2508 | |||
| LYB / LyondellBasell Industries N.V. | 0.05 | 391.83 | 2.73 | 304.30 | 0.3922 | 0.3004 | |||
| GD / General Dynamics Corporation | 0.01 | 0.00 | 2.68 | 7.02 | 0.3855 | 0.0445 | |||
| SYK / Stryker Corporation | 0.01 | 2.67 | 0.3834 | 0.3834 | |||||
| CVS / CVS Health Corporation | 0.04 | 8.88 | 2.57 | 10.86 | 0.3698 | 0.0541 | |||
| DRI / Darden Restaurants, Inc. | 0.01 | -54.36 | 2.57 | -52.11 | 0.3695 | -0.3608 | |||
| MTRAF / Metro Inc. | 0.03 | -11.16 | 2.56 | 0.16 | 0.3682 | 0.0203 | |||
| EBAY / eBay Inc. | 0.03 | 0.00 | 2.55 | 9.92 | 0.3664 | 0.0510 | |||
| META / Meta Platforms, Inc. | 0.00 | 2.49 | 0.3582 | 0.3582 | |||||
| BK / The Bank of New York Mellon Corporation | 0.03 | 52.28 | 2.41 | 65.52 | 0.3463 | 0.1482 | |||
| AEP / American Electric Power Company, Inc. | 0.02 | 0.00 | 2.40 | -5.07 | 0.3444 | 0.0011 | |||
| DCI / Donaldson Company, Inc. | 0.03 | -18.99 | 2.35 | -16.21 | 0.3371 | -0.0437 | |||
| BMY / Bristol-Myers Squibb Company | 0.05 | -52.17 | 2.32 | -63.70 | 0.3340 | -0.5368 | |||
| PEG / Public Service Enterprise Group Incorporated | 0.03 | 0.00 | 2.31 | 2.26 | 0.3314 | 0.0247 | |||
| CHRW / C.H. Robinson Worldwide, Inc. | 0.02 | 0.00 | 2.25 | -6.30 | 0.3226 | -0.0033 | |||
| AFG / American Financial Group, Inc. | 0.02 | 0.00 | 2.23 | -3.92 | 0.3210 | 0.0048 | |||
| DLB / Dolby Laboratories, Inc. | 0.03 | 2.12 | 0.3045 | 0.3045 | |||||
| MSGS / Madison Square Garden Sports Corp. | 0.01 | -4.86 | 2.12 | 2.07 | 0.3042 | 0.0222 | |||
| AEE / Ameren Corporation | 0.02 | 0.00 | 2.09 | -4.34 | 0.3008 | 0.0032 | |||
| NBIX / Neurocrine Biosciences, Inc. | 0.02 | -2.79 | 2.04 | 10.47 | 0.2927 | 0.0419 | |||
| JKHY / Jack Henry & Associates, Inc. | 0.01 | 0.00 | 1.97 | -1.35 | 0.2832 | 0.0115 | |||
| SKM / SK Telecom Co., Ltd. - Depositary Receipt (Common Stock) | 0.08 | -26.68 | 1.94 | -19.47 | 0.2782 | -0.0488 | |||
| PG / The Procter & Gamble Company | 0.01 | 62.63 | 1.82 | 52.04 | 0.2620 | 0.0989 | |||
| ELS / Equity LifeStyle Properties, Inc. | 0.03 | 0.00 | 1.81 | -7.55 | 0.2604 | -0.0062 | |||
| SO / The Southern Company | 0.02 | 0.00 | 1.77 | -0.17 | 0.2547 | 0.0133 | |||
| NTIOF / National Bank of Canada | 0.02 | -32.52 | 1.76 | -15.76 | 0.2526 | -0.0313 | |||
| CFR / Cullen/Frost Bankers, Inc. | 0.01 | -12.08 | 1.70 | -9.71 | 0.2445 | -0.0119 | |||
| MUSA / Murphy USA Inc. | 0.00 | -35.24 | 1.66 | -43.93 | 0.2385 | -0.1640 | |||
| XOM / Exxon Mobil Corporation | 0.02 | -27.04 | 1.65 | -33.88 | 0.2373 | -0.1023 | |||
| POR / Portland General Electric Company | 0.04 | 0.00 | 1.61 | -8.95 | 0.2312 | -0.0090 | |||
| LSTR / Landstar System, Inc. | 0.01 | 0.00 | 1.59 | -7.47 | 0.2280 | -0.0051 | |||
| IT / Gartner, Inc. | 0.00 | 139.03 | 1.58 | 130.13 | 0.2273 | 0.1338 | |||
| CMCSA / Comcast Corporation | 0.04 | -30.94 | 1.52 | -33.22 | 0.2182 | -0.0910 | |||
| TM / Toyota Motor Corporation - Depositary Receipt (Common Stock) | 0.01 | -36.36 | 1.50 | -37.92 | 0.2158 | -0.1131 | |||
| OTEX / Open Text Corporation | 0.05 | 289.47 | 1.50 | 351.20 | 0.2153 | 0.1701 | |||
| LOPE / Grand Canyon Education, Inc. | 0.01 | 0.00 | 1.44 | 9.26 | 0.2069 | 0.0276 | |||
| K / Kellanova | 0.02 | -75.19 | 1.42 | -76.09 | 0.2040 | -0.6031 | |||
| CASY / Casey's General Stores, Inc. | 0.00 | 0.00 | 1.35 | 17.64 | 0.1946 | 0.0379 | |||
| GOOGL / Alphabet Inc. | 0.01 | 49.98 | 1.32 | 69.14 | 0.1899 | 0.1899 | |||
| YELP / Yelp Inc. | 0.04 | 1.30 | 0.1861 | 0.1861 | |||||
| MPC / Marathon Petroleum Corporation | 0.01 | -39.53 | 1.29 | -31.07 | 0.1853 | -0.0691 | |||
| VEEV / Veeva Systems Inc. | 0.00 | 1.27 | 0.1830 | 0.1830 | |||||
| EA / Electronic Arts Inc. | 0.01 | 1.25 | 0.1801 | 0.1801 | |||||
| RGLD / Royal Gold, Inc. | 0.01 | -40.38 | 1.22 | -35.17 | 0.1759 | -0.0808 | |||
| CPB / The Campbell's Company | 0.04 | -48.35 | 1.21 | -60.36 | 0.1744 | -0.2418 | |||
| NEE / NextEra Energy, Inc. | 0.02 | 0.00 | 1.15 | -2.04 | 0.1653 | 0.0055 | |||
| TSN / Tyson Foods, Inc. | 0.02 | -3.92 | 1.13 | -15.79 | 0.1626 | -0.0201 | |||
| SHEL / Shell plc - Depositary Receipt (Common Stock) | 0.02 | 0.00 | 1.11 | -3.88 | 0.1601 | 0.0024 | |||
| CI / The Cigna Group | 0.00 | 0.00 | 1.08 | 0.46 | 0.1557 | 0.0090 | |||
| CHE / Chemed Corporation | 0.00 | -35.60 | 1.07 | -49.05 | 0.1536 | -0.1317 | |||
| EHC / Encompass Health Corporation | 0.01 | 1.03 | 0.1481 | 0.1481 | |||||
| GRMN / Garmin Ltd. | 0.00 | 952.19 | 1.00 | 911.11 | 0.1439 | 0.1304 | |||
| PFE / Pfizer Inc. | 0.04 | 74.18 | 1.00 | 66.67 | 0.1437 | 0.0621 | |||
| ATR / AptarGroup, Inc. | 0.01 | 0.00 | 0.98 | 5.38 | 0.1407 | 0.0144 | |||
| JAZZ / Jazz Pharmaceuticals plc | 0.01 | 12.00 | 0.96 | -4.28 | 0.1383 | 0.0016 | |||
| UNM / Unum Group | 0.01 | -84.88 | 0.95 | -85.01 | 0.1358 | -0.7218 | |||
| ZTS / Zoetis Inc. | 0.01 | -50.05 | 0.92 | -54.68 | 0.1321 | -0.0807 | |||
| SPOT / Spotify Technology S.A. | 0.00 | -67.00 | 0.88 | -53.97 | 0.1259 | -0.1330 | |||
| ABT / Abbott Laboratories | 0.01 | 0.84 | 0.1204 | 0.1204 | |||||
| CARG / CarGurus, Inc. | 0.02 | 0.82 | 0.1185 | 0.1185 | |||||
| BCO / The Brink's Company | 0.01 | 0.00 | 0.80 | 3.63 | 0.1150 | 0.0100 | |||
| DTM / DT Midstream, Inc. | 0.01 | 0.00 | 0.79 | 13.98 | 0.1137 | 0.0192 | |||
| TTE / TotalEnergies SE - Depositary Receipt (Common Stock) | 0.01 | 0.00 | 0.76 | -5.09 | 0.1099 | 0.0003 | |||
| PTC / PTC Inc. | 0.00 | 0.66 | 0.0943 | 0.0943 | |||||
| HIG / The Hartford Insurance Group, Inc. | 0.01 | 0.64 | 0.0921 | 0.0921 | |||||
| AMZN / Amazon.com, Inc. | 0.00 | -22.48 | 0.64 | 50.71 | 0.0919 | 0.0428 | |||
| ALSN / Allison Transmission Holdings, Inc. | 0.01 | -84.07 | 0.58 | -84.19 | 0.0840 | -0.4183 | |||
| BMRN / BioMarin Pharmaceutical Inc. | 0.01 | 0.55 | 0.0784 | 0.0784 | |||||
| GEN / Gen Digital Inc. | 0.02 | -77.07 | 0.51 | -74.64 | 0.0731 | -0.1993 | |||
| SON / Sonoco Products Company | 0.01 | -79.71 | 0.41 | -81.33 | 0.0595 | -0.2414 | |||
| IDCC / InterDigital, Inc. | 0.00 | 0.38 | 0.0546 | 0.0546 | |||||
| RHI / Robert Half Inc. | 0.01 | 0.37 | 0.0525 | 0.0525 | |||||
| DT / Dynatrace, Inc. | 0.00 | 0.28 | 0.0395 | 0.0395 | |||||
| KHC / The Kraft Heinz Company | 0.01 | -41.07 | 0.24 | -50.10 | 0.0347 | -0.0310 | |||
| CSGS / CSG Systems International, Inc. | 0.00 | 0.12 | 0.0170 | 0.0170 | |||||
| BOX / Box, Inc. | 0.00 | 0.11 | 0.0152 | 0.0152 | |||||
| ORI / Old Republic International Corporation | 0.00 | 0.10 | 0.0145 | 0.0145 | |||||
| ROL / Rollins, Inc. | 0.00 | 0.00 | 0.10 | 5.38 | 0.0141 | 0.0013 | |||
| CPNG / Coupang, Inc. | 0.00 | 0.00 | 0.06 | 37.50 | 0.0080 | 0.0024 | |||
| ADM / Archer-Daniels-Midland Company | 0.00 | -98.12 | 0.03 | -97.98 | 0.0043 | -0.1913 | |||
| CVX / Chevron Corporation | 0.00 | -97.57 | 0.03 | -97.96 | 0.0037 | -0.1628 |