Basic Stats
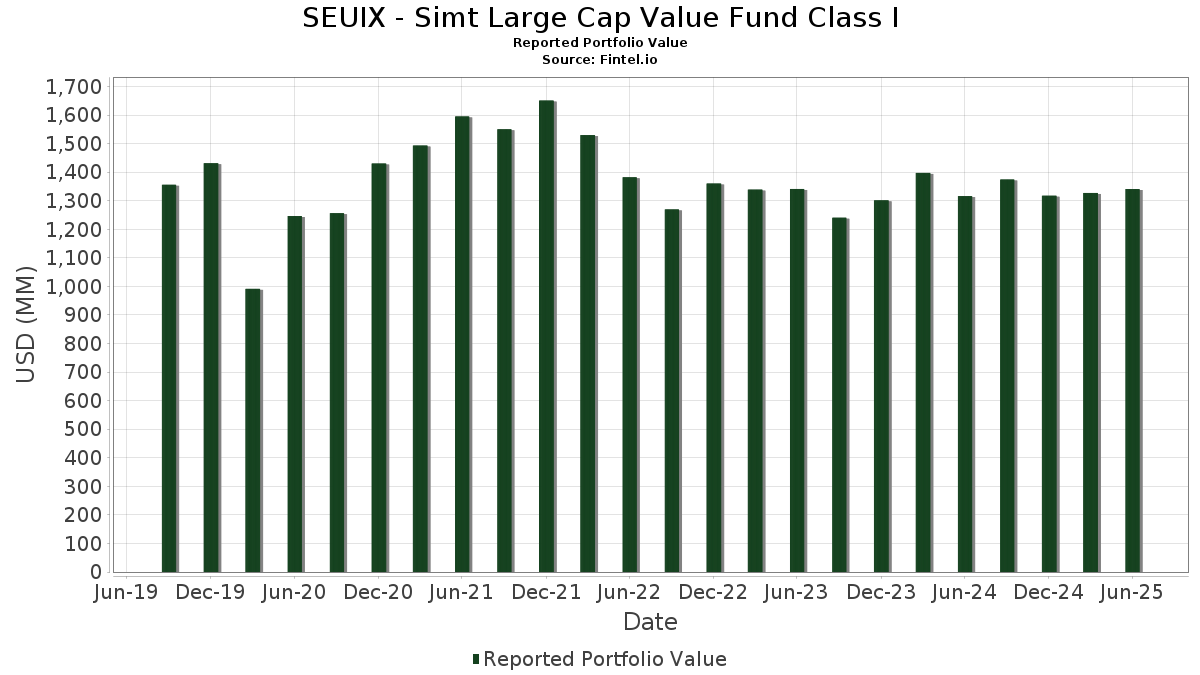
| Portfolio Value | $ 1,341,049,700 |
| Current Positions | 234 |
Latest Holdings, Performance, AUM (from 13F, 13D)
SEUIX - Simt Large Cap Value Fund Class I has disclosed 234 total holdings in their latest SEC filings. Most recent portfolio value is calculated to be $ 1,341,049,700 USD. Actual Assets Under Management (AUM) is this value plus cash (which is not disclosed). SEUIX - Simt Large Cap Value Fund Class I’s top holdings are AT&T Inc. (US:T) , Citigroup Inc. (US:C) , Comcast Corporation (US:CMCSA) , The Kroger Co. (US:KR) , and Wells Fargo & Company (US:WFC) . SEUIX - Simt Large Cap Value Fund Class I’s new positions include CF Industries Holdings, Inc. (US:CF) , Abercrombie & Fitch Co. (US:ANF) , Regal Rexnord Corporation (US:RRX) , National Fuel Gas Company (US:NFG) , and F5, Inc. (US:FFIV) .
Top Increases This Quarter
We use the change in the portfolio allocation because this is the most meaningful metric. Changes can be due to trades or changes in share prices.
| Security | Shares (MM) |
Value (MM$) |
Portfolio % | ΔPortfolio % |
|---|---|---|---|---|
| 0.84 | 20.30 | 1.5212 | 0.5054 | |
| 0.47 | 39.94 | 2.9928 | 0.4617 | |
| 0.04 | 6.39 | 0.4791 | 0.4421 | |
| 0.08 | 9.12 | 0.6836 | 0.4362 | |
| 0.08 | 5.94 | 0.4451 | 0.4180 | |
| 0.05 | 6.99 | 0.5238 | 0.4047 | |
| 0.11 | 14.75 | 1.1052 | 0.3920 | |
| 0.09 | 6.92 | 0.5182 | 0.3824 | |
| 0.07 | 7.03 | 0.5265 | 0.3748 | |
| 4.69 | 0.3515 | 0.3515 |
Top Decreases This Quarter
We use the change in the portfolio allocation because this is the most meaningful metric. Changes can be due to trades or changes in share prices.
| Security | Shares (MM) |
Value (MM$) |
Portfolio % | ΔPortfolio % |
|---|---|---|---|---|
| 0.09 | 13.86 | 1.0383 | -0.8215 | |
| 0.06 | 10.93 | 0.8187 | -0.6340 | |
| 0.03 | 9.22 | 0.6912 | -0.6152 | |
| 0.05 | 6.62 | 0.4959 | -0.5761 | |
| 0.08 | 11.89 | 0.8906 | -0.5594 | |
| 0.29 | 6.13 | 0.4596 | -0.5158 | |
| 0.13 | 12.05 | 0.9032 | -0.4973 | |
| 0.06 | 17.78 | 1.3322 | -0.4961 | |
| 0.08 | 9.18 | 0.6878 | -0.4467 | |
| 0.20 | 5.39 | 0.4035 | -0.4261 |
13F and Fund Filings
This form was filed on 2025-08-28 for the reporting period 2025-06-30. Click the link icon to see the full transaction history.
Upgrade to unlock premium data and export to Excel ![]() .
.
| Security | Type | Avg Share Price | Shares (MM) |
ΔShares (%) |
ΔShares (%) |
Value ($MM) |
Portfolio (%) |
ΔPortfolio (%) |
|
|---|---|---|---|---|---|---|---|---|---|
| T / AT&T Inc. | 1.53 | 0.00 | 44.21 | 2.33 | 3.3126 | 0.0301 | |||
| C / Citigroup Inc. | 0.47 | 0.00 | 39.94 | 19.90 | 2.9928 | 0.4617 | |||
| CMCSA / Comcast Corporation | 0.77 | 13.14 | 27.34 | 9.43 | 2.0490 | 0.1503 | |||
| KR / The Kroger Co. | 0.36 | -0.19 | 25.89 | 5.77 | 1.9403 | 0.0801 | |||
| WFC / Wells Fargo & Company | 0.30 | 11.34 | 24.43 | 24.26 | 1.8307 | 0.3367 | |||
| XOM / Exxon Mobil Corporation | 0.22 | -4.30 | 24.12 | -13.26 | 1.8077 | -0.3056 | |||
| PFE / Pfizer Inc. | 0.84 | 58.75 | 20.30 | 51.86 | 1.5212 | 0.5054 | |||
| BAC / Bank of America Corporation | 0.43 | -24.30 | 20.19 | -14.16 | 1.5131 | -0.2744 | |||
| BK / The Bank of New York Mellon Corporation | 0.21 | 15.26 | 19.10 | 25.20 | 1.4312 | 0.2721 | |||
| GM / General Motors Company | 0.37 | 0.97 | 18.35 | 5.65 | 1.3750 | 0.0553 | |||
| JPM / JPMorgan Chase & Co. | 0.06 | -37.48 | 17.78 | -26.11 | 1.3322 | -0.4961 | |||
| GILD / Gilead Sciences, Inc. | 0.15 | 28.47 | 16.68 | 27.12 | 1.2498 | 0.2528 | |||
| CVS / CVS Health Corporation | 0.24 | -10.85 | 16.53 | -9.23 | 1.2383 | -0.1450 | |||
| CSCO / Cisco Systems, Inc. | 0.23 | -26.78 | 15.63 | -17.68 | 1.1714 | -0.2717 | |||
| VLO / Valero Energy Corporation | 0.11 | 54.40 | 14.75 | 57.16 | 1.1052 | 0.3920 | |||
| GPN / Global Payments Inc. | 0.18 | 70.59 | 14.61 | 39.43 | 1.0946 | 0.2986 | |||
| JNJ / Johnson & Johnson | 0.09 | -38.53 | 13.86 | -43.39 | 1.0383 | -0.8215 | |||
| US7839655930 / SEI DAILY INCOME TRUST GOVERNMENT FUND (#36) | 12.76 | -26.13 | 12.76 | -26.13 | 0.9558 | -0.3562 | |||
| DAL / Delta Air Lines, Inc. | 0.26 | 15.53 | 12.63 | 30.32 | 0.9467 | 0.2100 | |||
| CAH / Cardinal Health, Inc. | 0.07 | 26.20 | 12.22 | 53.88 | 0.9154 | 0.3122 | |||
| COP / ConocoPhillips | 0.13 | -23.47 | 12.05 | -34.60 | 0.9032 | -0.4973 | |||
| RTX / RTX Corporation | 0.08 | -43.50 | 11.89 | -37.72 | 0.8906 | -0.5594 | |||
| MET / MetLife, Inc. | 0.14 | 61.12 | 11.54 | 61.40 | 0.8644 | 0.3213 | |||
| TGT / Target Corporation | 0.12 | 6.16 | 11.50 | 0.35 | 0.8616 | -0.0091 | |||
| EBAY / eBay Inc. | 0.15 | 39.16 | 11.34 | 53.00 | 0.8494 | 0.2864 | |||
| NRG / NRG Energy, Inc. | 0.07 | -42.33 | 11.14 | -2.99 | 0.8350 | -0.0379 | |||
| PM / Philip Morris International Inc. | 0.06 | -50.19 | 10.93 | -42.85 | 0.8187 | -0.6340 | |||
| MDT / Medtronic plc | 0.12 | -29.84 | 10.89 | -31.95 | 0.8161 | -0.3999 | |||
| JCI / Johnson Controls International plc | 0.10 | -45.11 | 10.47 | -27.63 | 0.7845 | -0.3149 | |||
| AVGO / Broadcom Inc. | 0.04 | -39.01 | 10.36 | 0.42 | 0.7761 | -0.0076 | |||
| HPE / Hewlett Packard Enterprise Company | 0.50 | 32.91 | 10.16 | 76.15 | 0.7610 | 0.3229 | |||
| QCOM / QUALCOMM Incorporated | 0.06 | -12.57 | 10.14 | -9.35 | 0.7595 | -0.0901 | |||
| GD / General Dynamics Corporation | 0.03 | -39.87 | 9.81 | -35.66 | 0.7348 | -0.4233 | |||
| JBL / Jabil Inc. | 0.04 | 10.85 | 9.79 | 77.68 | 0.7338 | 0.3150 | |||
| MPC / Marathon Petroleum Corporation | 0.06 | 47.59 | 9.41 | 68.28 | 0.7049 | 0.2801 | |||
| MS / Morgan Stanley | 0.07 | -44.10 | 9.31 | -32.50 | 0.6972 | -0.3503 | |||
| CB / Chubb Limited | 0.03 | -44.08 | 9.22 | -46.35 | 0.6912 | -0.6152 | |||
| DG / Dollar General Corporation | 0.08 | 0.00 | 9.19 | 30.08 | 0.6890 | 0.1519 | |||
| DUK / Duke Energy Corporation | 0.08 | -36.45 | 9.18 | -38.52 | 0.6878 | -0.4467 | |||
| MRK / Merck & Co., Inc. | 0.12 | -24.74 | 9.17 | -33.62 | 0.6870 | -0.3626 | |||
| ADM / Archer-Daniels-Midland Company | 0.17 | 32.56 | 9.16 | 45.75 | 0.6863 | 0.2088 | |||
| SYF / Synchrony Financial | 0.14 | 1.55 | 9.14 | 28.02 | 0.6851 | 0.1424 | |||
| MCK / McKesson Corporation | 0.01 | 31.00 | 9.13 | 42.65 | 0.6842 | 0.1978 | |||
| PRU / Prudential Financial, Inc. | 0.08 | 191.31 | 9.12 | 180.25 | 0.6836 | 0.4362 | |||
| AER / AerCap Holdings N.V. | 0.08 | 0.00 | 8.87 | 14.52 | 0.6644 | 0.0761 | |||
| MO / Altria Group, Inc. | 0.15 | -31.09 | 8.61 | -32.69 | 0.6455 | -0.3269 | |||
| NEE / NextEra Energy, Inc. | 0.12 | -29.64 | 8.54 | -31.11 | 0.6403 | -0.3021 | |||
| CNC / Centene Corporation | 0.15 | 42.09 | 8.32 | 27.05 | 0.6234 | 0.1258 | |||
| MSFT / Microsoft Corporation | 0.02 | -35.80 | 8.15 | -14.93 | 0.6104 | -0.1172 | |||
| BRK.B / Berkshire Hathaway Inc. | 0.02 | 117.04 | 7.64 | 97.98 | 0.5727 | 0.2793 | |||
| DOC / Healthpeak Properties, Inc. | 0.42 | -24.26 | 7.33 | -34.41 | 0.5490 | -0.2998 | |||
| FOXA / Fox Corporation | 0.13 | 0.00 | 7.32 | -0.99 | 0.5487 | -0.0133 | |||
| VICI / VICI Properties Inc. | 0.22 | -34.32 | 7.30 | -34.36 | 0.5468 | -0.2979 | |||
| SIEGY / Siemens Aktiengesellschaft - Depositary Receipt (Common Stock) | 0.06 | -23.20 | 7.22 | -14.21 | 0.5413 | -0.0986 | |||
| PCAR / PACCAR Inc | 0.07 | 260.47 | 7.03 | 252.00 | 0.5265 | 0.3748 | |||
| RJF / Raymond James Financial, Inc. | 0.05 | 303.86 | 6.99 | 346.08 | 0.5238 | 0.4047 | |||
| CTSH / Cognizant Technology Solutions Corporation | 0.09 | 279.30 | 6.92 | 286.96 | 0.5182 | 0.3824 | |||
| XEL / Xcel Energy Inc. | 0.10 | 187.52 | 6.80 | 176.64 | 0.5093 | 0.3226 | |||
| NVS / Novartis AG - Depositary Receipt (Common Stock) | 0.05 | -31.98 | 6.66 | -26.17 | 0.4987 | -0.1863 | |||
| CVX / Chevron Corporation | 0.05 | -45.19 | 6.62 | -53.09 | 0.4959 | -0.5761 | |||
| TSN / Tyson Foods, Inc. | 0.12 | 9.88 | 6.57 | -3.68 | 0.4921 | -0.0259 | |||
| FDX / FedEx Corporation | 0.03 | -21.67 | 6.48 | -26.96 | 0.4856 | -0.1886 | |||
| GPC / Genuine Parts Company | 0.05 | -33.78 | 6.48 | -32.58 | 0.4853 | -0.2446 | |||
| EXPE / Expedia Group, Inc. | 0.04 | 1,207.17 | 6.39 | 1,212.94 | 0.4791 | 0.4421 | |||
| TFC / Truist Financial Corporation | 0.15 | -28.48 | 6.39 | -25.29 | 0.4785 | -0.1709 | |||
| HPQ / HP Inc. | 0.26 | 1.65 | 6.32 | -10.20 | 0.4734 | -0.0612 | |||
| UL / Unilever PLC - Depositary Receipt (Common Stock) | 0.10 | -35.01 | 6.29 | -33.24 | 0.4713 | -0.2446 | |||
| KVUE / Kenvue Inc. | 0.29 | -45.26 | 6.13 | -52.22 | 0.4596 | -0.5158 | |||
| FMC / FMC Corporation | 0.15 | 10.56 | 6.13 | 9.40 | 0.4595 | 0.0336 | |||
| UGI / UGI Corporation | 0.17 | 31.89 | 6.01 | 45.25 | 0.4505 | 0.1360 | |||
| SRE / Sempra | 0.08 | 1,467.80 | 5.94 | 1,568.26 | 0.4451 | 0.4180 | |||
| CCK / Crown Holdings, Inc. | 0.06 | 21.37 | 5.86 | 40.04 | 0.4393 | 0.1212 | |||
| OMC / Omnicom Group Inc. | 0.08 | 20.13 | 5.84 | 4.23 | 0.4377 | 0.0119 | |||
| TXT / Textron Inc. | 0.07 | 21.70 | 5.83 | 35.24 | 0.4366 | 0.1092 | |||
| TRV / The Travelers Companies, Inc. | 0.02 | -42.88 | 5.79 | -42.22 | 0.4340 | -0.3277 | |||
| DOX / Amdocs Limited | 0.06 | 0.00 | 5.71 | -0.28 | 0.4277 | -0.0072 | |||
| SNA / Snap-on Incorporated | 0.02 | 0.00 | 5.63 | -7.66 | 0.4220 | -0.0414 | |||
| CCI / Crown Castle Inc. | 0.05 | -25.89 | 5.60 | -26.97 | 0.4193 | -0.1628 | |||
| INGR / Ingredion Incorporated | 0.04 | 0.00 | 5.56 | 0.31 | 0.4168 | -0.0046 | |||
| UPS / United Parcel Service, Inc. | 0.05 | -21.46 | 5.50 | -27.93 | 0.4119 | -0.1676 | |||
| DOW / Dow Inc. | 0.20 | -34.96 | 5.39 | -50.68 | 0.4035 | -0.4261 | |||
| UNM / Unum Group | 0.07 | 14.17 | 5.30 | 13.22 | 0.3974 | 0.0414 | |||
| HST / Host Hotels & Resorts, Inc. | 0.34 | 42.58 | 5.24 | 54.15 | 0.3925 | 0.1343 | |||
| VZ / Verizon Communications Inc. | 0.12 | -27.65 | 5.12 | -30.98 | 0.3837 | -0.1801 | |||
| JAZZ / Jazz Pharmaceuticals plc | 0.05 | -9.49 | 5.12 | -22.64 | 0.3834 | -0.1191 | |||
| STT / State Street Corporation | 0.05 | 0.00 | 5.05 | 18.76 | 0.3786 | 0.0554 | |||
| TROW / T. Rowe Price Group, Inc. | 0.05 | 591.83 | 5.04 | 627.42 | 0.3777 | 0.3250 | |||
| CI / The Cigna Group | 0.02 | 0.00 | 5.04 | 0.48 | 0.3775 | -0.0035 | |||
| UTHR / United Therapeutics Corporation | 0.02 | 27.09 | 5.01 | 18.46 | 0.3756 | 0.0541 | |||
| BCE / BCE Inc. | 0.22 | -6.30 | 4.99 | -9.52 | 0.3738 | -0.0452 | |||
| VOYA / Voya Financial, Inc. | 0.07 | -4.25 | 4.98 | 0.32 | 0.3734 | -0.0040 | |||
| CE / Celanese Corporation | 0.09 | 21.99 | 4.96 | 18.89 | 0.3716 | 0.0547 | |||
| TAP / Molson Coors Beverage Company | 0.10 | 0.00 | 4.93 | -21.00 | 0.3692 | -0.1047 | |||
| FE / FirstEnergy Corp. | 0.12 | -24.30 | 4.86 | -24.60 | 0.3645 | -0.1257 | |||
| CMI / Cummins Inc. | 0.01 | -15.75 | 4.84 | -11.97 | 0.3625 | -0.0551 | |||
| FIS / Fidelity National Information Services, Inc. | 0.06 | 1,701.11 | 4.76 | 1,654.98 | 0.3564 | 0.3366 | |||
| S&P500 EMINI FUT SEP25 PHYSICAL INDEX FUTURE. / DE (N/A) | 4.69 | 0.3515 | 0.3515 | ||||||
| ALSN / Allison Transmission Holdings, Inc. | 0.05 | 24.43 | 4.65 | 23.54 | 0.3485 | 0.0625 | |||
| VTRS / Viatris Inc. | 0.51 | 0.00 | 4.57 | 2.54 | 0.3421 | 0.0037 | |||
| WTW / Willis Towers Watson Public Limited Company | 0.01 | 0.00 | 4.45 | -9.30 | 0.3333 | -0.0394 | |||
| ON / ON Semiconductor Corporation | 0.08 | 3.45 | 4.42 | 33.25 | 0.3309 | 0.0791 | |||
| LOW / Lowe's Companies, Inc. | 0.02 | -47.99 | 4.40 | -50.52 | 0.3299 | -0.3462 | |||
| SHEL / Shell plc - Depositary Receipt (Common Stock) | 0.06 | 0.00 | 4.34 | -3.92 | 0.3249 | -0.0180 | |||
| STLD / Steel Dynamics, Inc. | 0.03 | -20.98 | 4.13 | -19.14 | 0.3094 | -0.0786 | |||
| GS / The Goldman Sachs Group, Inc. | 0.01 | -3.79 | 4.12 | 24.65 | 0.3084 | 0.0575 | |||
| BAX / Baxter International Inc. | 0.14 | 0.00 | 4.09 | -11.54 | 0.3067 | -0.0449 | |||
| PHM / PulteGroup, Inc. | 0.04 | 0.00 | 4.06 | 2.60 | 0.3045 | 0.0035 | |||
| GSK / GSK plc - Depositary Receipt (Common Stock) | 0.11 | 0.00 | 4.06 | -0.88 | 0.3044 | -0.0070 | |||
| AXP / American Express Company | 0.01 | 298.22 | 4.06 | 372.29 | 0.3040 | 0.2387 | |||
| NLY / Annaly Capital Management, Inc. | 0.21 | 44.79 | 3.90 | 34.16 | 0.2920 | 0.0713 | |||
| LDOS / Leidos Holdings, Inc. | 0.02 | 3.89 | 0.2918 | 0.2918 | |||||
| GOOGL / Alphabet Inc. | 0.02 | 44.22 | 3.87 | 64.40 | 0.2896 | 0.1109 | |||
| CAG / Conagra Brands, Inc. | 0.18 | 0.00 | 3.76 | -23.27 | 0.2818 | -0.0905 | |||
| S&P MID 400 EMINI SEP25 PHYSICAL INDEX FUTURE. / DE (N/A) | 3.75 | 0.2810 | 0.2810 | ||||||
| HII / Huntington Ingalls Industries, Inc. | 0.02 | 0.00 | 3.74 | 18.32 | 0.2802 | 0.0401 | |||
| ARW / Arrow Electronics, Inc. | 0.03 | 0.00 | 3.73 | 22.75 | 0.2794 | 0.0485 | |||
| DEO / Diageo plc - Depositary Receipt (Common Stock) | 0.04 | -15.17 | 3.70 | -18.38 | 0.2776 | -0.0672 | |||
| CF / CF Industries Holdings, Inc. | 0.04 | 3.66 | 0.2740 | 0.2740 | |||||
| NEM / Newmont Corporation | 0.06 | -6.11 | 3.61 | 52.64 | 0.2703 | 0.1005 | |||
| FLEX / Flex Ltd. | 0.07 | 0.00 | 3.60 | 50.92 | 0.2701 | 0.0886 | |||
| R / Ryder System, Inc. | 0.02 | -16.17 | 3.58 | -7.32 | 0.2685 | -0.0253 | |||
| ANF / Abercrombie & Fitch Co. | 0.04 | 3.57 | 0.2674 | 0.2674 | |||||
| CRUS / Cirrus Logic, Inc. | 0.03 | 58.86 | 3.54 | 66.20 | 0.2653 | 0.1034 | |||
| VNT / Vontier Corporation | 0.09 | 0.00 | 3.50 | 12.34 | 0.2620 | 0.0255 | |||
| RRX / Regal Rexnord Corporation | 0.02 | 3.50 | 0.2619 | 0.2619 | |||||
| EIX / Edison International | 0.07 | -17.18 | 3.48 | -27.48 | 0.2605 | -0.1037 | |||
| HIG / The Hartford Insurance Group, Inc. | 0.03 | -2.85 | 3.43 | -0.41 | 0.2573 | -0.0046 | |||
| META / Meta Platforms, Inc. | 0.00 | -23.25 | 3.43 | -1.72 | 0.2571 | -0.0081 | |||
| MTB / M&T Bank Corporation | 0.02 | 32.18 | 3.41 | 43.46 | 0.2555 | 0.0749 | |||
| TKR / The Timken Company | 0.05 | -1.27 | 3.40 | -0.35 | 0.2545 | -0.0045 | |||
| EL / The Estée Lauder Companies Inc. | 0.04 | 4.12 | 3.38 | 27.48 | 0.2531 | 0.0517 | |||
| BG / Bunge Global SA | 0.04 | 11.89 | 3.38 | 17.51 | 0.2530 | 0.0347 | |||
| ABEV / Ambev S.A. - Depositary Receipt (Common Stock) | 1.39 | -13.03 | 3.34 | -10.04 | 0.2505 | -0.0319 | |||
| OC / Owens Corning | 0.02 | -10.98 | 3.34 | -14.27 | 0.2502 | -0.0458 | |||
| BP / BP p.l.c. - Depositary Receipt (Common Stock) | 0.11 | -24.44 | 3.33 | -33.07 | 0.2497 | -0.1286 | |||
| RS / Reliance, Inc. | 0.01 | -43.38 | 3.33 | -37.77 | 0.2496 | -0.1594 | |||
| HUM / Humana Inc. | 0.01 | 6.48 | 3.32 | -1.63 | 0.2491 | -0.0076 | |||
| BBY / Best Buy Co., Inc. | 0.05 | 3.31 | 0.2481 | 0.2481 | |||||
| FITB / Fifth Third Bancorp | 0.08 | 0.00 | 3.30 | 4.93 | 0.2471 | 0.0083 | |||
| BMY / Bristol-Myers Squibb Company | 0.07 | -51.06 | 3.23 | -62.86 | 0.2417 | -0.4182 | |||
| HHH / Howard Hughes Holdings Inc. | 0.05 | 7.36 | 3.20 | -2.17 | 0.2401 | -0.0088 | |||
| CNQ / Canadian Natural Resources Limited | 0.10 | 16.53 | 3.17 | 18.79 | 0.2379 | 0.0348 | |||
| ALL / The Allstate Corporation | 0.02 | -31.92 | 3.15 | -33.82 | 0.2361 | -0.1257 | |||
| MU / Micron Technology, Inc. | 0.03 | 0.00 | 3.15 | 41.83 | 0.2361 | 0.0673 | |||
| RPRX / Royalty Pharma plc | 0.09 | -51.00 | 3.13 | -43.30 | 0.2348 | -0.1851 | |||
| FCX / Freeport-McMoRan Inc. | 0.07 | 0.00 | 3.12 | 14.49 | 0.2339 | 0.0268 | |||
| DELL / Dell Technologies Inc. | 0.03 | -15.76 | 3.11 | 13.31 | 0.2329 | 0.0245 | |||
| ICLR / ICON Public Limited Company | 0.02 | 840.84 | 3.08 | 682.70 | 0.2305 | 0.2006 | |||
| EMN / Eastman Chemical Company | 0.04 | -3.09 | 3.05 | -17.89 | 0.2284 | -0.0536 | |||
| BWA / BorgWarner Inc. | 0.09 | 0.00 | 3.03 | 16.89 | 0.2271 | 0.0300 | |||
| RGA / Reinsurance Group of America, Incorporated | 0.02 | -30.19 | 3.03 | -4.63 | 0.2268 | -0.0299 | |||
| ZION / Zions Bancorporation, National Association | 0.06 | 33.60 | 3.02 | 39.19 | 0.2263 | 0.0614 | |||
| LEN / Lennar Corporation | 0.03 | 0.00 | 3.01 | -3.62 | 0.2252 | -0.0118 | |||
| NFG / National Fuel Gas Company | 0.03 | 2.94 | 0.2205 | 0.2205 | |||||
| MTG / MGIC Investment Corporation | 0.10 | -21.03 | 2.91 | -11.27 | 0.2183 | -0.0312 | |||
| SWKS / Skyworks Solutions, Inc. | 0.04 | 0.00 | 2.89 | 15.30 | 0.2169 | 0.0261 | |||
| AMP / Ameriprise Financial, Inc. | 0.01 | -40.46 | 2.89 | -34.35 | 0.2164 | -0.1179 | |||
| AMAT / Applied Materials, Inc. | 0.02 | 0.00 | 2.87 | 26.17 | 0.2153 | 0.0422 | |||
| AIG / American International Group, Inc. | 0.03 | -16.95 | 2.87 | -18.23 | 0.2151 | -0.0517 | |||
| CAT / Caterpillar Inc. | 0.01 | 0.00 | 2.87 | 17.72 | 0.2151 | 0.0298 | |||
| EXPD / Expeditors International of Washington, Inc. | 0.03 | 1,005.56 | 2.86 | 940.73 | 0.2145 | 0.1947 | |||
| EXC / Exelon Corporation | 0.07 | -7.14 | 2.84 | -12.51 | 0.2128 | -0.0338 | |||
| DIS / The Walt Disney Company | 0.02 | -44.31 | 2.84 | -30.05 | 0.2127 | -0.0956 | |||
| SNX / TD SYNNEX Corporation | 0.02 | 45.06 | 2.83 | 89.41 | 0.2118 | 0.0984 | |||
| RDN / Radian Group Inc. | 0.08 | 0.00 | 2.82 | 8.89 | 0.2111 | 0.0146 | |||
| LYB / LyondellBasell Industries N.V. | 0.05 | 3.83 | 2.80 | -14.66 | 0.2099 | -0.0395 | |||
| FFIV / F5, Inc. | 0.01 | 2.77 | 0.2077 | 0.2077 | |||||
| FHN / First Horizon Corporation | 0.13 | 12.83 | 2.72 | 23.19 | 0.2038 | 0.0360 | |||
| OSK / Oshkosh Corporation | 0.02 | 0.00 | 2.72 | 20.66 | 0.2036 | 0.0325 | |||
| AGCO / AGCO Corporation | 0.03 | -33.23 | 2.68 | -25.59 | 0.2011 | -0.0730 | |||
| JLL / Jones Lang LaSalle Incorporated | 0.01 | 364.60 | 2.63 | 717.39 | 0.1972 | 0.1730 | |||
| DXC / DXC Technology Company | 0.17 | 52.27 | 2.61 | 36.57 | 0.1959 | 0.0504 | |||
| OHI / Omega Healthcare Investors, Inc. | 0.07 | -10.27 | 2.55 | -13.64 | 0.1908 | -0.0332 | |||
| LNC / Lincoln National Corporation | 0.07 | 53.45 | 2.54 | 47.90 | 0.1902 | 0.0598 | |||
| HAL / Halliburton Company | 0.12 | 31.38 | 2.53 | 5.56 | 0.1892 | 0.0074 | |||
| NTRS / Northern Trust Corporation | 0.02 | 361.74 | 2.52 | 493.65 | 0.1891 | 0.1568 | |||
| MGA / Magna International Inc. | 0.06 | -30.33 | 2.44 | -20.88 | 0.1830 | -0.0515 | |||
| SBRA / Sabra Health Care REIT, Inc. | 0.13 | -8.05 | 2.44 | -2.91 | 0.1827 | -0.0082 | |||
| INCY / Incyte Corporation | 0.04 | 0.00 | 2.41 | 12.49 | 0.1808 | 0.0178 | |||
| HCA / HCA Healthcare, Inc. | 0.01 | -27.91 | 2.40 | -20.07 | 0.1800 | -0.0484 | |||
| APTV / Aptiv PLC | 0.04 | 2.40 | 0.1799 | 0.1799 | |||||
| UAL / United Airlines Holdings, Inc. | 0.03 | -20.57 | 2.37 | -8.40 | 0.1774 | -0.0190 | |||
| SNY / Sanofi - Depositary Receipt (Common Stock) | 0.05 | 0.00 | 2.34 | -12.88 | 0.1754 | -0.0288 | |||
| PAG / Penske Automotive Group, Inc. | 0.01 | 0.00 | 2.33 | 19.30 | 0.1746 | 0.0262 | |||
| ALLY / Ally Financial Inc. | 0.06 | 39.22 | 2.28 | 48.66 | 0.1710 | 0.0544 | |||
| RF / Regions Financial Corporation | 0.10 | 0.00 | 2.28 | 8.27 | 0.1708 | 0.0108 | |||
| ADBE / Adobe Inc. | 0.01 | 2.25 | 0.1686 | 0.1686 | |||||
| EWBC / East West Bancorp, Inc. | 0.02 | 0.00 | 2.23 | 12.47 | 0.1669 | 0.0165 | |||
| ALK / Alaska Air Group, Inc. | 0.04 | -40.12 | 2.23 | -26.66 | 0.1668 | -0.0651 | |||
| PYPL / PayPal Holdings, Inc. | 0.03 | 2.22 | 0.1664 | 0.1664 | |||||
| AN / AutoNation, Inc. | 0.01 | 0.00 | 2.17 | 22.70 | 0.1628 | 0.0282 | |||
| MOS / The Mosaic Company | 0.06 | -12.99 | 2.16 | 17.57 | 0.1619 | 0.0222 | |||
| DVN / Devon Energy Corporation | 0.07 | 0.00 | 2.11 | -14.92 | 0.1581 | -0.0304 | |||
| LMT / Lockheed Martin Corporation | 0.00 | -4.52 | 2.09 | -1.04 | 0.1568 | -0.0038 | |||
| GMAB / Genmab A/S - Depositary Receipt (Common Stock) | 0.10 | 7.05 | 2.06 | 12.92 | 0.1546 | 0.0158 | |||
| HOLX / Hologic, Inc. | 0.03 | 736.11 | 2.04 | 599.66 | 0.1531 | 0.1321 | |||
| ACM / AECOM | 0.02 | 2.03 | 0.1522 | 0.1522 | |||||
| SLVM / Sylvamo Corporation | 0.04 | 30.29 | 2.03 | -2.69 | 0.1519 | -0.0064 | |||
| F / Ford Motor Company | 0.19 | 0.00 | 2.01 | 8.17 | 0.1509 | 0.0094 | |||
| PVH / PVH Corp. | 0.03 | 0.00 | 1.95 | 6.09 | 0.1463 | 0.0065 | |||
| CRM / Salesforce, Inc. | 0.01 | 1.95 | 0.1461 | 0.1461 | |||||
| CNH / CNH Industrial N.V. | 0.15 | -4.90 | 1.89 | 0.37 | 0.1414 | -0.0015 | |||
| OGN / Organon & Co. | 0.19 | 10.84 | 1.84 | -27.95 | 0.1380 | -0.0562 | |||
| CFG / Citizens Financial Group, Inc. | 0.04 | -6.13 | 1.82 | 2.53 | 0.1367 | 0.0015 | |||
| AMKR / Amkor Technology, Inc. | 0.09 | 0.00 | 1.81 | 16.23 | 0.1358 | 0.0173 | |||
| MAN / ManpowerGroup Inc. | 0.04 | 4.76 | 1.79 | -26.91 | 0.1344 | -0.0520 | |||
| DBX / Dropbox, Inc. | 0.06 | 32.57 | 1.76 | 42.00 | 0.1318 | 0.0376 | |||
| ACI / Albertsons Companies, Inc. | 0.08 | 76.42 | 1.74 | 72.65 | 0.1306 | 0.0538 | |||
| UHS / Universal Health Services, Inc. | 0.01 | 107.46 | 1.73 | 100.12 | 0.1299 | 0.0640 | |||
| EXEL / Exelixis, Inc. | 0.04 | -15.96 | 1.61 | 0.38 | 0.1203 | -0.0013 | |||
| APA / APA Corporation | 0.08 | 41.23 | 1.50 | 22.94 | 0.1121 | 0.0196 | |||
| KHC / The Kraft Heinz Company | 0.06 | 0.00 | 1.45 | -15.15 | 0.1088 | -0.0212 | |||
| SLB / Schlumberger Limited | 0.04 | 0.00 | 1.42 | -19.15 | 0.1064 | -0.0270 | |||
| OI / O-I Glass, Inc. | 0.09 | 66.80 | 1.39 | 114.40 | 0.1038 | 0.0547 | |||
| DKS / DICK'S Sporting Goods, Inc. | 0.01 | 0.00 | 1.35 | -1.89 | 0.1011 | -0.0034 | |||
| DINO / HF Sinclair Corporation | 0.03 | 0.00 | 1.29 | 24.90 | 0.0966 | 0.0182 | |||
| AFG / American Financial Group, Inc. | 0.01 | -16.62 | 1.20 | -19.91 | 0.0899 | -0.0239 | |||
| G / Genpact Limited | 0.03 | 1.18 | 0.0885 | 0.0885 | |||||
| CRBG / Corebridge Financial, Inc. | 0.03 | 0.00 | 1.16 | 12.44 | 0.0867 | 0.0085 | |||
| MLI / Mueller Industries, Inc. | 0.01 | -0.36 | 1.11 | 4.02 | 0.0834 | 0.0021 | |||
| GEN / Gen Digital Inc. | 0.04 | 0.00 | 1.11 | 10.78 | 0.0832 | 0.0070 | |||
| GPK / Graphic Packaging Holding Company | 0.05 | 0.00 | 1.09 | -18.80 | 0.0819 | -0.0204 | |||
| STNG / Scorpio Tankers Inc. | 0.03 | 11.77 | 1.09 | 16.36 | 0.0816 | 0.0105 | |||
| PSX / Phillips 66 | 0.01 | 0.00 | 1.04 | -3.34 | 0.0780 | -0.0039 | |||
| LKQ / LKQ Corporation | 0.03 | 1.02 | 0.0764 | 0.0764 | |||||
| GT / The Goodyear Tire & Rubber Company | 0.09 | -27.85 | 0.93 | -19.02 | 0.0696 | -0.0176 | |||
| EG / Everest Group, Ltd. | 0.00 | -17.46 | 0.90 | -22.83 | 0.0674 | -0.0211 | |||
| NUS / Nu Skin Enterprises, Inc. | 0.11 | 0.88 | 0.0659 | 0.0659 | |||||
| WU / The Western Union Company | 0.10 | 0.00 | 0.82 | -20.39 | 0.0618 | -0.0169 | |||
| TGNA / TEGNA Inc. | 0.04 | 0.00 | 0.69 | -7.98 | 0.0519 | -0.0053 | |||
| HOG / Harley-Davidson, Inc. | 0.03 | -13.51 | 0.64 | -19.21 | 0.0476 | -0.0121 | |||
| TSM / Taiwan Semiconductor Manufacturing Company Limited - Depositary Receipt (Common Stock) | 0.00 | 0.30 | 0.0223 | 0.0223 | |||||
| LNTH / Lantheus Holdings, Inc. | 0.00 | -67.05 | 0.26 | -72.38 | 0.0198 | -0.0529 | |||
| GOOG / Alphabet Inc. | 0.00 | -51.59 | 0.18 | -34.94 | 0.0131 | -0.0086 | |||
| MRP / Millrose Properties, Inc. | 0.00 | -100.00 | 0.00 | -100.00 | -0.0274 |