Basic Stats
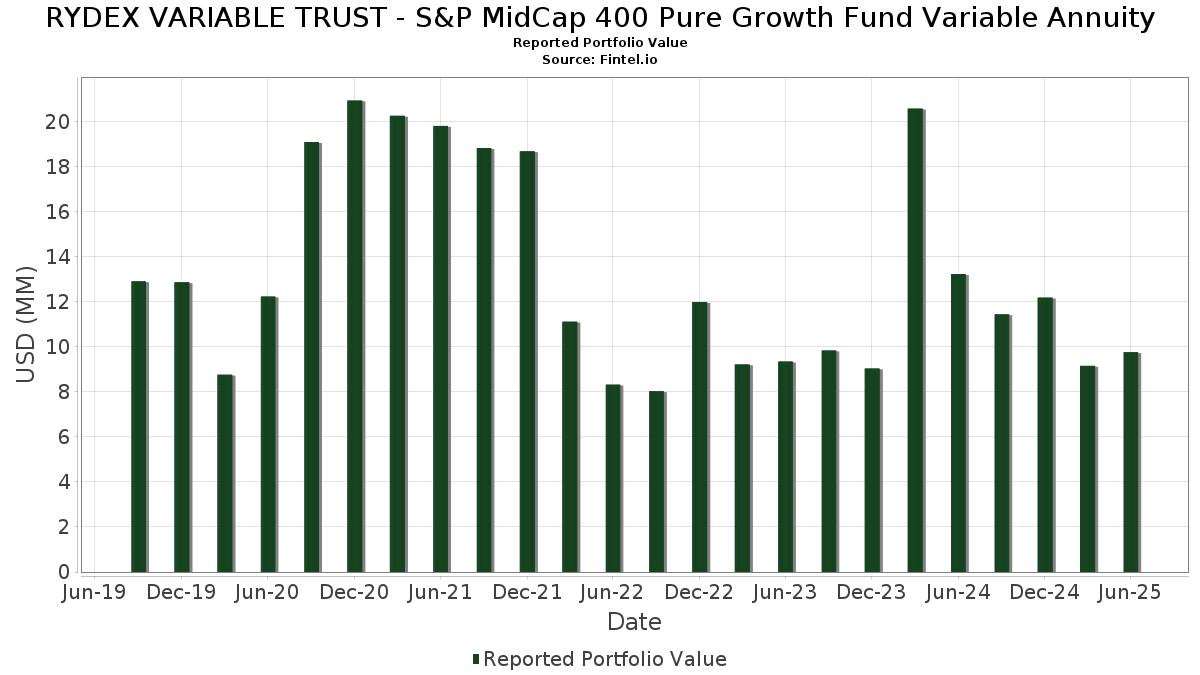
| Portfolio Value | $ 9,761,116 |
| Current Positions | 97 |
Latest Holdings, Performance, AUM (from 13F, 13D)
RYDEX VARIABLE TRUST - S&P MidCap 400 Pure Growth Fund Variable Annuity has disclosed 97 total holdings in their latest SEC filings. Most recent portfolio value is calculated to be $ 9,761,116 USD. Actual Assets Under Management (AUM) is this value plus cash (which is not disclosed). RYDEX VARIABLE TRUST - S&P MidCap 400 Pure Growth Fund Variable Annuity’s top holdings are Carpenter Technology Corporation (US:CRS) , Hims & Hers Health, Inc. (US:HIMS) , Comfort Systems USA, Inc. (US:FIX) , Roivant Sciences Ltd. (US:ROIV) , and EMCOR Group, Inc. (US:EME) . RYDEX VARIABLE TRUST - S&P MidCap 400 Pure Growth Fund Variable Annuity’s new positions include Pegasystems Inc. (US:PEGA) , Okta, Inc. (US:OKTA) , .
Top Increases This Quarter
We use the change in the portfolio allocation because this is the most meaningful metric. Changes can be due to trades or changes in share prices.
| Security | Shares (MM) |
Value (MM$) |
Portfolio % | ΔPortfolio % |
|---|---|---|---|---|
| 0.36 | 0.36 | 3.8280 | 3.8280 | |
| 0.01 | 0.26 | 2.8075 | 0.9184 | |
| 0.00 | 0.08 | 0.8525 | 0.8525 | |
| 0.00 | 0.22 | 2.3860 | 0.7563 | |
| 0.00 | 0.27 | 2.9049 | 0.7453 | |
| 0.00 | 0.06 | 0.6625 | 0.6625 | |
| 0.00 | 0.16 | 1.7201 | 0.5436 | |
| 0.04 | 0.4209 | 0.4209 | ||
| 0.00 | 0.18 | 1.9406 | 0.4183 | |
| 0.00 | 0.14 | 1.5204 | 0.3389 |
Top Decreases This Quarter
We use the change in the portfolio allocation because this is the most meaningful metric. Changes can be due to trades or changes in share prices.
| Security | Shares (MM) |
Value (MM$) |
Portfolio % | ΔPortfolio % |
|---|---|---|---|---|
| 0.00 | 0.02 | 0.2401 | -0.7770 | |
| 0.00 | 0.13 | 1.3767 | -0.5612 | |
| 0.00 | 0.11 | 1.1957 | -0.4687 | |
| 0.00 | 0.11 | 1.1217 | -0.4212 | |
| 0.00 | 0.11 | 1.1207 | -0.3956 | |
| 0.00 | 0.08 | 0.8731 | -0.3000 | |
| 0.00 | 0.08 | 0.8551 | -0.2670 | |
| 0.00 | 0.07 | 0.7291 | -0.2653 | |
| 0.00 | 0.11 | 1.1714 | -0.2618 | |
| 0.00 | 0.10 | 1.0462 | -0.2441 |
13F and Fund Filings
This form was filed on 2025-08-27 for the reporting period 2025-06-30. Click the link icon to see the full transaction history.
Upgrade to unlock premium data and export to Excel ![]() .
.
| Security | Type | Avg Share Price | Shares (MM) |
ΔShares (%) |
ΔShares (%) |
Value ($MM) |
Portfolio (%) |
ΔPortfolio (%) |
|
|---|---|---|---|---|---|---|---|---|---|
| First American Government Obligations Fund - Class X / STIV (N/A) | 0.36 | 0.36 | 3.8280 | 3.8280 | |||||
| CRS / Carpenter Technology Corporation | 0.00 | -7.77 | 0.27 | 40.93 | 2.9049 | 0.7453 | |||
| HIMS / Hims & Hers Health, Inc. | 0.01 | -7.86 | 0.26 | 55.62 | 2.8075 | 0.9184 | |||
| FIX / Comfort Systems USA, Inc. | 0.00 | -7.95 | 0.22 | 52.74 | 2.3860 | 0.7563 | |||
| ROIV / Roivant Sciences Ltd. | 0.02 | -7.85 | 0.20 | 2.56 | 2.1420 | -0.0347 | |||
| EME / EMCOR Group, Inc. | 0.00 | -7.86 | 0.18 | 33.09 | 1.9406 | 0.4183 | |||
| VAL / Valaris Limited | 0.00 | -7.84 | 0.18 | -1.12 | 1.8854 | -0.1096 | |||
| EXEL / Exelixis, Inc. | 0.00 | -7.83 | 0.17 | 10.39 | 1.8154 | 0.0897 | |||
| FOUR / Shift4 Payments, Inc. | 0.00 | -7.85 | 0.16 | 12.33 | 1.7503 | 0.1124 | |||
| IBKR / Interactive Brokers Group, Inc. | 0.00 | 268.83 | 0.16 | 23.48 | 1.7490 | 0.2667 | |||
| ATI / ATI Inc. | 0.00 | -7.85 | 0.16 | 53.33 | 1.7201 | 0.5436 | |||
| GWRE / Guidewire Software, Inc. | 0.00 | -7.71 | 0.15 | 16.41 | 1.5929 | 0.1563 | |||
| PLNT / Planet Fitness, Inc. | 0.00 | -7.83 | 0.14 | 3.62 | 1.5337 | -0.0083 | |||
| MTZ / MasTec, Inc. | 0.00 | -7.83 | 0.14 | 35.24 | 1.5204 | 0.3389 | |||
| MASI / Masimo Corporation | 0.00 | -7.80 | 0.14 | -6.62 | 1.5060 | -0.1861 | |||
| RNR / RenaissanceRe Holdings Ltd. | 0.00 | -7.78 | 0.14 | -6.62 | 1.5059 | -0.1817 | |||
| TXRH / Texas Roadhouse, Inc. | 0.00 | -7.90 | 0.13 | 3.91 | 1.4219 | -0.0139 | |||
| GMED / Globus Medical, Inc. | 0.00 | -7.84 | 0.13 | -25.43 | 1.3767 | -0.5612 | |||
| RBC / RBC Bearings Incorporated | 0.00 | -7.71 | 0.13 | 10.34 | 1.3755 | 0.0719 | |||
| KNSL / Kinsale Capital Group, Inc. | 0.00 | -7.75 | 0.13 | -8.70 | 1.3528 | -0.1899 | |||
| SFM / Sprouts Farmers Market, Inc. | 0.00 | -7.89 | 0.12 | -0.81 | 1.3123 | -0.0693 | |||
| WING / Wingstop Inc. | 0.00 | -7.89 | 0.12 | 37.50 | 1.3008 | 0.3113 | |||
| H / Hyatt Hotels Corporation | 0.00 | -7.75 | 0.12 | 5.31 | 1.2771 | 0.0069 | |||
| RBA / RB Global, Inc. | 0.00 | -7.86 | 0.12 | -2.46 | 1.2759 | -0.0921 | |||
| HLNE / Hamilton Lane Incorporated | 0.00 | -7.85 | 0.12 | -11.94 | 1.2648 | -0.2369 | |||
| CHWY / Chewy, Inc. | 0.00 | -7.83 | 0.12 | 20.62 | 1.2579 | 0.1690 | |||
| GTLS / Chart Industries, Inc. | 0.00 | -7.84 | 0.12 | 5.45 | 1.2386 | 0.0061 | |||
| HALO / Halozyme Therapeutics, Inc. | 0.00 | -7.83 | 0.11 | -24.83 | 1.1957 | -0.4687 | |||
| EXLS / ExlService Holdings, Inc. | 0.00 | -7.83 | 0.11 | -14.84 | 1.1714 | -0.2618 | |||
| AAON / AAON, Inc. | 0.00 | -7.79 | 0.11 | -12.80 | 1.1647 | -0.2349 | |||
| PR / Permian Resources Corporation | 0.01 | -7.84 | 0.11 | -9.32 | 1.1490 | -0.1771 | |||
| KEX / Kirby Corporation | 0.00 | -7.80 | 0.11 | 3.88 | 1.1448 | -0.0119 | |||
| PPC / Pilgrim's Pride Corporation | 0.00 | -7.85 | 0.11 | -23.91 | 1.1217 | -0.4212 | |||
| LNTH / Lantheus Holdings, Inc. | 0.00 | -7.83 | 0.11 | -22.22 | 1.1207 | -0.3956 | |||
| HGV / Hilton Grand Vacations Inc. | 0.00 | -7.81 | 0.10 | 1.96 | 1.1190 | -0.0247 | |||
| ALK / Alaska Air Group, Inc. | 0.00 | -7.80 | 0.10 | -7.14 | 1.1172 | -0.1435 | |||
| CW / Curtiss-Wright Corporation | 0.00 | -7.79 | 0.10 | 42.47 | 1.1104 | 0.2924 | |||
| CLH / Clean Harbors, Inc. | 0.00 | -7.84 | 0.10 | 8.42 | 1.1027 | 0.0358 | |||
| PCTY / Paylocity Holding Corporation | 0.00 | -7.80 | 0.10 | -11.30 | 1.0962 | -0.1897 | |||
| APPF / AppFolio, Inc. | 0.00 | -7.66 | 0.10 | -3.77 | 1.0959 | -0.0895 | |||
| AAL / American Airlines Group Inc. | 0.01 | -7.85 | 0.10 | -1.96 | 1.0749 | -0.0723 | |||
| CVLT / Commvault Systems, Inc. | 0.00 | -7.70 | 0.10 | 2.04 | 1.0696 | -0.0273 | |||
| EWBC / East West Bancorp, Inc. | 0.00 | -7.79 | 0.10 | 4.26 | 1.0463 | -0.0086 | |||
| RYAN / Ryan Specialty Holdings, Inc. | 0.00 | -7.86 | 0.10 | -14.78 | 1.0462 | -0.2441 | |||
| MEDP / Medpace Holdings, Inc. | 0.00 | -8.08 | 0.10 | -4.95 | 1.0282 | -0.1076 | |||
| TOL / Toll Brothers, Inc. | 0.00 | -7.86 | 0.09 | -1.05 | 1.0132 | -0.0509 | |||
| WAL / Western Alliance Bancorporation | 0.00 | -7.84 | 0.09 | -6.12 | 0.9877 | -0.1168 | |||
| TNL / Travel + Leisure Co. | 0.00 | -7.87 | 0.09 | 2.22 | 0.9869 | -0.0180 | |||
| CNX / CNX Resources Corporation | 0.00 | -7.83 | 0.09 | -1.14 | 0.9348 | -0.0567 | |||
| ANF / Abercrombie & Fitch Co. | 0.00 | -7.81 | 0.09 | 0.00 | 0.9292 | -0.0425 | |||
| VVV / Valvoline Inc. | 0.00 | -7.83 | 0.09 | 0.00 | 0.9270 | -0.0400 | |||
| WWD / Woodward, Inc. | 0.00 | -7.81 | 0.09 | 22.86 | 0.9258 | 0.1437 | |||
| DOCU / DocuSign, Inc. | 0.00 | -7.82 | 0.09 | -11.34 | 0.9209 | -0.1711 | |||
| HRB / H&R Block, Inc. | 0.00 | -7.84 | 0.08 | -8.79 | 0.8950 | -0.1211 | |||
| BWXT / BWX Technologies, Inc. | 0.00 | -7.83 | 0.08 | 36.07 | 0.8870 | 0.1977 | |||
| UTHR / United Therapeutics Corporation | 0.00 | -7.69 | 0.08 | -14.58 | 0.8831 | -0.1904 | |||
| FN / Fabrinet | 0.00 | -7.59 | 0.08 | 38.98 | 0.8804 | 0.2125 | |||
| EXP / Eagle Materials Inc. | 0.00 | -7.71 | 0.08 | -15.46 | 0.8778 | -0.2146 | |||
| VNOM / Viper Energy, Inc. | 0.00 | -7.82 | 0.08 | -22.86 | 0.8731 | -0.3000 | |||
| NBIX / Neurocrine Biosciences, Inc. | 0.00 | -7.75 | 0.08 | 3.90 | 0.8624 | 0.0020 | |||
| MUSA / Murphy USA Inc. | 0.00 | -7.94 | 0.08 | -20.00 | 0.8551 | -0.2670 | |||
| PEGA / Pegasystems Inc. | 0.00 | 0.08 | 0.8525 | 0.8525 | |||||
| LOPE / Grand Canyon Education, Inc. | 0.00 | -7.88 | 0.08 | 0.00 | 0.8491 | -0.0335 | |||
| DOCS / Doximity, Inc. | 0.00 | -7.80 | 0.08 | -2.47 | 0.8430 | -0.0618 | |||
| BLD / TopBuild Corp. | 0.00 | -7.69 | 0.08 | -2.53 | 0.8291 | -0.0558 | |||
| PSN / Parsons Corporation | 0.00 | -7.88 | 0.08 | 11.59 | 0.8240 | 0.0522 | |||
| DTM / DT Midstream, Inc. | 0.00 | -7.85 | 0.08 | 5.56 | 0.8128 | 0.0030 | |||
| AYI / Acuity Inc. | 0.00 | -7.94 | 0.08 | 5.56 | 0.8118 | -0.0024 | |||
| ESAB / ESAB Corporation | 0.00 | -7.94 | 0.08 | -5.06 | 0.8053 | -0.0789 | |||
| NVT / nVent Electric plc | 0.00 | -7.83 | 0.08 | 29.31 | 0.8004 | 0.1504 | |||
| ELF / e.l.f. Beauty, Inc. | 0.00 | -7.79 | 0.07 | 82.50 | 0.7861 | 0.3362 | |||
| SLM / SLM Corporation | 0.00 | -7.81 | 0.07 | 2.90 | 0.7642 | -0.0124 | |||
| AIT / Applied Industrial Technologies, Inc. | 0.00 | -7.74 | 0.07 | -4.17 | 0.7392 | -0.0732 | |||
| COKE / Coca-Cola Consolidated, Inc. | 0.00 | 827.27 | 0.07 | -23.60 | 0.7291 | -0.2653 | |||
| EQH / Equitable Holdings, Inc. | 0.00 | -7.82 | 0.07 | 0.00 | 0.7201 | -0.0386 | |||
| CROX / Crocs, Inc. | 0.00 | -7.91 | 0.07 | -12.00 | 0.7046 | -0.1346 | |||
| HQY / HealthEquity, Inc. | 0.00 | -7.82 | 0.06 | 10.34 | 0.6852 | 0.0294 | |||
| BDC / Belden Inc. | 0.00 | -7.72 | 0.06 | 6.78 | 0.6796 | 0.0128 | |||
| TTEK / Tetra Tech, Inc. | 0.00 | -7.83 | 0.06 | 12.73 | 0.6681 | 0.0514 | |||
| OKTA / Okta, Inc. | 0.00 | 0.06 | 0.6625 | 0.6625 | |||||
| CHDN / Churchill Downs Incorporated | 0.00 | -7.84 | 0.06 | -16.44 | 0.6585 | -0.1634 | |||
| ENSG / The Ensign Group, Inc. | 0.00 | -8.00 | 0.06 | 11.11 | 0.6436 | 0.0298 | |||
| MLI / Mueller Industries, Inc. | 0.00 | -7.85 | 0.06 | -4.84 | 0.6368 | -0.0557 | |||
| KNF / Knife River Corporation | 0.00 | -7.83 | 0.06 | -17.14 | 0.6255 | -0.1588 | |||
| DT / Dynatrace, Inc. | 0.00 | -7.86 | 0.05 | 8.16 | 0.5662 | 0.0173 | |||
| OC / Owens Corning | 0.00 | -7.79 | 0.05 | -10.34 | 0.5562 | -0.0990 | |||
| COHR / Coherent Corp. | 0.00 | -7.75 | 0.05 | 26.83 | 0.5550 | 0.0969 | |||
| CSL / Carlisle Companies Incorporated | 0.00 | -7.38 | 0.05 | 2.00 | 0.5499 | -0.0164 | |||
| HLI / Houlihan Lokey, Inc. | 0.00 | -8.04 | 0.05 | 2.17 | 0.5050 | -0.0105 | |||
| CHH / Choice Hotels International, Inc. | 0.00 | -7.85 | 0.04 | -12.00 | 0.4766 | -0.0895 | |||
| MANH / Manhattan Associates, Inc. | 0.00 | -7.80 | 0.04 | 5.41 | 0.4235 | 0.0025 | |||
| DE000C4SA6R6 / EURO STOXX 50 Index | 0.04 | 0.4209 | 0.4209 | ||||||
| LPX / Louisiana-Pacific Corporation | 0.00 | -7.86 | 0.04 | -14.29 | 0.3872 | -0.0830 | |||
| SAIA / Saia, Inc. | 0.00 | -8.06 | 0.03 | -27.91 | 0.3333 | -0.1503 | |||
| SRPT / Sarepta Therapeutics, Inc. | 0.00 | -7.84 | 0.02 | -75.82 | 0.2401 | -0.7770 | |||
| Barclays Capital, Inc. / RA (N/A) | 0.02 | 0.1816 | 0.1816 | ||||||
| BofA Securities, Inc. / RA (N/A) | 0.02 | 0.1754 | 0.1754 |