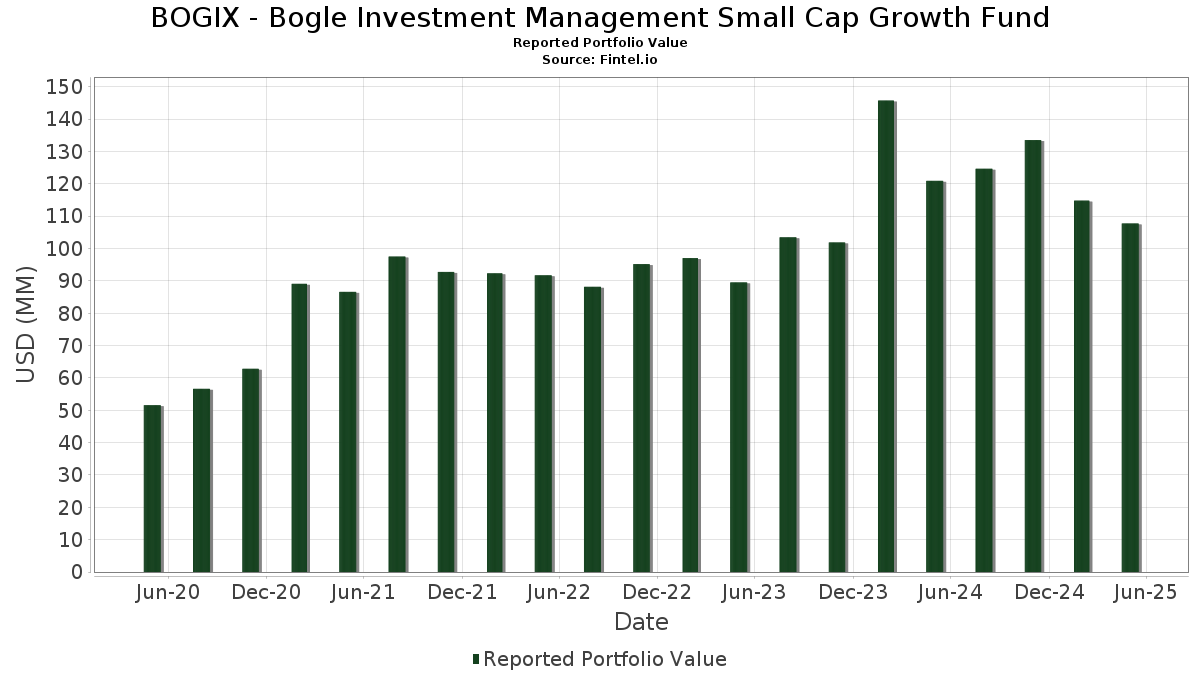
Basic Stats
| Portfolio Value | $ 107,743,932 |
| Current Positions | 196 |
Latest Holdings, Performance, AUM (from 13F, 13D)
BOGIX - Bogle Investment Management Small Cap Growth Fund has disclosed 196 total holdings in their latest SEC filings. Most recent portfolio value is calculated to be $ 107,743,932 USD. Actual Assets Under Management (AUM) is this value plus cash (which is not disclosed). BOGIX - Bogle Investment Management Small Cap Growth Fund’s top holdings are iShares Trust - iShares Core S&P Small-Cap ETF (US:IJR) , Sterling Infrastructure, Inc. (US:STRL) , NMI Holdings, Inc. (US:NMIH) , Catalyst Pharmaceuticals, Inc. (US:CPRX) , and National Fuel Gas Company (US:NFG) . BOGIX - Bogle Investment Management Small Cap Growth Fund’s new positions include Sterling Infrastructure, Inc. (US:STRL) , Armstrong World Industries, Inc. (US:AWI) , MGE Energy, Inc. (US:MGEE) , First Busey Corporation (US:BUSE) , and Intrepid Potash, Inc. (US:IPI) .
Top Increases This Quarter
We use the change in the portfolio allocation because this is the most meaningful metric. Changes can be due to trades or changes in share prices.
| Security | Shares (MM) |
Value (MM$) |
Portfolio % | ΔPortfolio % |
|---|---|---|---|---|
| 0.01 | 1.56 | 1.4525 | 1.4525 | |
| 0.01 | 1.09 | 1.0139 | 1.0139 | |
| 0.03 | 1.10 | 1.0214 | 0.9760 | |
| 0.01 | 1.05 | 0.9739 | 0.9739 | |
| 0.02 | 1.63 | 1.5113 | 0.9546 | |
| 0.03 | 0.97 | 0.9026 | 0.9026 | |
| 0.04 | 0.86 | 0.7973 | 0.7973 | |
| 0.02 | 1.02 | 0.9484 | 0.7510 | |
| 0.04 | 1.00 | 0.9252 | 0.6376 | |
| 0.02 | 1.20 | 1.1186 | 0.6027 |
Top Decreases This Quarter
We use the change in the portfolio allocation because this is the most meaningful metric. Changes can be due to trades or changes in share prices.
| Security | Shares (MM) |
Value (MM$) |
Portfolio % | ΔPortfolio % |
|---|---|---|---|---|
| 0.00 | 0.00 | -1.1306 | ||
| 0.00 | 0.00 | -1.0746 | ||
| 0.00 | 0.08 | 0.0782 | -0.9357 | |
| 0.01 | 0.32 | 0.2992 | -0.9095 | |
| 0.00 | 0.29 | 0.2728 | -0.8560 | |
| 0.00 | 0.09 | 0.0881 | -0.8506 | |
| 0.02 | 0.32 | 0.2970 | -0.6747 | |
| 0.00 | 0.00 | -0.6354 | ||
| 0.00 | 0.00 | -0.5790 | ||
| 0.01 | 0.58 | 0.5350 | -0.5613 |
13F and Fund Filings
This form was filed on 2025-07-29 for the reporting period 2025-05-31. Click the link icon to see the full transaction history.
Upgrade to unlock premium data and export to Excel ![]() .
.
| Security | Type | Avg Share Price | Shares (MM) |
ΔShares (%) |
ΔShares (%) |
Value ($MM) |
Portfolio (%) |
ΔPortfolio (%) |
|
|---|---|---|---|---|---|---|---|---|---|
| IJR / iShares Trust - iShares Core S&P Small-Cap ETF | 0.02 | 169.46 | 1.63 | 154.22 | 1.5113 | 0.9546 | |||
| STRL / Sterling Infrastructure, Inc. | 0.01 | 1.56 | 1.4525 | 1.4525 | |||||
| NMIH / NMI Holdings, Inc. | 0.04 | -2.82 | 1.52 | 5.99 | 1.4123 | 0.1649 | |||
| CPRX / Catalyst Pharmaceuticals, Inc. | 0.06 | -17.27 | 1.39 | -9.76 | 1.2880 | -0.0478 | |||
| NFG / National Fuel Gas Company | 0.02 | -23.72 | 1.34 | -16.27 | 1.2429 | -0.1461 | |||
| FTDR / Frontdoor, Inc. | 0.02 | -8.65 | 1.31 | 10.47 | 1.2153 | 0.1861 | |||
| AROC / Archrock, Inc. | 0.05 | 6.33 | 1.24 | -2.44 | 1.1541 | 0.0480 | |||
| 8AMMF0A92 / US Bank MM Deposit Account Global Fund | 1.24 | 41.07 | 1.24 | 41.14 | 1.1536 | 0.3885 | |||
| EME / EMCOR Group, Inc. | 0.00 | 1.53 | 1.22 | 17.12 | 1.1316 | 0.2279 | |||
| PRIM / Primoris Services Corporation | 0.02 | 102.77 | 1.20 | 74.75 | 1.1186 | 0.6027 | |||
| HRMY / Harmony Biosciences Holdings, Inc. | 0.03 | 16.76 | 1.20 | 19.10 | 1.1115 | 0.2376 | |||
| ENVA / Enova International, Inc. | 0.01 | 5.59 | 1.18 | -5.30 | 1.0947 | 0.0129 | |||
| JXN / Jackson Financial Inc. | 0.01 | 5.14 | 1.17 | -6.02 | 1.0872 | 0.0049 | |||
| MLI / Mueller Industries, Inc. | 0.01 | 17.96 | 1.16 | 14.62 | 1.0771 | 0.1974 | |||
| KEX / Kirby Corporation | 0.01 | 2.03 | 1.13 | 8.34 | 1.0493 | 0.1429 | |||
| TCBI / Texas Capital Bancshares, Inc. | 0.02 | 21.24 | 1.13 | 9.83 | 1.0474 | 0.1549 | |||
| VMI / Valmont Industries, Inc. | 0.00 | 0.06 | 1.13 | -8.67 | 1.0471 | -0.0255 | |||
| KFY / Korn Ferry | 0.02 | -9.52 | 1.13 | -6.32 | 1.0463 | 0.0019 | |||
| GHC / Graham Holdings Company | 0.00 | -16.16 | 1.12 | -18.67 | 1.0439 | -0.1569 | |||
| CVLT / Commvault Systems, Inc. | 0.01 | -17.49 | 1.12 | -11.42 | 1.0380 | -0.0582 | |||
| SKYW / SkyWest, Inc. | 0.01 | 13.41 | 1.11 | 16.28 | 1.0351 | 0.2025 | |||
| MATX / Matson, Inc. | 0.01 | 6.17 | 1.11 | -16.84 | 1.0321 | -0.1292 | |||
| BHE / Benchmark Electronics, Inc. | 0.03 | 2,202.98 | 1.10 | 2,015.38 | 1.0214 | 0.9760 | |||
| ALEX / Alexander & Baldwin, Inc. | 0.06 | 20.45 | 1.09 | 9.63 | 1.0149 | 0.2690 | |||
| BPOP / Popular, Inc. | 0.01 | -15.24 | 1.09 | -12.57 | 1.0140 | -0.0718 | |||
| AWI / Armstrong World Industries, Inc. | 0.01 | 1.09 | 1.0139 | 1.0139 | |||||
| ADEA / Adeia Inc. | 0.08 | 69.32 | 1.08 | 38.46 | 1.0028 | 0.3244 | |||
| NHC / National HealthCare Corporation | 0.01 | -3.54 | 1.08 | 7.79 | 1.0022 | 0.1325 | |||
| SFM / Sprouts Farmers Market, Inc. | 0.01 | -64.02 | 1.06 | 81.09 | 0.9874 | 0.3702 | |||
| CTRE / CareTrust REIT, Inc. | 0.04 | 51.29 | 1.06 | 68.20 | 0.9871 | 0.4380 | |||
| BKH / Black Hills Corporation | 0.02 | 20.96 | 1.05 | 15.60 | 0.9770 | 0.1862 | |||
| MGEE / MGE Energy, Inc. | 0.01 | 1.05 | 0.9739 | 0.9739 | |||||
| ESNT / Essent Group Ltd. | 0.02 | -19.87 | 1.04 | -19.38 | 0.9701 | -0.1553 | |||
| CARG / CarGurus, Inc. | 0.03 | 1.74 | 1.04 | -0.95 | 0.9691 | 0.0537 | |||
| AXS / AXIS Capital Holdings Limited | 0.01 | -1.10 | 1.03 | 5.95 | 0.9585 | 0.1121 | |||
| ROCK / Gibraltar Industries, Inc. | 0.02 | 393.27 | 1.02 | 315.04 | 0.9484 | 0.7510 | |||
| GFF / Griffon Corporation | 0.01 | 27.49 | 1.02 | 21.19 | 0.9455 | 0.2154 | |||
| UPBD / Upbound Group, Inc. | 0.04 | 288.56 | 1.00 | 159.38 | 0.9252 | 0.6376 | |||
| TPH / Tri Pointe Homes, Inc. | 0.03 | 15.88 | 0.99 | 7.88 | 0.9158 | 0.1216 | |||
| AVA / Avista Corporation | 0.03 | 0.97 | 0.9026 | 0.9026 | |||||
| NMRK / Newmark Group, Inc. | 0.09 | 3.67 | 0.96 | -22.20 | 0.8916 | -0.1806 | |||
| TILE / Interface, Inc. | 0.05 | 43.76 | 0.96 | 42.92 | 0.8907 | 0.3070 | |||
| WLDN / Willdan Group, Inc. | 0.02 | -9.97 | 0.95 | 48.90 | 0.8823 | 0.3275 | |||
| PRM / Perimeter Solutions, Inc. | 0.08 | -0.78 | 0.94 | 13.25 | 0.8731 | 0.1514 | |||
| TENB / Tenable Holdings, Inc. | 0.03 | 25.86 | 0.93 | 6.29 | 0.8634 | 0.1036 | |||
| PAHC / Phibro Animal Health Corporation | 0.04 | 42.20 | 0.93 | 52.81 | 0.8598 | 0.3330 | |||
| TK / Teekay Corporation Ltd. | 0.11 | -1.73 | 0.92 | 26.92 | 0.8583 | 0.2258 | |||
| CVCO / Cavco Industries, Inc. | 0.00 | 299.42 | 0.90 | 230.88 | 0.8362 | 0.5992 | |||
| QTWO / Q2 Holdings, Inc. | 0.01 | 4.73 | 0.88 | 4.87 | 0.8207 | 0.0887 | |||
| FBK / FB Financial Corporation | 0.02 | 8.97 | 0.88 | -5.89 | 0.8157 | 0.0051 | |||
| BUSE / First Busey Corporation | 0.04 | 0.86 | 0.7973 | 0.7973 | |||||
| FBP / First BanCorp. | 0.04 | 40.79 | 0.86 | 44.52 | 0.7960 | 0.2805 | |||
| BRBR / BellRing Brands, Inc. | 0.01 | -24.48 | 0.84 | -35.14 | 0.7784 | -0.3443 | |||
| CRUS / Cirrus Logic, Inc. | 0.01 | -17.23 | 0.83 | -21.91 | 0.7684 | -0.1519 | |||
| TDS / Telephone and Data Systems, Inc. | 0.02 | 192.88 | 0.81 | 179.24 | 0.7498 | 0.4982 | |||
| US87427V1035 / Hudson Executive Investment Corp. Class A | 0.25 | 51.85 | 0.79 | 69.44 | 0.7363 | 0.3296 | |||
| IVT / InvenTrust Properties Corp. | 0.03 | 331.96 | 0.78 | 308.33 | 0.7283 | 0.5611 | |||
| ATGE / Adtalem Global Education Inc. | 0.01 | -54.86 | 0.75 | -41.74 | 0.6946 | -0.4210 | |||
| VRTS / Virtus Investment Partners, Inc. | 0.00 | -18.45 | 0.75 | -34.25 | 0.6920 | -0.2163 | |||
| NBN / Northeast Bank | 0.01 | 5.97 | 0.74 | -11.55 | 0.6907 | -0.0398 | |||
| RHP / Ryman Hospitality Properties, Inc. | 0.01 | -2.45 | 0.73 | -4.20 | 0.6779 | 0.0158 | |||
| GTLB / GitLab Inc. | 0.02 | 360.17 | 0.73 | 248.33 | 0.6767 | 0.4946 | |||
| CALM / Cal-Maine Foods, Inc. | 0.01 | 3.84 | 0.73 | 10.18 | 0.6737 | 0.1017 | |||
| HRI / Herc Holdings Inc. | 0.01 | 3.67 | 0.72 | -10.43 | 0.6699 | -0.0297 | |||
| LOPE / Grand Canyon Education, Inc. | 0.00 | -4.93 | 0.71 | 4.59 | 0.6560 | 0.0692 | |||
| RNG / RingCentral, Inc. | 0.03 | 0.35 | 0.71 | -8.56 | 0.6553 | -0.0151 | |||
| AX / Axos Financial, Inc. | 0.01 | 1.62 | 0.69 | 5.79 | 0.6449 | 0.0745 | |||
| PDM / Piedmont Realty Trust, Inc. | 0.09 | 66.03 | 0.67 | 55.92 | 0.6241 | 0.2492 | |||
| AMBA / Ambarella, Inc. | 0.01 | 7.32 | 0.65 | -8.05 | 0.6052 | -0.0105 | |||
| TNK / Teekay Tankers Ltd. | 0.01 | -30.61 | 0.63 | -18.74 | 0.5877 | -0.0891 | |||
| KTB / Kontoor Brands, Inc. | 0.01 | 8.50 | 0.63 | 14.44 | 0.5816 | 0.1061 | |||
| CRDO / Credo Technology Group Holding Ltd | 0.01 | 34.12 | 0.61 | 48.43 | 0.5694 | 0.2098 | |||
| SWX / Southwest Gas Holdings, Inc. | 0.01 | -0.65 | 0.60 | -4.88 | 0.5608 | 0.0090 | |||
| SM / SM Energy Company | 0.03 | 25.51 | 0.60 | -10.06 | 0.5564 | -0.0229 | |||
| BLX / Banco Latinoamericano de Comercio Exterior, S. A. | 0.01 | -26.51 | 0.60 | -28.84 | 0.5543 | -0.1747 | |||
| KRYS / Krystal Biotech, Inc. | 0.00 | -1.21 | 0.59 | -30.53 | 0.5517 | -0.1919 | |||
| FOR / Forestar Group Inc. | 0.03 | -4.83 | 0.59 | -17.41 | 0.5511 | -0.0727 | |||
| OFG / OFG Bancorp | 0.01 | -52.84 | 0.58 | -54.32 | 0.5350 | -0.5613 | |||
| ROG / Rogers Corporation | 0.01 | 552.02 | 0.57 | 131.71 | 0.5299 | 0.2455 | |||
| MBC / MasterBrand, Inc. | 0.06 | 3.79 | 0.57 | -24.34 | 0.5286 | -0.1250 | |||
| ADMA / ADMA Biologics, Inc. | 0.03 | -36.98 | 0.56 | -23.70 | 0.5174 | -0.1172 | |||
| CDE / Coeur Mining, Inc. | 0.07 | 79.97 | 0.55 | 182.05 | 0.5114 | 0.3420 | |||
| MGRC / McGrath RentCorp | 0.00 | 781.13 | 0.55 | 713.43 | 0.5066 | 0.4482 | |||
| IPI / Intrepid Potash, Inc. | 0.01 | 0.54 | 0.4984 | 0.4984 | |||||
| MKSI / MKS Inc. | 0.01 | -42.37 | 0.54 | -48.41 | 0.4981 | -0.4053 | |||
| BCO / The Brink's Company | 0.01 | 96.68 | 0.52 | 71.80 | 0.4870 | 0.2215 | |||
| ALKT / Alkami Technology, Inc. | 0.02 | 0.07 | 0.51 | -7.08 | 0.4761 | -0.0033 | |||
| CSTL / Castle Biosciences, Inc. | 0.03 | -9.18 | 0.51 | -33.16 | 0.4722 | -0.1882 | |||
| CPF / Central Pacific Financial Corp. | 0.02 | 0.50 | 0.4682 | 0.4682 | |||||
| ACAD / ACADIA Pharmaceuticals Inc. | 0.02 | -49.99 | 0.50 | -45.01 | 0.4658 | -0.3260 | |||
| NGVT / Ingevity Corporation | 0.01 | 43.88 | 0.50 | 26.01 | 0.4642 | 0.0217 | |||
| PRO / PROS Holdings, Inc. | 0.03 | 0.50 | 0.4627 | 0.4627 | |||||
| WK / Workiva Inc. | 0.01 | 153.31 | 0.49 | 98.39 | 0.4590 | 0.2868 | |||
| AAT / American Assets Trust, Inc. | 0.02 | 2.27 | 0.49 | -9.07 | 0.4559 | -0.0139 | |||
| ZG / Zillow Group, Inc. | 0.01 | 44.69 | 0.48 | 28.95 | 0.4468 | 0.1220 | |||
| GBX / The Greenbrier Companies, Inc. | 0.01 | 0.48 | 0.4446 | 0.4446 | |||||
| BXC / BlueLinx Holdings Inc. | 0.01 | 1.34 | 0.46 | -14.44 | 0.4291 | -0.0408 | |||
| VCEL / Vericel Corporation | 0.01 | -4.74 | 0.46 | -23.41 | 0.4260 | -0.0937 | |||
| CSTM / Constellium SE | 0.04 | 171.21 | 0.46 | 189.24 | 0.4248 | 0.2874 | |||
| BCPC / Balchem Corporation | 0.00 | 0.46 | 0.4228 | 0.4228 | |||||
| SUPN / Supernus Pharmaceuticals, Inc. | 0.01 | 195.62 | 0.44 | 238.46 | 0.4089 | 0.2663 | |||
| GRC / The Gorman-Rupp Company | 0.01 | 0.73 | 0.43 | -3.77 | 0.4039 | 0.0119 | |||
| LYTS / LSI Industries Inc. | 0.03 | -2.57 | 0.43 | -14.23 | 0.3974 | -0.0363 | |||
| IRMD / IRADIMED CORPORATION | 0.01 | 2.09 | 0.42 | 9.66 | 0.3907 | 0.0572 | |||
| FSS / Federal Signal Corporation | 0.00 | 62.78 | 0.42 | 88.29 | 0.3888 | 0.1957 | |||
| QNST / QuinStreet, Inc. | 0.03 | 1.77 | 0.41 | -20.69 | 0.3849 | -0.0689 | |||
| NJR / New Jersey Resources Corporation | 0.01 | -3.84 | 0.41 | -8.65 | 0.3827 | -0.0099 | |||
| NRIM / Northrim BanCorp, Inc. | 0.00 | 0.41 | 0.3817 | 0.3817 | |||||
| QCRH / QCR Holdings, Inc. | 0.01 | 4.46 | 0.40 | -6.76 | 0.3720 | -0.0010 | |||
| REPX / Riley Exploration Permian, Inc. | 0.02 | 10.18 | 0.40 | -10.31 | 0.3717 | -0.0165 | |||
| SMG / The Scotts Miracle-Gro Company | 0.01 | 113.85 | 0.38 | -9.09 | 0.3535 | -0.1002 | |||
| BFST / Business First Bancshares, Inc. | 0.02 | 2.27 | 0.38 | -8.27 | 0.3500 | -0.0071 | |||
| AUB / Atlantic Union Bankshares Corporation | 0.01 | 0.38 | 0.3499 | 0.3499 | |||||
| XP / XP Inc. | 0.02 | 0.37 | 0.3465 | 0.3465 | |||||
| EE / Excelerate Energy, Inc. | 0.01 | 8.46 | 0.37 | -0.54 | 0.3439 | 0.0203 | |||
| CRC / California Resources Corporation | 0.01 | 5.43 | 0.37 | 4.27 | 0.3402 | 0.0352 | |||
| BVS / Bioventus Inc. | 0.06 | 5.59 | 0.37 | -32.53 | 0.3391 | -0.1311 | |||
| AXGN / Axogen, Inc. | 0.03 | 18.89 | 0.37 | 33.70 | 0.3390 | -0.1905 | |||
| ANF / Abercrombie & Fitch Co. | 0.00 | 27.61 | 0.36 | -2.67 | 0.3382 | 0.0128 | |||
| IMKTA / Ingles Markets, Incorporated | 0.01 | -0.36 | 0.36 | 1.11 | 0.3376 | 0.0250 | |||
| HNST / The Honest Company, Inc. | 0.07 | 8.63 | 0.34 | 1.18 | 0.3183 | 0.0240 | |||
| NWN / Northwest Natural Holding Company | 0.01 | -47.26 | 0.34 | -41.15 | 0.3149 | -0.0827 | |||
| STRA / Strategic Education, Inc. | 0.00 | 0.34 | 0.3128 | 0.3128 | |||||
| LFST / LifeStance Health Group, Inc. | 0.06 | 0.33 | 0.3099 | 0.3099 | |||||
| APPF / AppFolio, Inc. | 0.00 | -4.54 | 0.33 | -5.93 | 0.3092 | 0.0014 | |||
| IBOC / International Bancshares Corporation | 0.01 | 1.04 | 0.33 | -5.75 | 0.3052 | 0.0029 | |||
| MWA / Mueller Water Products, Inc. | 0.01 | -75.68 | 0.32 | -76.85 | 0.2992 | -0.9095 | |||
| SAFE / Safehold Inc. | 0.02 | 6.67 | 0.32 | -64.24 | 0.2970 | -0.6747 | |||
| PNTG / The Pennant Group, Inc. | 0.01 | -6.37 | 0.31 | 18.08 | 0.2852 | 0.0592 | |||
| XHR / Xenia Hotels & Resorts, Inc. | 0.02 | 439.55 | 0.31 | 369.23 | 0.2835 | 0.2307 | |||
| NWPX / NWPX Infrastructure, Inc. | 0.01 | 4.84 | 0.30 | -8.18 | 0.2819 | -0.0050 | |||
| PHR / Phreesia, Inc. | 0.01 | 0.30 | 0.2788 | 0.2788 | |||||
| LGND / Ligand Pharmaceuticals Incorporated | 0.00 | -72.95 | 0.29 | -77.44 | 0.2728 | -0.8560 | |||
| APOG / Apogee Enterprises, Inc. | 0.01 | -0.57 | 0.29 | -19.94 | 0.2692 | -0.0450 | |||
| CIVB / Civista Bancshares, Inc. | 0.01 | 0.58 | 0.29 | 9.96 | 0.2669 | 0.0400 | |||
| UMH / UMH Properties, Inc. | 0.02 | -2.63 | 0.28 | -13.50 | 0.2619 | -0.0218 | |||
| FELE / Franklin Electric Co., Inc. | 0.00 | 0.28 | 0.2588 | 0.2588 | |||||
| UIS / Unisys Corporation | 0.06 | -5.34 | 0.27 | 4.65 | 0.2515 | 0.0269 | |||
| LIND / Lindblad Expeditions Holdings, Inc. | 0.03 | 3.46 | 0.27 | -2.93 | 0.2469 | 0.0094 | |||
| CWENA / Clearway Energy Inc - Class A | 0.01 | -66.96 | 0.27 | -65.76 | 0.2464 | -0.3328 | |||
| BBWI / Bath & Body Works, Inc. | 0.01 | 129.76 | 0.27 | 79.05 | 0.2463 | 0.1171 | |||
| DAKT / Daktronics, Inc. | 0.02 | 14.65 | 0.25 | 11.45 | 0.2357 | 0.0379 | |||
| SPFI / South Plains Financial, Inc. | 0.01 | -1.45 | 0.25 | 0.81 | 0.2315 | 0.0162 | |||
| CMCL / Caledonia Mining Corporation Plc | 0.01 | -7.87 | 0.24 | 56.77 | 0.2264 | 0.0910 | |||
| GHM / Graham Corporation | 0.01 | 0.24 | 0.2235 | 0.2235 | |||||
| APPN / Appian Corporation | 0.01 | -0.43 | 0.24 | -3.64 | 0.2218 | 0.0070 | |||
| GCO / Genesco Inc. | 0.01 | 12.15 | 0.23 | -33.33 | 0.2178 | -0.0880 | |||
| RCKY / Rocky Brands, Inc. | 0.01 | -2.05 | 0.23 | 9.86 | 0.2174 | 0.0317 | |||
| US82983N1081 / Sitio Royalties Corp | 0.01 | 2.73 | 0.22 | -12.45 | 0.2033 | -0.0136 | |||
| HBNC / Horizon Bancorp, Inc. | 0.01 | 298.74 | 0.21 | 251.67 | 0.1960 | 0.1432 | |||
| CMRE / Costamare Inc. | 0.02 | 0.72 | 0.21 | -14.92 | 0.1959 | -0.0203 | |||
| TCBX / Third Coast Bancshares, Inc. | 0.01 | 0.75 | 0.20 | -13.73 | 0.1868 | -0.0159 | |||
| TRN / Trinity Industries, Inc. | 0.01 | -37.00 | 0.19 | -57.17 | 0.1810 | -0.1580 | |||
| MTH / Meritage Homes Corporation | 0.00 | -5.59 | 0.19 | -16.88 | 0.1784 | -0.0230 | |||
| VMD / Viemed Healthcare, Inc. | 0.03 | -4.82 | 0.19 | -19.23 | 0.1755 | -0.0279 | |||
| FBIZ / First Business Financial Services, Inc. | 0.00 | -0.13 | 0.19 | -8.78 | 0.1745 | -0.0036 | |||
| HAFC / Hanmi Financial Corporation | 0.01 | -68.83 | 0.18 | -70.24 | 0.1700 | -0.3646 | |||
| WLFC / Willis Lease Finance Corporation | 0.00 | 0.18 | 0.1661 | 0.1661 | |||||
| CBNK / Capital Bancorp, Inc. | 0.01 | 0.18 | 0.1630 | 0.1630 | |||||
| VNOM / Viper Energy, Inc. | 0.00 | -43.66 | 0.17 | -51.93 | 0.1616 | -0.1533 | |||
| SMBK / SmartFinancial, Inc. | 0.00 | 0.14 | 0.1333 | 0.1333 | |||||
| UTMD / Utah Medical Products, Inc. | 0.00 | -5.48 | 0.14 | -12.82 | 0.1270 | -0.0091 | |||
| RMR / The RMR Group Inc. | 0.01 | -4.07 | 0.13 | -20.86 | 0.1207 | -0.0213 | |||
| ICHR / Ichor Holdings, Ltd. | 0.01 | 16.30 | 0.13 | -37.44 | 0.1183 | -0.0584 | |||
| NECB / Northeast Community Bancorp, Inc. | 0.01 | 0.13 | 0.1179 | 0.1179 | |||||
| UFPT / UFP Technologies, Inc. | 0.00 | -47.43 | 0.12 | -45.78 | 0.1135 | -0.0828 | |||
| BLFS / BioLife Solutions, Inc. | 0.01 | 1.22 | 0.12 | -7.63 | 0.1130 | -0.0016 | |||
| DSP / Viant Technology Inc. | 0.01 | -65.45 | 0.12 | -76.27 | 0.1129 | -0.3303 | |||
| RUSHB / Rush Enterprises, Inc. | 0.00 | -4.16 | 0.12 | -12.12 | 0.1084 | -0.0070 | |||
| HCAT / Health Catalyst, Inc. | 0.03 | 1.41 | 0.10 | -16.94 | 0.0957 | -0.0128 | |||
| USNA / USANA Health Sciences, Inc. | 0.00 | 0.79 | 0.10 | 2.00 | 0.0953 | 0.0077 | |||
| ANDE / The Andersons, Inc. | 0.00 | -78.68 | 0.10 | -84.13 | 0.0920 | -0.3753 | |||
| AL / Air Lease Corporation | 0.00 | -95.15 | 0.09 | -93.09 | 0.0881 | -0.8506 | |||
| PMTS / CPI Card Group Inc. | 0.00 | 2.86 | 0.09 | -31.58 | 0.0846 | -0.0311 | |||
| FOXF / Fox Factory Holding Corp. | 0.00 | 0.09 | 0.0831 | 0.0831 | |||||
| BFS / Saul Centers, Inc. | 0.00 | 0.09 | 0.0789 | 0.0789 | |||||
| WFRD / Weatherford International plc | 0.00 | 11.96 | 0.08 | -21.50 | 0.0785 | -0.0146 | |||
| ANIP / ANI Pharmaceuticals, Inc. | 0.00 | -92.40 | 0.08 | -92.80 | 0.0782 | -0.9357 | |||
| SKT / Tanger Inc. | 0.00 | 0.08 | 0.0768 | 0.0768 | |||||
| VLGEA / Village Super Market, Inc. | 0.00 | -3.31 | 0.07 | 19.67 | 0.0681 | 0.0143 | |||
| COLL / Collegium Pharmaceutical, Inc. | 0.00 | -69.18 | 0.07 | -69.26 | 0.0663 | -0.1344 | |||
| MXL / MaxLinear, Inc. | 0.01 | 168.84 | 0.07 | 65.85 | 0.0631 | 0.0223 | |||
| NGS / Natural Gas Services Group, Inc. | 0.00 | 1.88 | 0.07 | -5.63 | 0.0626 | 0.0009 | |||
| RYAM / Rayonier Advanced Materials Inc. | 0.02 | 18.82 | 0.07 | -40.37 | 0.0604 | -0.0347 | |||
| MMI / Marcus & Millichap, Inc. | 0.00 | -58.60 | 0.06 | -59.59 | 0.0554 | -0.1085 | |||
| INFU / InfuSystem Holdings, Inc. | 0.01 | 1.91 | 0.06 | -26.25 | 0.0549 | -0.0147 | |||
| AEYE / AudioEye, Inc. | 0.00 | 0.44 | 0.06 | -4.84 | 0.0548 | 0.0004 | |||
| CARE / Carter Bankshares, Inc. | 0.00 | 0.00 | 0.06 | -6.45 | 0.0546 | 0.0007 | |||
| AVNS / Avanos Medical, Inc. | 0.00 | -40.71 | 0.05 | -69.66 | 0.0503 | -0.1485 | |||
| FSBW / FS Bancorp, Inc. | 0.00 | 0.00 | 0.05 | -1.82 | 0.0502 | 0.0020 | |||
| CIO / City Office REIT, Inc. | 0.01 | -1.15 | 0.05 | -7.02 | 0.0493 | -0.0010 | |||
| SEMR / Semrush Holdings, Inc. | 0.00 | 0.36 | 0.05 | -9.80 | 0.0432 | -0.0018 | |||
| Costamare Bulkers Holdings Ltd / EC (MHY2001C1012) | 0.00 | 0.05 | 0.0428 | 0.0428 | |||||
| PLAB / Photronics, Inc. | 0.00 | 6.47 | 0.04 | -14.00 | 0.0404 | -0.0039 | |||
| CCS / Century Communities, Inc. | 0.00 | 2.33 | 0.04 | -23.21 | 0.0402 | -0.0090 | |||
| VIRC / Virco Mfg. Corporation | 0.00 | -4.86 | 0.03 | -21.95 | 0.0301 | -0.0061 | |||
| TGNA / TEGNA Inc. | 0.00 | -100.00 | 0.00 | -100.00 | -0.5790 | ||||
| VBTX / Veritex Holdings, Inc. | 0.00 | -100.00 | 0.00 | -100.00 | -0.2148 | ||||
| SKWD / Skyward Specialty Insurance Group, Inc. | 0.00 | -100.00 | 0.00 | -100.00 | -1.1306 | ||||
| SNV / Synovus Financial Corp. | 0.00 | -100.00 | 0.00 | -100.00 | -1.0746 | ||||
| RMBS / Rambus Inc. | 0.00 | -100.00 | 0.00 | -100.00 | -0.2430 | ||||
| FARO / FARO Technologies, Inc. | 0.00 | -100.00 | 0.00 | -100.00 | -0.0632 | ||||
| NTCT / NetScout Systems, Inc. | 0.00 | -100.00 | 0.00 | -100.00 | -0.6354 | ||||
| JILL / J.Jill, Inc. | 0.00 | -100.00 | 0.00 | -100.00 | -0.0981 | ||||
| CTBI / Community Trust Bancorp, Inc. | 0.00 | -100.00 | 0.00 | -100.00 | -0.2184 | ||||
| PATH / UiPath Inc. | 0.00 | -100.00 | 0.00 | -100.00 | -0.2631 |