Basic Stats
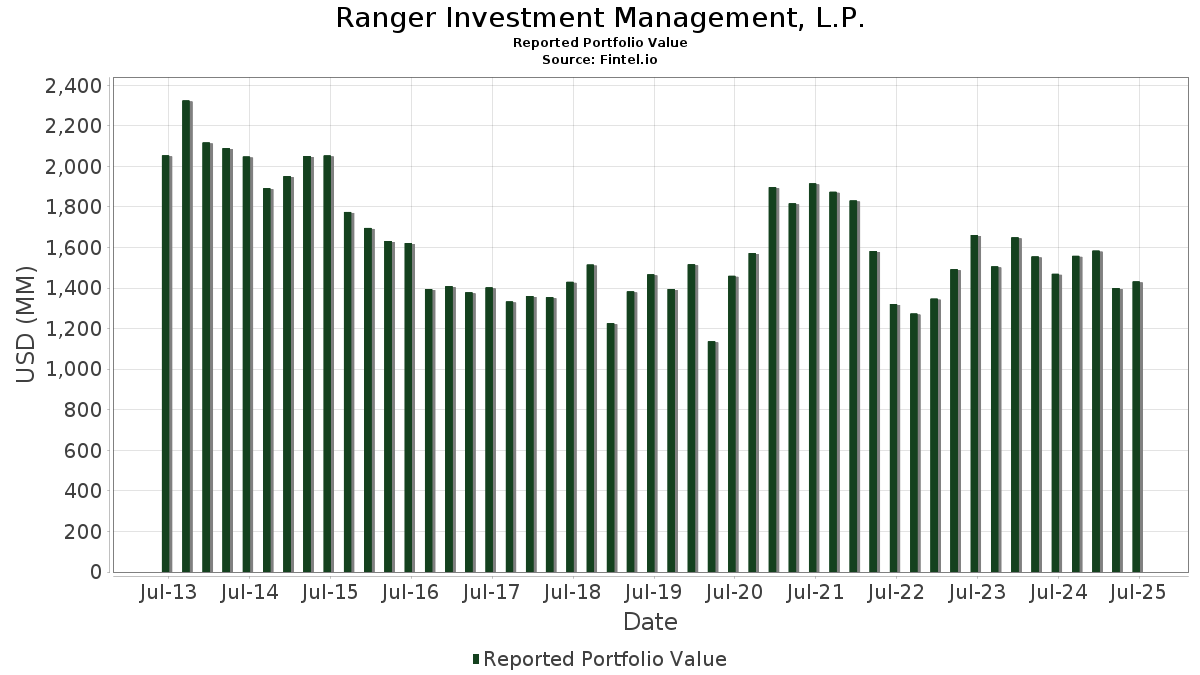
| Portfolio Value | $ 1,431,956,194 |
| Current Positions | 72 |
Latest Holdings, Performance, AUM (from 13F, 13D)
Ranger Investment Management, L.P. has disclosed 72 total holdings in their latest SEC filings. Most recent portfolio value is calculated to be $ 1,431,956,194 USD. Actual Assets Under Management (AUM) is this value plus cash (which is not disclosed). Ranger Investment Management, L.P.’s top holdings are Pegasystems Inc. (US:PEGA) , Texas Roadhouse, Inc. (US:TXRH) , Excelerate Energy, Inc. (US:EE) , ADMA Biologics, Inc. (US:ADMA) , and LeMaitre Vascular, Inc. (US:LMAT) . Ranger Investment Management, L.P.’s new positions include Warby Parker Inc. (US:WRBY) , Jones Lang LaSalle Incorporated (US:JLL) , Birkenstock Holding plc (US:BIRK) , Argan, Inc. (DE:1AW) , and . Ranger Investment Management, L.P.’s top industries are "Paper And Allied Products" (sic 26) , "Transportation Services" (sic 47) , and "Wholesale Trade-non-durable Goods" (sic 51) .
Top Increases This Quarter
We use the change in the portfolio allocation because this is the most meaningful metric. Changes can be due to trades or changes in share prices.
| Security | Shares (MM) |
Value (MM$) |
Portfolio % | ΔPortfolio % |
|---|---|---|---|---|
| 1.01 | 22.20 | 1.5502 | 1.5502 | |
| 1.32 | 32.27 | 2.2538 | 1.3991 | |
| 0.06 | 20.82 | 1.4539 | 1.1074 | |
| 1.12 | 60.70 | 4.2389 | 1.0710 | |
| 0.42 | 30.96 | 2.1619 | 1.0540 | |
| 0.39 | 40.98 | 2.8619 | 1.0074 | |
| 0.30 | 34.11 | 2.3818 | 0.9535 | |
| 0.05 | 12.69 | 0.8865 | 0.8865 | |
| 2.39 | 43.53 | 3.0398 | 0.7662 | |
| 0.19 | 9.47 | 0.6611 | 0.6611 |
Top Decreases This Quarter
We use the change in the portfolio allocation because this is the most meaningful metric. Changes can be due to trades or changes in share prices.
| Security | Shares (MM) |
Value (MM$) |
Portfolio % | ΔPortfolio % |
|---|---|---|---|---|
| 0.21 | 12.92 | 0.9020 | -1.1992 | |
| 1.33 | 27.06 | 1.8894 | -1.1405 | |
| 1.46 | 19.85 | 1.3864 | -0.9676 | |
| 0.56 | 12.61 | 0.8807 | -0.9535 | |
| 1.32 | 31.20 | 2.1785 | -0.7713 | |
| 0.39 | 6.74 | 0.4706 | -0.7473 | |
| 0.30 | 34.56 | 2.4138 | -0.5856 | |
| 0.17 | 20.89 | 1.4586 | -0.5667 | |
| 0.21 | 20.19 | 1.4100 | -0.5488 | |
| 0.28 | 29.59 | 2.0666 | -0.5459 |
13D/G Filings
This is a list of 13D and 13G filings made in the last year (if any). Click the link icon to see the full transaction history. Green rows indicate new positions. Red rows indicate closed positions.
| File Date | Form | Security | Prev Shares |
Current Shares |
ΔShares % | % Ownership |
% ΔOwnership | |
|---|---|---|---|---|---|---|---|---|
| 2025-05-06 | ARIS / Aris Water Solutions, Inc. | 1,325,785 | 1,340,838 | 1.14 | 4.37 | -12.60 |
13F and Fund Filings
This form was filed on 2025-08-19 for the reporting period 2025-06-30. Click the link icon to see the full transaction history.
Upgrade to unlock premium data and export to Excel ![]() .
.
| Security | Type | Avg Share Price | Shares (MM) |
ΔShares (%) |
ΔShares (%) |
Value ($MM) |
Portfolio (%) |
ΔPortfolio (%) |
|
|---|---|---|---|---|---|---|---|---|---|
| PEGA / Pegasystems Inc. | 1.12 | 75.87 | 60.70 | 36.94 | 4.2389 | 1.0710 | |||
| TXRH / Texas Roadhouse, Inc. | 0.29 | -5.17 | 53.47 | 6.66 | 3.7340 | 0.1514 | |||
| EE / Excelerate Energy, Inc. | 1.66 | -2.77 | 48.55 | -0.60 | 3.3904 | -0.1002 | |||
| ADMA / ADMA Biologics, Inc. | 2.39 | 49.07 | 43.53 | 36.82 | 3.0398 | 0.7662 | |||
| LMAT / LeMaitre Vascular, Inc. | 0.51 | -1.61 | 42.69 | -2.61 | 2.9815 | -0.1515 | |||
| FSS / Federal Signal Corporation | 0.39 | 9.15 | 40.98 | 57.93 | 2.8619 | 1.0074 | |||
| ANIP / ANI Pharmaceuticals, Inc. | 0.53 | -6.54 | 34.86 | -8.92 | 2.4343 | -0.3007 | |||
| CWST / Casella Waste Systems, Inc. | 0.30 | -20.41 | 34.56 | -17.64 | 2.4138 | -0.5856 | |||
| LGND / Ligand Pharmaceuticals Incorporated | 0.30 | 57.83 | 34.11 | 70.65 | 2.3818 | 0.9535 | |||
| PCTY / Paylocity Holding Corporation | 0.18 | -5.07 | 32.43 | -8.19 | 2.2649 | -0.2596 | |||
| APPF / AppFolio, Inc. | 0.14 | 17.36 | 32.40 | 22.89 | 2.2624 | 0.3785 | |||
| STVN / Stevanato Group S.p.A. | 1.32 | 125.58 | 32.27 | 169.88 | 2.2538 | 1.3991 | |||
| AAON / AAON, Inc. | 0.43 | 14.07 | 32.00 | 7.68 | 2.2350 | 0.1109 | |||
| IIIV / i3 Verticals, Inc. | 1.15 | 0.31 | 31.50 | 11.73 | 2.1996 | 0.1850 | |||
| ARIS / Aris Water Solutions, Inc. | 1.32 | 2.39 | 31.20 | -24.42 | 2.1785 | -0.7713 | |||
| ULS / UL Solutions Inc. | 0.42 | 54.58 | 30.96 | 99.70 | 2.1619 | 1.0540 | |||
| HQY / HealthEquity, Inc. | 0.28 | -31.71 | 29.59 | -19.05 | 2.0666 | -0.5459 | |||
| GWRE / Guidewire Software, Inc. | 0.12 | -5.07 | 29.14 | 19.30 | 2.0348 | 0.2893 | |||
| CHE / Chemed Corporation | 0.06 | 13.31 | 28.97 | -10.34 | 2.0234 | -0.2859 | |||
| BOOT / Boot Barn Holdings, Inc. | 0.19 | -2.69 | 28.75 | 37.68 | 2.0080 | 0.5154 | |||
| OSW / OneSpaWorld Holdings Limited | 1.33 | -47.45 | 27.06 | -36.18 | 1.8894 | -1.1405 | |||
| SFM / Sprouts Farmers Market, Inc. | 0.15 | -22.59 | 24.75 | -16.51 | 1.7285 | -0.3901 | |||
| LAZ / Lazard, Inc. | 0.51 | 43.48 | 24.25 | 58.99 | 1.6934 | 0.6034 | |||
| HOMB / Home Bancshares, Inc. (Conway, AR) | 0.85 | -5.13 | 24.14 | -4.49 | 1.6855 | -0.1205 | |||
| JJSF / J&J Snack Foods Corp. | 0.20 | 52.36 | 22.74 | 31.18 | 1.5883 | 0.3492 | |||
| PDFS / PDF Solutions, Inc. | 1.05 | 19.21 | 22.35 | 33.36 | 1.5611 | 0.3632 | |||
| WRBY / Warby Parker Inc. | 1.01 | 22.20 | 1.5502 | 1.5502 | |||||
| WSC / WillScot Holdings Corporation | 0.81 | -5.15 | 22.12 | -6.51 | 1.5445 | -0.1462 | |||
| NCNO / nCino, Inc. | 0.78 | 24.15 | 21.85 | 26.41 | 1.5260 | 0.2906 | |||
| MEDP / Medpace Holdings, Inc. | 0.07 | -5.13 | 21.26 | -2.28 | 1.4849 | -0.0701 | |||
| RGEN / Repligen Corporation | 0.17 | -24.60 | 20.89 | -26.30 | 1.4586 | -0.5667 | |||
| WING / Wingstop Inc. | 0.06 | 187.64 | 20.82 | 329.41 | 1.4539 | 1.1074 | |||
| TFIN / Triumph Financial, Inc. | 0.37 | -2.10 | 20.28 | -6.66 | 1.4161 | -0.1365 | |||
| MLAB / Mesa Laboratories, Inc. | 0.21 | -7.23 | 20.19 | -26.34 | 1.4100 | -0.5488 | |||
| PR / Permian Resources Corporation | 1.46 | -38.71 | 19.85 | -39.73 | 1.3864 | -0.9676 | |||
| MMSI / Merit Medical Systems, Inc. | 0.21 | 28.04 | 19.66 | 13.23 | 1.3732 | 0.1321 | |||
| MNDY / monday.com Ltd. | 0.06 | 27.11 | 18.26 | 64.40 | 1.2754 | 0.4814 | |||
| SSD / Simpson Manufacturing Co., Inc. | 0.12 | -5.09 | 18.06 | -6.16 | 1.2612 | -0.1142 | |||
| SAIA / Saia, Inc. | 0.06 | -5.08 | 16.09 | -25.57 | 1.1235 | -0.4212 | |||
| WK / Workiva Inc. | 0.22 | -5.06 | 15.31 | -14.40 | 1.0689 | -0.2089 | |||
| KRUS / Kura Sushi USA, Inc. | 0.15 | 7.82 | 13.33 | 81.27 | 0.9307 | 0.4053 | |||
| OZK / Bank OZK | 0.28 | 8.01 | 13.32 | 16.99 | 0.9299 | 0.1164 | |||
| MSA / MSA Safety Incorporated | 0.08 | -4.98 | 12.95 | 8.52 | 0.9044 | 0.0515 | |||
| SKY / Champion Homes, Inc. | 0.21 | -33.51 | 12.92 | -56.07 | 0.9020 | -1.1992 | |||
| IRMD / IRADIMED CORPORATION | 0.21 | 7.36 | 12.85 | 22.32 | 0.8970 | 0.1465 | |||
| OII / Oceaneering International, Inc. | 0.61 | -31.23 | 12.73 | -34.66 | 0.8888 | -0.5033 | |||
| JLL / Jones Lang LaSalle Incorporated | 0.05 | 12.69 | 0.8865 | 0.8865 | |||||
| MGY / Magnolia Oil & Gas Corporation | 0.56 | -44.79 | 12.61 | -50.86 | 0.8807 | -0.9535 | |||
| CADE / Cadence Bank | 0.37 | -5.13 | 11.90 | -0.06 | 0.8307 | -0.0200 | |||
| MCB / Metropolitan Bank Holding Corp. | 0.15 | 7.41 | 10.54 | 34.29 | 0.7357 | 0.1751 | |||
| BLD / TopBuild Corp. | 0.03 | -5.30 | 9.98 | 0.53 | 0.6971 | -0.0125 | |||
| BIRK / Birkenstock Holding plc | 0.19 | 9.47 | 0.6611 | 0.6611 | |||||
| UFPT / UFP Technologies, Inc. | 0.04 | 22.55 | 9.39 | 48.35 | 0.6559 | 0.2034 | |||
| PAHC / Phibro Animal Health Corporation | 0.36 | 101.11 | 9.14 | 140.52 | 0.6385 | 0.3668 | |||
| PNTG / The Pennant Group, Inc. | 0.30 | 56.57 | 9.10 | 85.87 | 0.6356 | 0.2856 | |||
| VITL / Vital Farms, Inc. | 0.24 | 7.37 | 9.10 | 35.75 | 0.6352 | 0.1563 | |||
| KRT / Karat Packaging Inc. | 0.32 | 105.70 | 9.03 | 117.91 | 0.6304 | 0.3344 | |||
| BFST / Business First Bancshares, Inc. | 0.34 | 7.41 | 8.47 | 8.74 | 0.5917 | 0.0348 | |||
| PLOW / Douglas Dynamics, Inc. | 0.28 | 58.21 | 8.21 | 100.71 | 0.5736 | 0.2811 | |||
| NVEC / NVE Corporation | 0.11 | 7.41 | 8.21 | 24.05 | 0.5732 | 0.1003 | |||
| COCO / The Vita Coco Company, Inc. | 0.23 | 7.26 | 8.13 | 26.33 | 0.5677 | 0.1078 | |||
| LMB / Limbach Holdings, Inc. | 0.05 | -16.34 | 7.65 | 57.40 | 0.5345 | 0.1870 | |||
| SLP / Simulations Plus, Inc. | 0.39 | -44.43 | 6.74 | -60.46 | 0.4706 | -0.7473 | |||
| BLFS / BioLife Solutions, Inc. | 0.29 | -14.26 | 6.22 | -19.13 | 0.4345 | -0.1154 | |||
| QNST / QuinStreet, Inc. | 0.36 | 26.37 | 5.80 | 14.06 | 0.4050 | 0.0416 | |||
| EPM / Evolution Petroleum Corporation | 1.15 | 7.43 | 5.39 | -2.53 | 0.3763 | -0.0188 | |||
| PWP / Perella Weinberg Partners | 0.25 | 8.41 | 4.81 | 14.40 | 0.3356 | 0.0354 | |||
| CVLG / Covenant Logistics Group, Inc. | 0.18 | 4.45 | 0.3108 | 0.3108 | |||||
| GRBK / Green Brick Partners, Inc. | 0.06 | 7.33 | 3.66 | 15.75 | 0.2556 | 0.0296 | |||
| WTTR / Select Water Solutions, Inc. | 0.38 | 7.45 | 3.24 | -11.58 | 0.2266 | -0.0357 | |||
| 1AW / Argan, Inc. | 0.01 | 2.95 | 0.2059 | 0.2059 | |||||
| NCMI / National CineMedia, Inc. | 0.46 | -25.24 | 2.21 | -37.98 | 0.1542 | -0.1002 | |||
| AZEK / The AZEK Company Inc. | 0.00 | -100.00 | 0.00 | 0.0000 | |||||
| INFU / InfuSystem Holdings, Inc. | 0.00 | -100.00 | 0.00 | 0.0000 | |||||
| KWR / Quaker Chemical Corporation | 0.00 | -100.00 | 0.00 | 0.0000 | |||||
| SHOO / Steven Madden, Ltd. | 0.00 | -100.00 | 0.00 | 0.0000 | |||||
| MITK / Mitek Systems, Inc. | 0.00 | -100.00 | 0.00 | 0.0000 | |||||
| DV / DoubleVerify Holdings, Inc. | 0.00 | -100.00 | 0.00 | 0.0000 | |||||
| RPAY / Repay Holdings Corporation | 0.00 | -100.00 | 0.00 | 0.0000 | |||||
| ELF / e.l.f. Beauty, Inc. | 0.00 | -100.00 | 0.00 | 0.0000 |