Basic Stats
| Insider Profile | PFIZER INC |
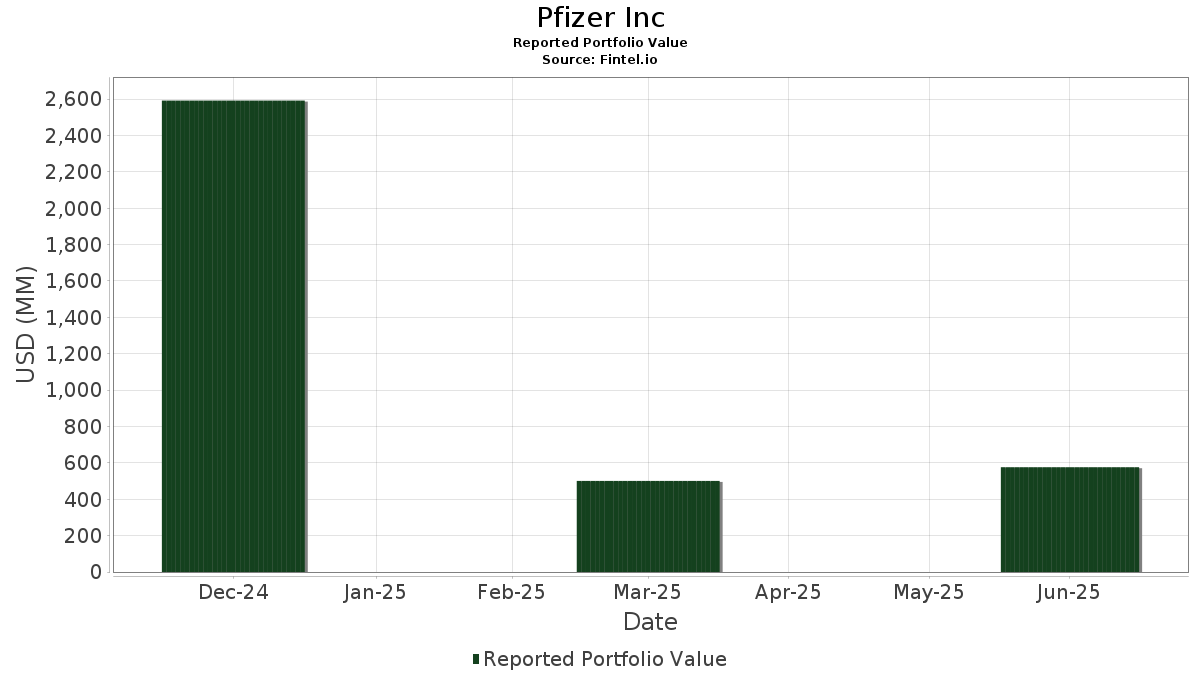
| Portfolio Value | $ 576,193,012 |
| Current Positions | 21 |
Latest Holdings, Performance, AUM (from 13F, 13D)
Pfizer Inc has disclosed 21 total holdings in their latest SEC filings. Most recent portfolio value is calculated to be $ 576,193,012 USD. Actual Assets Under Management (AUM) is this value plus cash (which is not disclosed). Pfizer Inc’s top holdings are BioNTech SE - Depositary Receipt (Common Stock) (US:BNTX) , ORIC Pharmaceuticals, Inc. (US:ORIC) , Arvinas, Inc. (US:ARVN) , Allogene Therapeutics, Inc. (US:ALLO) , and Tourmaline Bio, Inc. (US:TRML) . Pfizer Inc’s new positions include Bolt Biotherapeutics, Inc. (US:BOLT) , . Pfizer Inc’s top industries are "Chemicals And Allied Products" (sic 28) , and "Measuring, Analyzing, And Controlling Instruments; Photographic, Medical And Optical Goods; Watches And Clocks" (sic 38) .
Top Increases This Quarter
We use the change in the portfolio allocation because this is the most meaningful metric. Changes can be due to trades or changes in share prices.
| Security | Shares (MM) |
Value (MM$) |
Portfolio % | ΔPortfolio % |
|---|---|---|---|---|
| 5.38 | 54.57 | 9.4708 | 3.4808 | |
| 3.66 | 389.51 | 67.5999 | 1.0851 | |
| 2.36 | 6.85 | 1.1753 | 0.8357 | |
| 4.69 | 5.91 | 1.0139 | 0.1588 | |
| 0.35 | 4.66 | 0.8002 | 0.0949 | |
| 0.03 | 0.18 | 0.0313 | 0.0313 | |
| 0.00 | 0.03 | 0.0057 | 0.0023 |
Top Decreases This Quarter
We use the change in the portfolio allocation because this is the most meaningful metric. Changes can be due to trades or changes in share prices.
| Security | Shares (MM) |
Value (MM$) |
Portfolio % | ΔPortfolio % |
|---|---|---|---|---|
| 22.03 | 24.90 | 4.3208 | -2.1018 | |
| 0.51 | 7.13 | 1.2240 | -1.2031 | |
| 1.88 | 12.19 | 2.0909 | -0.9341 | |
| 3.46 | 25.45 | 4.3661 | -0.4806 | |
| 1.27 | 20.34 | 3.4900 | -0.3736 | |
| 2.97 | 3.12 | 0.5412 | -0.2238 | |
| 2.41 | 7.60 | 1.3184 | -0.1936 | |
| 0.95 | 1.11 | 0.1920 | -0.1108 | |
| 0.72 | 0.76 | 0.1316 | -0.0626 | |
| 7.03 | 7.74 | 1.3272 | -0.0488 |
13D/G Filings
This is a list of 13D and 13G filings made in the last year (if any). Click the link icon to see the full transaction history. Green rows indicate new positions. Red rows indicate closed positions.
| File Date | Form | Security | Prev Shares |
Current Shares |
ΔShares % | % Ownership |
% ΔOwnership | |
|---|---|---|---|---|---|---|---|---|
| 2025-03-24 | HLN / Haleon plc - Depositary Receipt (Common Stock) | 661,709,764 | 0 | -100.00 | 0.00 | -100.00 | ||
| 2025-02-12 | CRDF / Cardiff Oncology, Inc. | 2,411,575 | 2,411,575 | 0.00 | 3.60 | -37.39 | ||
| 2025-02-12 | ZURA / Zura Bio Limited | 2,970,022 | 2,970,022 | 0.00 | 4.60 | -57.33 |
13F and Fund Filings
This form was filed on 2025-08-11 for the reporting period 2025-06-30. Click the link icon to see the full transaction history.
Upgrade to unlock premium data and export to Excel ![]() .
.
| Security | Type | Avg Share Price | Shares (MM) |
ΔShares (%) |
ΔShares (%) |
Value ($MM) |
Portfolio (%) |
ΔPortfolio (%) |
|
|---|---|---|---|---|---|---|---|---|---|
| BNTX / BioNTech SE - Depositary Receipt (Common Stock) | 3.66 | 0.00 | 389.51 | 16.92 | 67.5999 | 1.0851 | |||
| ORIC / ORIC Pharmaceuticals, Inc. | 5.38 | 0.00 | 54.57 | 81.90 | 9.4708 | 3.4808 | |||
| ARVN / Arvinas, Inc. | 3.46 | 0.00 | 25.45 | 4.84 | 4.3661 | -0.4806 | |||
| ALLO / Allogene Therapeutics, Inc. | 22.03 | 0.00 | 24.90 | -22.60 | 4.3208 | -2.1018 | |||
| TRML / Tourmaline Bio, Inc. | 1.27 | 0.00 | 20.34 | 5.13 | 3.4900 | -0.3736 | |||
| WVE / Wave Life Sciences Ltd. | 1.88 | 0.00 | 12.19 | -19.56 | 2.0909 | -0.9341 | |||
| PYXS / Pyxis Oncology, Inc. | 7.03 | 0.00 | 7.74 | 12.26 | 1.3272 | -0.0488 | |||
| CRDF / Cardiff Oncology, Inc. | 2.41 | 0.00 | 7.60 | 0.32 | 1.3184 | -0.1936 | |||
| BHVN / Biohaven Ltd. | 0.51 | 0.00 | 7.13 | -41.31 | 1.2240 | -1.2031 | |||
| SPRO / Spero Therapeutics, Inc. | 2.36 | 0.00 | 6.85 | 302.94 | 1.1753 | 0.8357 | |||
| CRBU / Caribou Biosciences, Inc. | 4.69 | 0.00 | 5.91 | 38.00 | 1.0139 | 0.1588 | |||
| CELC / Celcuity Inc. | 0.35 | 0.00 | 4.66 | 32.05 | 0.8002 | 0.0949 | |||
| ZURA / Zura Bio Limited | 2.97 | 0.00 | 3.12 | -18.61 | 0.5412 | -0.2238 | |||
| EPIX / ESSA Pharma Inc. | 1.68 | 0.00 | 2.85 | 7.60 | 0.4942 | -0.0342 | |||
| ZNTL / Zentalis Pharmaceuticals, Inc. | 0.95 | 0.00 | 1.11 | -27.04 | 0.1920 | -0.1108 | |||
| NXTC / NextCure, Inc. | 0.16 | -91.67 | 0.87 | -4.19 | 0.1493 | -0.0321 | |||
| ANTX / AN2 Therapeutics, Inc. | 0.72 | 0.00 | 0.76 | -22.02 | 0.1316 | -0.0626 | |||
| QTTB / Q32 Bio Inc. | 0.28 | 0.00 | 0.41 | -9.83 | 0.0718 | -0.0197 | |||
| BOLT / Bolt Biotherapeutics, Inc. | 0.03 | 0.18 | 0.0313 | 0.0313 | |||||
| DNA / Ginkgo Bioworks Holdings, Inc. | 0.00 | 0.00 | 0.03 | 100.00 | 0.0057 | 0.0023 | |||
| SENS / Senseonics Holdings, Inc. | 0.04 | 0.00 | 0.02 | -28.57 | 0.0036 | -0.0021 | |||
| BOLT / Bolt Biotherapeutics, Inc. | 0.00 | -100.00 | 0.00 | 0.0000 |