Basic Stats
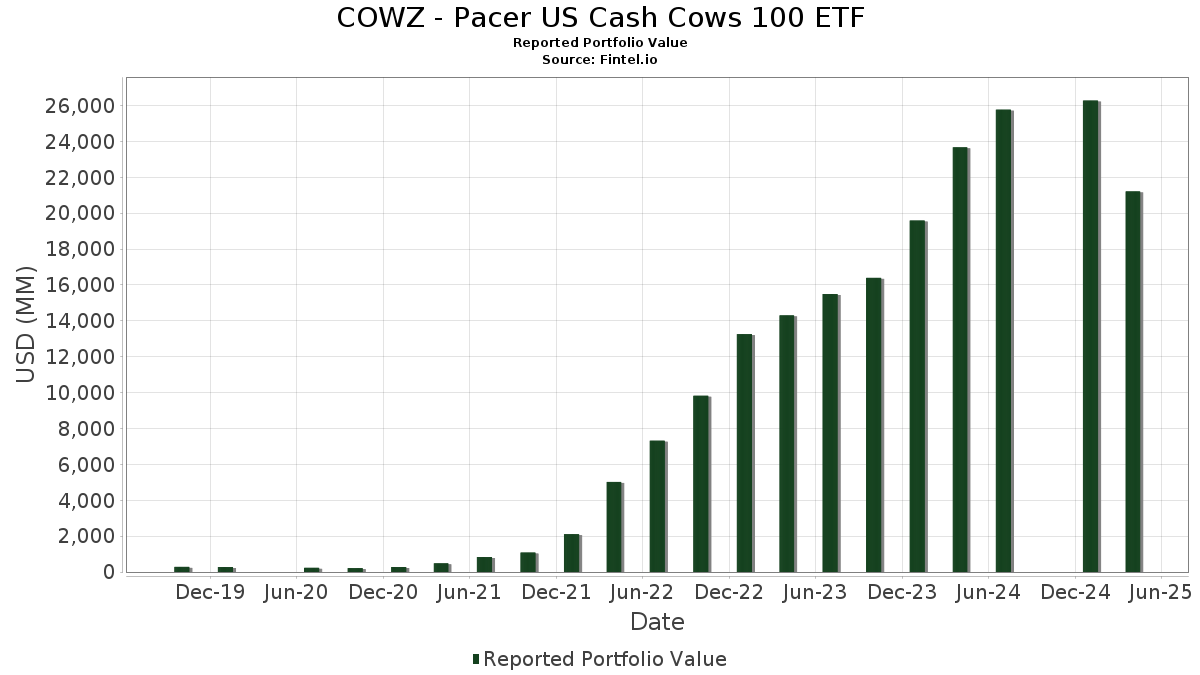
| Portfolio Value | $ 21,214,411,596 |
| Current Positions | 102 |
Latest Holdings, Performance, AUM (from 13F, 13D)
COWZ - Pacer US Cash Cows 100 ETF has disclosed 102 total holdings in their latest SEC filings. Most recent portfolio value is calculated to be $ 21,214,411,596 USD. Actual Assets Under Management (AUM) is this value plus cash (which is not disclosed). COWZ - Pacer US Cash Cows 100 ETF’s top holdings are Booking Holdings Inc. (US:BKNG) , Uber Technologies, Inc. (US:UBER) , Altria Group, Inc. (US:MO) , AT&T Inc. (US:T) , and Ford Motor Company (US:F) . COWZ - Pacer US Cash Cows 100 ETF’s new positions include Uber Technologies, Inc. (US:UBER) , Verizon Communications Inc. (US:VZ) , Salesforce, Inc. (US:CRM) , Johnson & Johnson (US:JNJ) , and Applied Materials, Inc. (US:AMAT) .
Top Increases This Quarter
We use the change in the portfolio allocation because this is the most meaningful metric. Changes can be due to trades or changes in share prices.
| Security | Shares (MM) |
Value (MM$) |
Portfolio % | ΔPortfolio % |
|---|---|---|---|---|
| 5.96 | 482.69 | 2.2955 | 2.2955 | |
| 9.87 | 434.70 | 2.0672 | 2.0672 | |
| 1.26 | 433.63 | 2.0622 | 2.0622 | |
| 1.61 | 431.70 | 2.0530 | 2.0530 | |
| 2.73 | 426.18 | 2.0267 | 2.0267 | |
| 2.80 | 422.72 | 2.0103 | 2.0103 | |
| 1.87 | 418.69 | 1.9911 | 1.9911 | |
| 12.09 | 413.44 | 1.9661 | 1.9661 | |
| 4.80 | 409.09 | 1.9454 | 1.9454 | |
| 1.40 | 407.06 | 1.9358 | 1.9358 |
Top Decreases This Quarter
We use the change in the portfolio allocation because this is the most meaningful metric. Changes can be due to trades or changes in share prices.
| Security | Shares (MM) |
Value (MM$) |
Portfolio % | ΔPortfolio % |
|---|---|---|---|---|
| 0.00 | 0.00 | -2.0914 | ||
| 1.87 | 108.88 | 0.5178 | -1.4330 | |
| 0.00 | 0.00 | -1.2754 | ||
| 0.00 | 0.00 | -1.2634 | ||
| 7.67 | 124.39 | 0.5915 | -1.2332 | |
| 7.12 | 141.09 | 0.6710 | -1.1936 | |
| 1.57 | 198.86 | 0.9457 | -1.1601 | |
| 1.07 | 109.91 | 0.5227 | -1.0542 | |
| 0.00 | 0.00 | -1.0512 | ||
| 0.82 | 97.68 | 0.4645 | -1.0453 |
13F and Fund Filings
This form was filed on 2025-06-30 for the reporting period 2025-04-30. Click the link icon to see the full transaction history.
Upgrade to unlock premium data and export to Excel ![]() .
.
| Security | Type | Avg Share Price | Shares (MM) |
ΔShares (%) |
ΔShares (%) |
Value ($MM) |
Portfolio (%) |
ΔPortfolio (%) |
|
|---|---|---|---|---|---|---|---|---|---|
| BKNG / Booking Holdings Inc. | 0.10 | -16.01 | 495.74 | 22.11 | 2.3575 | 0.2200 | |||
| UBER / Uber Technologies, Inc. | 5.96 | 482.69 | 2.2955 | 2.2955 | |||||
| MO / Altria Group, Inc. | 7.86 | -14.12 | 465.12 | -2.74 | 2.2119 | 0.3326 | |||
| T / AT&T Inc. | 16.76 | -23.76 | 464.14 | -11.00 | 2.2073 | 0.1578 | |||
| F / Ford Motor Company | 45.90 | 3,034.83 | 459.48 | 1,737.24 | 2.1851 | -0.4787 | |||
| MPC / Marathon Petroleum Corporation | 3.28 | -5.68 | 450.66 | -11.05 | 2.1431 | 0.1521 | |||
| COP / ConocoPhillips | 5.01 | -1.39 | 446.86 | -11.07 | 2.1251 | 0.1503 | |||
| XOM / Exxon Mobil Corporation | 4.17 | -9.79 | 440.33 | -10.80 | 2.0940 | 0.1540 | |||
| VZ / Verizon Communications Inc. | 9.87 | 434.70 | 2.0672 | 2.0672 | |||||
| HCA / HCA Healthcare, Inc. | 1.26 | 433.63 | 2.0622 | 2.0622 | |||||
| CRM / Salesforce, Inc. | 1.61 | 431.70 | 2.0530 | 2.0530 | |||||
| JNJ / Johnson & Johnson | 2.73 | 426.18 | 2.0267 | 2.0267 | |||||
| AMAT / Applied Materials, Inc. | 2.80 | 422.72 | 2.0103 | 2.0103 | |||||
| LOW / Lowe's Companies, Inc. | 1.87 | 418.69 | 1.9911 | 1.9911 | |||||
| QCOM / QUALCOMM Incorporated | 2.82 | -14.33 | 418.46 | -26.45 | 1.9900 | -0.2459 | |||
| PFE / Pfizer Inc. | 17.00 | 84.97 | 414.99 | 47.75 | 1.9735 | 0.1413 | |||
| CMCSA / Comcast Corporation | 12.09 | 413.44 | 1.9661 | 1.9661 | |||||
| GILD / Gilead Sciences, Inc. | 3.87 | -32.06 | 412.36 | -25.53 | 1.9610 | -0.2149 | |||
| CSCO / Cisco Systems, Inc. | 7.11 | -23.01 | 410.31 | -5.40 | 1.9512 | 0.0327 | |||
| MRK / Merck & Co., Inc. | 4.80 | 409.09 | 1.9454 | 1.9454 | |||||
| AMGN / Amgen Inc. | 1.40 | 407.06 | 1.9358 | 1.9358 | |||||
| CAT / Caterpillar Inc. | 1.30 | 401.23 | 1.9081 | 1.9081 | |||||
| ACN / Accenture plc | 1.33 | 397.30 | 1.8894 | 1.8894 | |||||
| CVX / Chevron Corporation | 2.91 | -14.02 | 395.51 | -21.58 | 1.8809 | -0.1012 | |||
| EOG / EOG Resources, Inc. | 3.39 | -17.45 | 373.99 | -27.60 | 1.7785 | -0.2513 | |||
| BMY / Bristol-Myers Squibb Company | 7.44 | -15.83 | 373.43 | -28.33 | 1.7759 | -0.2716 | |||
| UPS / United Parcel Service, Inc. | 3.74 | 356.10 | 1.6935 | 1.6935 | |||||
| VLO / Valero Energy Corporation | 2.68 | -32.76 | 311.48 | -41.31 | 1.4813 | -0.6043 | |||
| ABNB / Airbnb, Inc. | 2.45 | 299.28 | 1.4232 | 1.4232 | |||||
| NKE / NIKE, Inc. | 5.17 | -22.35 | 291.36 | -43.05 | 1.3856 | -0.6248 | |||
| TGT / Target Corporation | 2.91 | 281.00 | 1.3363 | 1.3363 | |||||
| OXY / Occidental Petroleum Corporation | 6.89 | 271.34 | 1.2904 | 1.2904 | |||||
| SLB / Schlumberger Limited | 7.95 | -37.92 | 264.49 | -48.75 | 1.2578 | -0.7704 | |||
| NEM / Newmont Corporation | 4.97 | 261.59 | 1.2440 | 1.2440 | |||||
| FANG / Diamondback Energy, Inc. | 1.86 | -24.82 | 245.85 | -50.95 | 1.1691 | -0.8337 | |||
| UAL / United Airlines Holdings, Inc. | 3.39 | 233.59 | 1.1109 | 1.1109 | |||||
| SCCO / Southern Copper Corporation | 2.49 | 222.53 | 1.0583 | 1.0583 | |||||
| REGN / Regeneron Pharmaceuticals, Inc. | 0.37 | 220.09 | 1.0467 | 1.0467 | |||||
| EMR / Emerson Electric Co. | 2.02 | 212.77 | 1.0119 | 1.0119 | |||||
| Mount Vernon Liquid Assets Portfolio, LLC / STIV (N/A) | 204.29 | 204.29 | 0.9715 | 0.9715 | |||||
| HPQ / HP Inc. | 7.85 | -45.82 | 200.84 | -57.37 | 0.9551 | -0.8965 | |||
| KHC / The Kraft Heinz Company | 6.89 | 200.59 | 0.9539 | 0.9539 | |||||
| DHI / D.R. Horton, Inc. | 1.57 | -43.76 | 198.86 | -50.28 | 0.9457 | -1.1601 | |||
| GIS / General Mills, Inc. | 3.19 | 2,324.08 | 180.94 | 2,160.08 | 0.8605 | -0.9924 | |||
| PCAR / PACCAR Inc | 1.93 | 174.33 | 0.8290 | 0.8290 | |||||
| KMB / Kimberly-Clark Corporation | 1.28 | 168.02 | 0.7990 | 0.7990 | |||||
| NRG / NRG Energy, Inc. | 1.52 | 166.21 | 0.7904 | 0.7904 | |||||
| DAL / Delta Air Lines, Inc. | 3.98 | 165.57 | 0.7874 | 0.7874 | |||||
| LEN / Lennar Corporation | 1.45 | -54.99 | 156.97 | -62.75 | 0.7465 | -0.9095 | |||
| BIIB / Biogen Inc. | 1.23 | -53.01 | 148.82 | -60.47 | 0.7077 | -0.7718 | |||
| EXPE / Expedia Group, Inc. | 0.93 | -60.22 | 145.68 | -63.48 | 0.6928 | -0.8748 | |||
| EA / Electronic Arts Inc. | 0.99 | 144.27 | 0.6861 | 0.6861 | |||||
| GEN / Gen Digital Inc. | 5.56 | -65.01 | 143.77 | -66.36 | 0.6837 | -0.9959 | |||
| HAL / Halliburton Company | 7.12 | -60.96 | 141.09 | -70.26 | 0.6710 | -1.1936 | |||
| EBAY / eBay Inc. | 2.04 | -69.31 | 139.10 | -62.38 | 0.6615 | -0.8163 | |||
| DG / Dollar General Corporation | 1.48 | 138.83 | 0.6602 | 0.6602 | |||||
| ZM / Zoom Communications Inc. | 1.75 | -62.49 | 135.81 | -66.55 | 0.6459 | -0.9496 | |||
| HSY / The Hershey Company | 0.77 | 128.03 | 0.6089 | 0.6089 | |||||
| IQV / IQVIA Holdings Inc. | 0.81 | 125.88 | 0.5986 | 0.5986 | |||||
| BKR / Baker Hughes Company | 3.52 | 124.72 | 0.5931 | 0.5931 | |||||
| HPE / Hewlett Packard Enterprise Company | 7.67 | -65.00 | 124.39 | -73.21 | 0.5915 | -1.2332 | |||
| WAB / Westinghouse Air Brake Technologies Corporation | 0.67 | 123.37 | 0.5867 | 0.5867 | |||||
| CTSH / Cognizant Technology Solutions Corporation | 1.62 | 118.83 | 0.5651 | 0.5651 | |||||
| PHM / PulteGroup, Inc. | 1.07 | -64.16 | 109.91 | -72.15 | 0.5227 | -1.0542 | |||
| LYB / LyondellBasell Industries N.V. | 1.87 | -61.89 | 108.88 | -77.70 | 0.5178 | -1.4330 | |||
| OMC / Omnicom Group Inc. | 1.38 | -40.05 | 105.01 | -50.82 | 0.4994 | -0.4452 | |||
| EME / EMCOR Group, Inc. | 0.26 | 104.31 | 0.4960 | 0.4960 | |||||
| Aptiv PLC / EC (JE00BTDN8H13) | 1.78 | 101.53 | 0.4828 | 0.4828 | |||||
| GDDY / GoDaddy Inc. | 0.53 | 99.31 | 0.4723 | 0.4723 | |||||
| BLDR / Builders FirstSource, Inc. | 0.82 | -64.45 | 97.68 | -74.58 | 0.4645 | -1.0453 | |||
| NVR / NVR, Inc. | 0.01 | -52.96 | 97.54 | -54.94 | 0.4638 | -0.4937 | |||
| LDOS / Leidos Holdings, Inc. | 0.65 | 96.35 | 0.4582 | 0.4582 | |||||
| FTV / Fortive Corporation | 1.35 | 93.78 | 0.4460 | 0.4460 | |||||
| TSN / Tyson Foods, Inc. | 1.53 | 440.40 | 93.60 | 264.11 | 0.4451 | -0.9951 | |||
| NTAP / NetApp, Inc. | 0.99 | -16.92 | 88.74 | 2.45 | 0.4220 | -0.1430 | |||
| ULTA / Ulta Beauty, Inc. | 0.20 | 1,246.72 | 80.91 | 1,486.74 | 0.3848 | -0.3715 | |||
| GFS / GLOBALFOUNDRIES Inc. | 2.30 | 80.52 | 0.3829 | 0.3829 | |||||
| TDY / Teledyne Technologies Incorporated | 0.17 | 78.55 | 0.3736 | 0.3736 | |||||
| ON / ON Semiconductor Corporation | 1.96 | 77.71 | 0.3696 | 0.3696 | |||||
| SNA / Snap-on Incorporated | 0.24 | -67.17 | 76.24 | -70.99 | 0.3626 | -0.6702 | |||
| UTHR / United Therapeutics Corporation | 0.25 | -55.83 | 75.92 | -61.88 | 0.3610 | -0.4216 | |||
| JBL / Jabil Inc. | 0.52 | 1,249.27 | 75.81 | 5,869.06 | 0.3605 | -0.2844 | |||
| CSL / Carlisle Companies Incorporated | 0.20 | -62.84 | 75.22 | -63.68 | 0.3577 | -0.5584 | |||
| SSNC / SS&C Technologies Holdings, Inc. | 0.97 | 73.12 | 0.3477 | 0.3477 | |||||
| RS / Reliance, Inc. | 0.25 | -68.57 | 73.10 | -68.71 | 0.3476 | -0.5703 | |||
| HOLX / Hologic, Inc. | 1.26 | -64.61 | 73.05 | -71.45 | 0.3474 | -0.6582 | |||
| WSM / Williams-Sonoma, Inc. | 0.46 | -75.95 | 71.74 | -75.98 | 0.3412 | -0.8524 | |||
| COG / Cabot Oil & Gas Corp. | 2.88 | -68.37 | 70.65 | -71.61 | 0.3360 | -0.7647 | |||
| DOCU / DocuSign, Inc. | 0.82 | -76.93 | 66.77 | -66.00 | 0.3175 | -0.4673 | |||
| HRL / Hormel Foods Corporation | 2.18 | 65.18 | 0.3100 | 0.3100 | |||||
| DECK / Deckers Outdoor Corporation | 0.58 | 64.38 | 0.3061 | 0.3061 | |||||
| BAH / Booz Allen Hamilton Holding Corporation | 0.53 | 1,721.65 | 63.79 | 2,536.07 | 0.3034 | -0.2567 | |||
| BBY / Best Buy Co., Inc. | 0.95 | -64.45 | 63.41 | -67.80 | 0.3015 | -0.5696 | |||
| ZBRA / Zebra Technologies Corporation | 0.24 | 59.86 | 0.2847 | 0.2847 | |||||
| TPR / Tapestry, Inc. | 0.84 | -81.13 | 59.29 | -81.72 | 0.2820 | -0.9927 | |||
| FFIV / F5, Inc. | 0.21 | -75.01 | 56.39 | -67.52 | 0.2681 | -0.4255 | |||
| MAS / Masco Corporation | 0.88 | 53.58 | 0.2548 | 0.2548 | |||||
| PNR / Pentair plc | 0.57 | 52.15 | 0.2480 | 0.2480 | |||||
| PINS / Pinterest, Inc. | 2.01 | 50.85 | 0.2418 | 0.2418 | |||||
| TWLO / Twilio Inc. | 0.45 | -80.59 | 43.93 | -68.26 | 0.2089 | -0.3441 | |||
| ILMN / Illumina, Inc. | 0.53 | 41.25 | 0.1962 | 0.1962 | |||||
| U.S. Bank Money Market Deposit Account / STIV (8AMMF0A84) | 23.97 | 48.09 | 23.97 | 48.09 | 0.1140 | 0.0504 | |||
| WFRD / Weatherford International plc | 0.00 | -100.00 | 0.00 | -100.00 | -0.4855 | ||||
| PLTK / Playtika Holding Corp. | 0.00 | -100.00 | 0.00 | -100.00 | -0.3165 | ||||
| NOV / NOV Inc. | 0.00 | -100.00 | 0.00 | -100.00 | -0.6919 | ||||
| LYFT / Lyft, Inc. | 0.00 | -100.00 | 0.00 | -100.00 | -0.4998 | ||||
| AMKR / Amkor Technology, Inc. | 0.00 | -100.00 | 0.00 | -100.00 | -0.3688 | ||||
| SMG / The Scotts Miracle-Gro Company | 0.00 | -100.00 | 0.00 | -100.00 | -0.5034 | ||||
| DTM / DT Midstream, Inc. | 0.00 | -100.00 | 0.00 | -100.00 | -0.7873 | ||||
| VSTS / Vestis Corporation | 0.00 | -100.00 | 0.00 | -100.00 | -0.3086 | ||||
| SEE / Sealed Air Corporation | 0.00 | -100.00 | 0.00 | -100.00 | -0.5144 | ||||
| NXST / Nexstar Media Group, Inc. | 0.00 | -100.00 | 0.00 | -100.00 | -0.7227 | ||||
| SLGN / Silgan Holdings Inc. | 0.00 | -100.00 | 0.00 | -100.00 | -0.5646 | ||||
| DDS / Dillard's, Inc. | 0.00 | -100.00 | 0.00 | -100.00 | -0.6463 | ||||
| THC / Tenet Healthcare Corporation | 0.00 | -100.00 | 0.00 | -100.00 | -2.0914 | ||||
| CAG / Conagra Brands, Inc. | 0.00 | -100.00 | 0.00 | -100.00 | -1.2754 | ||||
| ASH / Ashland Inc. | 0.00 | -100.00 | 0.00 | -100.00 | -0.2508 | ||||
| XRAY / DENTSPLY SIRONA Inc. | 0.00 | -100.00 | 0.00 | -100.00 | -0.3469 | ||||
| FTRE / Fortrea Holdings Inc. | 0.00 | -100.00 | 0.00 | -100.00 | -0.1554 | ||||
| AMED / Amedisys, Inc. | 0.00 | -100.00 | 0.00 | -100.00 | -0.1993 | ||||
| CCK / Crown Holdings, Inc. | 0.00 | -100.00 | 0.00 | -100.00 | -1.0512 | ||||
| CART / Maplebear Inc. | 0.00 | -100.00 | 0.00 | -100.00 | -0.6985 | ||||
| PPC / Pilgrim's Pride Corporation | 0.00 | -100.00 | 0.00 | -100.00 | -1.2634 | ||||
| CHRD / Chord Energy Corporation | 0.00 | -100.00 | 0.00 | -100.00 | -0.8217 |