Basic Stats
| Insider Profile | Minerva Advisors LLC |
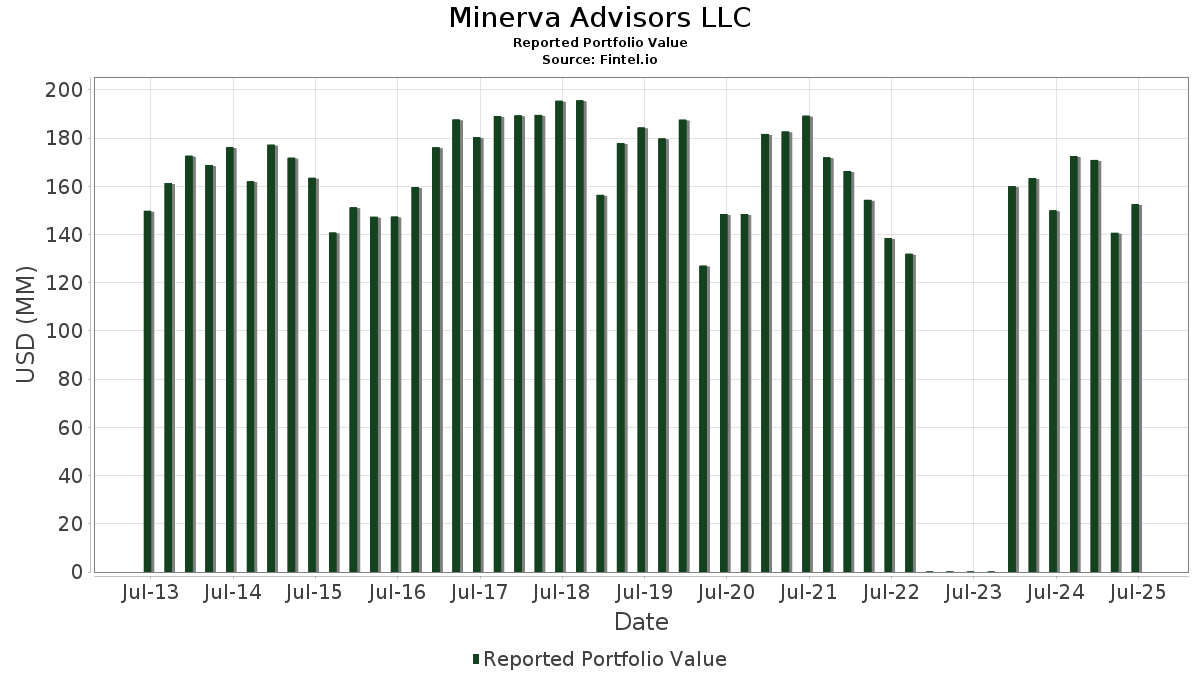
| Portfolio Value | $ 152,589,767 |
| Current Positions | 56 |
Latest Holdings, Performance, AUM (from 13F, 13D)
Minerva Advisors LLC has disclosed 56 total holdings in their latest SEC filings. Most recent portfolio value is calculated to be $ 152,589,767 USD. Actual Assets Under Management (AUM) is this value plus cash (which is not disclosed). Minerva Advisors LLC’s top holdings are Great Lakes Dredge & Dock Corporation (US:GLDD) , Tredegar Corporation (US:TG) , The Eastern Company (US:EML) , Virco Mfg. Corporation (US:VIRC) , and Astronics Corporation (US:ATRO) . Minerva Advisors LLC’s new positions include Marathon Bancorp, Inc. (US:MBBC) , Kelly Services, Inc. (US:KELYA) , . Minerva Advisors LLC’s top industries are "Fabricated Metal Products, Except Machinery And Transportation Equipment" (sic 34) , "Engineering, Accounting, Research, Management, And Related Services" (sic 87) , and "Water Transportation" (sic 44) .
Top Increases This Quarter
We use the change in the portfolio allocation because this is the most meaningful metric. Changes can be due to trades or changes in share prices.
| Security | Shares (MM) |
Value (MM$) |
Portfolio % | ΔPortfolio % |
|---|---|---|---|---|
| 0.20 | 4.68 | 2.2937 | 0.4515 | |
| 0.05 | 0.54 | 0.3572 | 0.3572 | |
| 0.04 | 0.47 | 0.3064 | 0.3064 | |
| 1.11 | 6.44 | 3.1593 | 0.2278 | |
| 0.08 | 1.49 | 0.7293 | 0.2203 | |
| 0.08 | 4.50 | 2.2073 | 0.1426 | |
| 0.22 | 1.89 | 0.9258 | 0.0650 |
Top Decreases This Quarter
We use the change in the portfolio allocation because this is the most meaningful metric. Changes can be due to trades or changes in share prices.
| Security | Shares (MM) |
Value (MM$) |
Portfolio % | ΔPortfolio % |
|---|---|---|---|---|
| 0.26 | 8.56 | 4.1991 | -3.7565 | |
| 0.53 | 11.98 | 5.8759 | -3.2300 | |
| 1.28 | 10.24 | 5.0230 | -3.1158 | |
| 0.54 | 7.49 | 3.6714 | -2.1771 | |
| 1.66 | 14.58 | 7.1514 | -1.9177 | |
| 0.26 | 3.94 | 1.9314 | -1.1324 | |
| 0.09 | 5.27 | 2.5830 | -0.8784 | |
| 0.28 | 2.83 | 1.3856 | -0.8603 | |
| 1.26 | 3.69 | 1.8103 | -0.8403 | |
| 0.09 | 3.63 | 1.7820 | -0.7943 |
13D/G Filings
This is a list of 13D and 13G filings made in the last year (if any). Click the link icon to see the full transaction history. Green rows indicate new positions. Red rows indicate closed positions.
| File Date | Form | Security | Prev Shares |
Current Shares |
ΔShares % | % Ownership |
% ΔOwnership | |
|---|---|---|---|---|---|---|---|---|
| 2025-06-06 | NUVR / Nuvera Communications, Inc. | 608,955 | 11.80 | |||||
| 2025-04-11 | UFI / Unifi, Inc. | 921,787 | 5.00 | |||||
| 2025-02-05 | USAP / Universal Stainless & Alloy Products, Inc. | 391,487 | 4.20 | |||||
| 2024-11-01 | KEQU / Kewaunee Scientific Corporation | |||||||
| 2024-10-17 | DLHC / DLH Holdings Corp. |
13F and Fund Filings
This form was filed on 2025-08-13 for the reporting period 2025-06-30. Click the link icon to see the full transaction history.
Upgrade to unlock premium data and export to Excel ![]() .
.
| Security | Type | Avg Share Price | Shares (MM) |
ΔShares (%) |
ΔShares (%) |
Value ($MM) |
Portfolio (%) |
ΔPortfolio (%) |
|
|---|---|---|---|---|---|---|---|---|---|
| GLDD / Great Lakes Dredge & Dock Corporation | 1.39 | 0.00 | 16.93 | 40.00 | 8.3015 | -0.2925 | |||
| TG / Tredegar Corporation | 1.66 | 0.00 | 14.58 | 14.29 | 7.1514 | -1.9177 | |||
| EML / The Eastern Company | 0.53 | 3.77 | 11.98 | -6.48 | 5.8759 | -3.2300 | |||
| VIRC / Virco Mfg. Corporation | 1.28 | 6.04 | 10.24 | -10.55 | 5.0230 | -3.1158 | |||
| ATRO / Astronics Corporation | 0.26 | -44.74 | 8.56 | -23.51 | 4.1991 | -3.7565 | |||
| ESCA / Escalade, Incorporated | 0.54 | 0.00 | 7.49 | -9.02 | 3.6714 | -2.1771 | |||
| DLHC / DLH Holdings Corp. | 1.11 | 9.07 | 6.44 | 56.21 | 3.1593 | 0.2278 | |||
| INFU / InfuSystem Holdings, Inc. | 0.99 | 9.24 | 6.18 | 26.09 | 3.0295 | -0.4528 | |||
| UFI / Unifi, Inc. | 1.09 | 19.55 | 5.66 | 29.73 | 2.7780 | -0.3254 | |||
| UTMD / Utah Medical Products, Inc. | 0.09 | 7.08 | 5.27 | 8.17 | 2.5830 | -0.8784 | |||
| THRY / Thryv Holdings, Inc. | 0.20 | 0.00 | 4.68 | 80.51 | 2.2937 | 0.4515 | |||
| KEQU / Kewaunee Scientific Corporation | 0.08 | 4.98 | 4.50 | 54.96 | 2.2073 | 0.1426 | |||
| NVGS / Navigator Holdings Ltd. | 0.30 | 0.00 | 4.30 | 7.18 | 2.1075 | -0.7420 | |||
| PBHC / Pathfinder Bancorp, Inc. | 0.26 | 0.00 | 3.94 | -8.63 | 1.9314 | -1.1324 | |||
| SSP / The E.W. Scripps Company | 1.26 | 0.00 | 3.69 | -1.02 | 1.8103 | -0.8403 | |||
| CAC / Camden National Corporation | 0.09 | 0.00 | 3.63 | 0.25 | 1.7820 | -0.7943 | |||
| SGA / Saga Communications, Inc. | 0.23 | 0.00 | 2.89 | 2.26 | 1.4174 | -0.5918 | |||
| CRD.B / Crawford & Company | 0.28 | 1.81 | 2.83 | -10.57 | 1.3856 | -0.8603 | |||
| RAIL / FreightCar America, Inc. | 0.22 | 0.00 | 1.89 | 55.82 | 0.9258 | 0.0650 | |||
| FSTR / L.B. Foster Company | 0.08 | 5.22 | 1.83 | 16.62 | 0.8981 | -0.2181 | |||
| SIF / SIFCO Industries, Inc. | 0.47 | 0.03 | 1.74 | 35.17 | 0.8541 | -0.0616 | |||
| NODK / NI Holdings, Inc. | 0.13 | 0.00 | 1.65 | -10.69 | 0.8116 | -0.5050 | |||
| UIS / Unisys Corporation | 0.35 | 0.00 | 1.56 | -1.32 | 0.7672 | -0.3594 | |||
| MPB / Mid Penn Bancorp, Inc. | 0.05 | 4.73 | 1.53 | 13.81 | 0.7479 | -0.2048 | |||
| CTGO / Contango Ore, Inc. | 0.08 | 8.55 | 1.49 | 107.68 | 0.7293 | 0.2203 | |||
| CFG / Citizens Financial Group, Inc. | 0.02 | 0.00 | 1.06 | 9.21 | 0.5176 | -0.1692 | |||
| DORM / Dorman Products, Inc. | 0.01 | 0.00 | 1.05 | 1.74 | 0.5165 | -0.2194 | |||
| HONE / HarborOne Bancorp, Inc. | 0.09 | 0.00 | 1.03 | 12.66 | 0.5064 | -0.1452 | |||
| FNB / F.N.B. Corporation | 0.06 | 0.00 | 0.93 | 8.48 | 0.4581 | -0.1544 | |||
| DGICA / Donegal Group Inc. | 0.05 | 0.00 | 0.93 | 1.97 | 0.4562 | -0.1924 | |||
| CZNC / Citizens & Northern Corporation | 0.04 | 0.00 | 0.81 | -5.91 | 0.3985 | -0.2150 | |||
| ECBK / ECB Bancorp, Inc. | 0.05 | 0.00 | 0.77 | 1.98 | 0.3781 | -0.1596 | |||
| CPBI / Central Plains Bancshares, Inc. | 0.05 | 0.00 | 0.74 | 1.09 | 0.3632 | -0.1576 | |||
| FRBA / First Bank | 0.04 | 0.00 | 0.64 | 4.27 | 0.3115 | -0.1216 | |||
| USLM / United States Lime & Minerals, Inc. | 0.01 | 0.00 | 0.62 | 12.86 | 0.3059 | -0.0867 | |||
| MBBC / Marathon Bancorp, Inc. | 0.05 | 0.54 | 0.3572 | 0.3572 | |||||
| HBNC / Horizon Bancorp, Inc. | 0.04 | 0.00 | 0.54 | 1.89 | 0.2639 | -0.1118 | |||
| SSB / SouthState Corporation | 0.01 | 0.00 | 0.52 | -0.95 | 0.2554 | -0.1180 | |||
| CLBK / Columbia Financial, Inc. | 0.03 | 0.00 | 0.49 | -3.16 | 0.2405 | -0.1198 | |||
| NWBI / Northwest Bancshares, Inc. | 0.04 | 0.00 | 0.49 | 6.36 | 0.2382 | -0.0865 | |||
| LSBK / Lake Shore Bancorp, Inc. | 0.03 | 1.18 | 0.48 | 1.26 | 0.2361 | -0.1021 | |||
| KELYA / Kelly Services, Inc. | 0.04 | 0.47 | 0.3064 | 0.3064 | |||||
| CZFS / Citizens Financial Services, Inc. | 0.01 | 1.00 | 0.46 | 2.21 | 0.2269 | -0.0950 | |||
| FCF / First Commonwealth Financial Corporation | 0.03 | 0.00 | 0.42 | 4.53 | 0.2036 | -0.0787 | |||
| RMBI / Richmond Mutual Bancorporation, Inc. | 0.03 | 0.00 | 0.41 | 7.81 | 0.2030 | -0.0699 | |||
| FSFG / First Savings Financial Group, Inc. | 0.02 | 0.00 | 0.40 | -3.36 | 0.1980 | -0.0990 | |||
| PRA / ProAssurance Corporation | 0.02 | 0.00 | 0.39 | -2.24 | 0.1930 | -0.0931 | |||
| ACNT / Ascent Industries Co. | 0.03 | 0.00 | 0.38 | -0.52 | 0.1881 | -0.0856 | |||
| FRME / First Merchants Corporation | 0.01 | 0.00 | 0.38 | -5.26 | 0.1855 | -0.0984 | |||
| CBU / Community Financial System, Inc. | 0.01 | 0.00 | 0.37 | -2.66 | 0.1797 | -0.0877 | |||
| PBBK / PB Bankshares, Inc. | 0.02 | 0.00 | 0.36 | 6.21 | 0.1764 | -0.0639 | |||
| NWFL / Norwood Financial Corp. | 0.01 | 0.00 | 0.35 | 6.67 | 0.1730 | -0.0621 | |||
| EBMT / Eagle Bancorp Montana, Inc. | 0.02 | 0.00 | 0.35 | -0.57 | 0.1722 | -0.0790 | |||
| DGICB / Donegal Group Inc. | 0.02 | 0.00 | 0.31 | 6.10 | 0.1535 | -0.0565 | |||
| DLX / Deluxe Corporation | 0.01 | 0.00 | 0.22 | 0.91 | 0.1085 | -0.0477 | |||
| ASRV / AmeriServ Financial, Inc. | 0.06 | 0.00 | 0.17 | 23.40 | 0.0856 | -0.0149 | |||
| VBFC / Village Bank and Trust Financial Corp. | 0.00 | -100.00 | 0.00 | 0.0000 |