Basic Stats
| Portfolio Value | $ 230,494,106 |
| Current Positions | 34 |
Latest Holdings, Performance, AUM (from 13F, 13D)
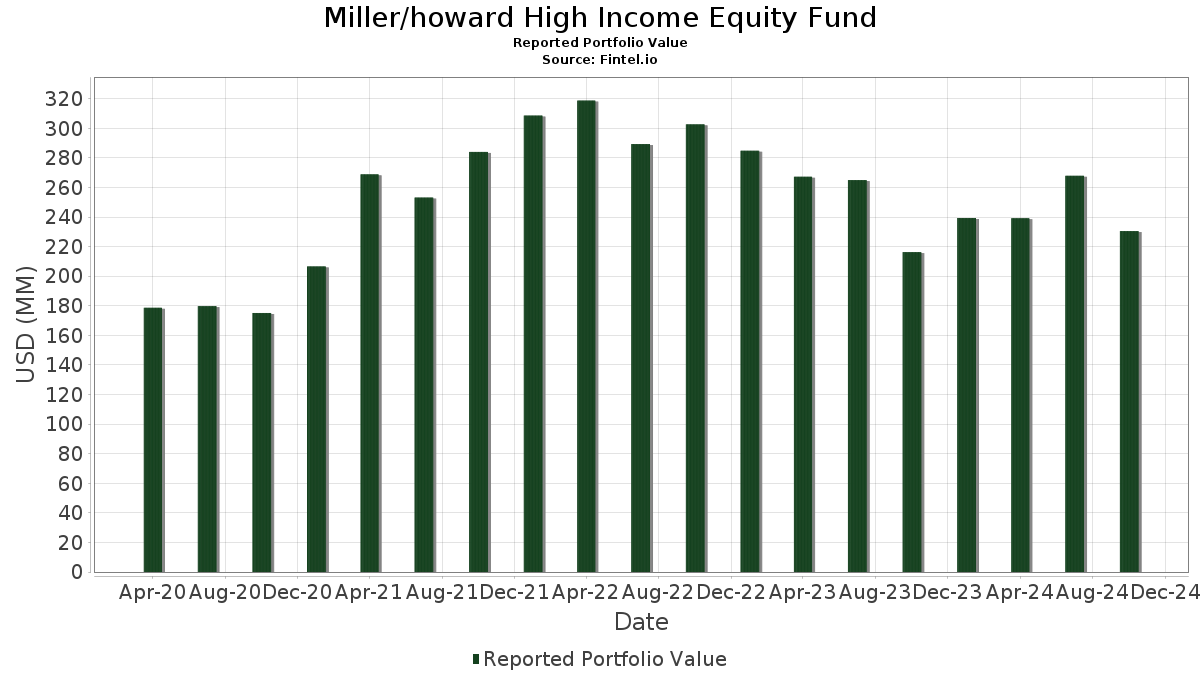
Miller/howard High Income Equity Fund has disclosed 34 total holdings in their latest SEC filings. Most recent portfolio value is calculated to be $ 230,494,106 USD. Actual Assets Under Management (AUM) is this value plus cash (which is not disclosed). Miller/howard High Income Equity Fund’s top holdings are Morgan Stanley Institutional Liquidity Funds - Treasury Portfolio (US:US61747C5821) , Energy Transfer LP - Limited Partnership (US:ET) , TC Energy Corporation (US:TRP) , MPLX LP - Limited Partnership (US:MPLX) , and Texas Instruments Incorporated (US:TXN) . Miller/howard High Income Equity Fund’s new positions include EPR Properties (US:EPR) , GSK plc - Depositary Receipt (Common Stock) (US:GSK) , Hess Corporation (US:HES) , Paychex, Inc. (US:PAYX) , and Hess Midstream LP (US:HESM) .
Top Increases This Quarter
We use the change in the portfolio allocation because this is the most meaningful metric. Changes can be due to trades or changes in share prices.
| Security | Shares (MM) |
Value (MM$) |
Portfolio % | ΔPortfolio % |
|---|---|---|---|---|
| 41.22 | 41.22 | 17.9372 | 6.2411 | |
| 0.14 | 6.35 | 2.7642 | 2.7642 | |
| 0.12 | 6.30 | 2.7410 | 2.7410 | |
| 0.15 | 5.51 | 2.3996 | 2.3996 | |
| 0.04 | 5.38 | 2.3409 | 2.3409 | |
| 0.04 | 5.02 | 2.1828 | 2.1828 | |
| 0.14 | 4.71 | 2.0507 | 2.0507 | |
| 0.04 | 4.60 | 2.0037 | 2.0037 | |
| 0.25 | 7.17 | 3.1181 | 1.1849 | |
| 0.04 | 1.10 | 0.4779 | 0.4779 |
Top Decreases This Quarter
We use the change in the portfolio allocation because this is the most meaningful metric. Changes can be due to trades or changes in share prices.
| Security | Shares (MM) |
Value (MM$) |
Portfolio % | ΔPortfolio % |
|---|---|---|---|---|
| 0.04 | 1.36 | 0.5922 | -3.2103 | |
| 0.10 | 3.49 | 1.5201 | -2.1902 | |
| 0.03 | 2.06 | 0.8965 | -1.7832 | |
| 0.20 | 2.95 | 1.2855 | -1.2242 | |
| 0.10 | 6.42 | 2.7926 | -0.5522 | |
| 0.15 | 3.17 | 1.3800 | -0.4902 | |
| 0.12 | 6.21 | 2.7019 | -0.2750 | |
| 0.25 | 7.24 | 3.1485 | -0.2363 | |
| 0.03 | 4.14 | 1.8026 | -0.2293 | |
| 0.04 | 8.23 | 3.5807 | -0.1053 |
13F and Fund Filings
This form was filed on 2024-12-30 for the reporting period 2024-10-31. Click the link icon to see the full transaction history.
Upgrade to unlock premium data and export to Excel ![]() .
.
| Security | Type | Avg Share Price | Shares (MM) |
ΔShares (%) |
ΔShares (%) |
Value ($MM) |
Portfolio (%) |
ΔPortfolio (%) |
|
|---|---|---|---|---|---|---|---|---|---|
| US61747C5821 / Morgan Stanley Institutional Liquidity Funds - Treasury Portfolio | 41.22 | 57.37 | 41.22 | 57.37 | 17.9372 | 6.2411 | |||
| ET / Energy Transfer LP - Limited Partnership | 0.75 | 0.00 | 12.37 | 1.29 | 5.3824 | -0.0703 | |||
| TRP / TC Energy Corporation | 0.22 | 0.00 | 10.23 | 9.67 | 4.4529 | 0.2864 | |||
| MPLX / MPLX LP - Limited Partnership | 0.22 | 0.00 | 9.95 | 3.74 | 4.3301 | 0.0469 | |||
| TXN / Texas Instruments Incorporated | 0.04 | 0.00 | 8.23 | -0.33 | 3.5807 | -0.1053 | |||
| AB / AllianceBernstein Holding L.P. - Limited Partnership | 0.20 | 0.00 | 7.56 | 4.99 | 3.2892 | 0.0744 | |||
| CAG / Conagra Brands, Inc. | 0.25 | 0.00 | 7.24 | -4.55 | 3.1485 | -0.2363 | |||
| EPD / Enterprise Products Partners L.P. - Limited Partnership | 0.25 | 66.67 | 7.17 | 65.51 | 3.1181 | 1.1849 | |||
| POR / Portland General Electric Company | 0.15 | 0.00 | 7.11 | 0.04 | 3.0941 | -0.0795 | |||
| WES / Western Midstream Partners, LP - Limited Partnership | 0.17 | 25.00 | 6.60 | 15.26 | 2.8734 | 0.3152 | |||
| C / Citigroup Inc. | 0.10 | -9.91 | 6.42 | -11.22 | 2.7926 | -0.5522 | |||
| EPR / EPR Properties | 0.14 | 6.35 | 2.7642 | 2.7642 | |||||
| CSCO / Cisco Systems, Inc. | 0.12 | 6.30 | 2.7410 | 2.7410 | |||||
| CMS / CMS Energy Corporation | 0.09 | 0.00 | 6.26 | 7.41 | 2.7264 | 0.1221 | |||
| OMF / OneMain Holdings, Inc. | 0.12 | 3.09 | 6.21 | -1.74 | 2.7019 | -0.2750 | |||
| OGE / OGE Energy Corp. | 0.15 | 0.00 | 6.00 | 3.15 | 2.6104 | 0.0135 | |||
| O / Realty Income Corporation | 0.10 | 0.95 | 5.94 | 4.36 | 2.5837 | 0.0432 | |||
| SBRA / Sabra Health Care REIT, Inc. | 0.30 | 0.00 | 5.82 | 19.53 | 2.5328 | 0.3585 | |||
| GSK / GSK plc - Depositary Receipt (Common Stock) | 0.15 | 5.51 | 2.3996 | 2.3996 | |||||
| HES / Hess Corporation | 0.04 | 5.38 | 2.3409 | 2.3409 | |||||
| RHP / Ryman Hospitality Properties, Inc. | 0.05 | 0.00 | 5.35 | 6.51 | 2.3293 | 0.0852 | |||
| MAIN / Main Street Capital Corporation | 0.10 | 0.00 | 5.13 | 0.31 | 2.2342 | -0.0512 | |||
| PAYX / Paychex, Inc. | 0.04 | 5.02 | 2.1828 | 2.1828 | |||||
| VALE / Vale S.A. - Depositary Receipt (Common Stock) | 0.46 | 0.00 | 4.87 | -1.38 | 2.1187 | -0.0858 | |||
| HESM / Hess Midstream LP | 0.14 | 4.71 | 2.0507 | 2.0507 | |||||
| AM / Antero Midstream Corporation | 0.33 | 0.00 | 4.67 | 0.06 | 2.0324 | -0.0517 | |||
| MRK / Merck & Co., Inc. | 0.04 | 4.60 | 2.0037 | 2.0037 | |||||
| MTN / Vail Resorts, Inc. | 0.03 | 0.00 | 4.14 | -8.97 | 1.8026 | -0.2293 | |||
| ORI / Old Republic International Corporation | 0.10 | -58.33 | 3.49 | -57.96 | 1.5201 | -2.1902 | |||
| ARCC / Ares Capital Corporation | 0.15 | -25.00 | 3.17 | -24.28 | 1.3800 | -0.4902 | |||
| APLE / Apple Hospitality REIT, Inc. | 0.20 | -47.37 | 2.95 | -47.44 | 1.2855 | -1.2242 | |||
| EIX / Edison International | 0.03 | -66.67 | 2.06 | -65.67 | 0.8965 | -1.7832 | |||
| CNQ / Canadian Natural Resources Limited | 0.04 | -83.33 | 1.36 | -84.03 | 0.5922 | -3.2103 | |||
| SOBO / South Bow Corporation | 0.04 | 1.10 | 0.4779 | 0.4779 |