Basic Stats
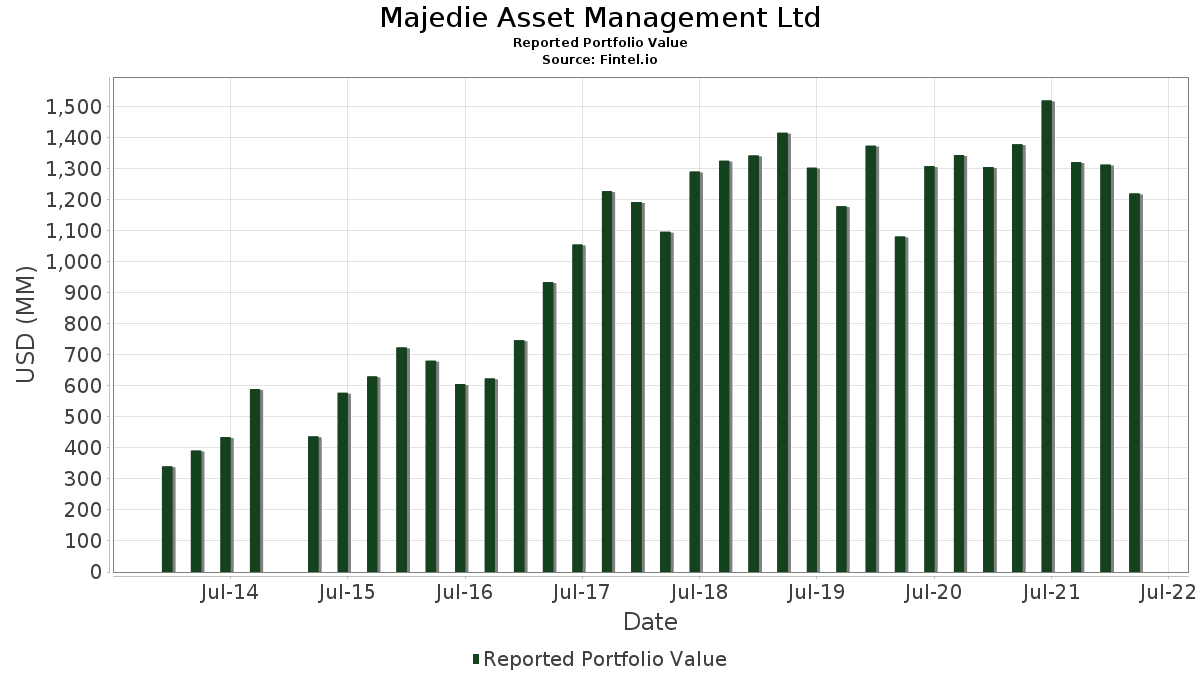
| Portfolio Value | $ 1,220,229,000 |
| Current Positions | 85 |
Latest Holdings, Performance, AUM (from 13F, 13D)
Majedie Asset Management Ltd has disclosed 85 total holdings in their latest SEC filings. Most recent portfolio value is calculated to be $ 1,220,229,000 USD. Actual Assets Under Management (AUM) is this value plus cash (which is not disclosed). Majedie Asset Management Ltd’s top holdings are Newmont Corporation (US:NEM) , Equifax Inc. (US:EFX) , Microsoft Corporation (US:MSFT) , Fiserv, Inc. (US:FISV) , and Barrick Mining Corporation (US:GOLD) . Majedie Asset Management Ltd’s new positions include EOG Resources, Inc. (US:EOG) , Adobe Inc. (US:ADBE) , Performance Food Group Company (US:PFGC) , Shell Plc - ADR (Representing Ordinary Shares - Class A) (US:RDS.A) , and Walgreens Boots Alliance, Inc. (US:WBA) .
Top Increases This Quarter
We use the change in the portfolio allocation because this is the most meaningful metric. Changes can be due to trades or changes in share prices.
| Security | Shares (MM) |
Value (MM$) |
Portfolio % | ΔPortfolio % |
|---|---|---|---|---|
| 1.43 | 113.45 | 9.2973 | 4.9095 | |
| 1.87 | 45.65 | 3.6073 | 2.1880 | |
| 0.32 | 40.27 | 3.3000 | 1.4381 | |
| 0.10 | 24.01 | 1.9678 | 1.3257 | |
| 0.41 | 20.30 | 1.6635 | 0.9250 | |
| 0.09 | 10.87 | 0.8907 | 0.8907 | |
| 0.11 | 9.96 | 0.8163 | 0.8163 | |
| 0.02 | 9.69 | 0.7941 | 0.7941 | |
| 0.19 | 9.58 | 0.7854 | 0.7854 | |
| 0.16 | 8.64 | 0.6831 | 0.6831 |
Top Decreases This Quarter
We use the change in the portfolio allocation because this is the most meaningful metric. Changes can be due to trades or changes in share prices.
| Security | Shares (MM) |
Value (MM$) |
Portfolio % | ΔPortfolio % |
|---|---|---|---|---|
| 0.01 | 1.00 | 0.0822 | -3.6501 | |
| 0.01 | 1.25 | 0.1020 | -2.2060 | |
| 0.27 | 63.93 | 5.2391 | -1.7811 | |
| 5.43 | 14.96 | 1.2257 | -1.2712 | |
| 0.05 | 23.38 | 1.9163 | -1.1816 | |
| 0.00 | 0.00 | -0.9819 | ||
| 0.01 | 0.71 | 0.0583 | -0.8962 | |
| 0.47 | 47.77 | 3.9149 | -0.8583 | |
| 0.13 | 5.54 | 0.4540 | -0.8306 | |
| 0.01 | 35.05 | 2.8723 | -0.5318 |
13F and Fund Filings
This form was filed on 2022-05-16 for the reporting period 2022-03-31. Click the link icon to see the full transaction history.
Upgrade to unlock premium data and export to Excel ![]() .
.
| Security | Type | Avg Share Price | Shares (MM) |
ΔShares (%) |
ΔShares (%) |
Value ($MM) |
Portfolio (%) |
ΔPortfolio (%) |
|
|---|---|---|---|---|---|---|---|---|---|
| NEM / Newmont Corporation | 1.43 | 54.22 | 113.45 | 96.87 | 9.2973 | 4.9095 | |||
| EFX / Equifax Inc. | 0.27 | -14.07 | 63.93 | -30.66 | 5.2391 | -1.7811 | |||
| MSFT / Microsoft Corporation | 0.17 | 0.59 | 51.70 | -8.11 | 4.2370 | -0.0470 | |||
| FISV / Fiserv, Inc. | 0.47 | -21.72 | 47.77 | -23.80 | 3.9149 | -0.8583 | |||
| GOLD / Barrick Mining Corporation | 1.87 | 90.38 | 45.65 | 144.90 | 3.6073 | 2.1880 | |||
| ZBH / Zimmer Biomet Holdings, Inc. | 0.32 | 64.14 | 40.27 | 64.67 | 3.3000 | 1.4381 | |||
| AMZN / Amazon.com, Inc. | 0.01 | 9.44 | 38.73 | 6.62 | 3.1741 | 0.4081 | |||
| GOOGL / Alphabet Inc. | 0.01 | -18.06 | 35.05 | -21.60 | 2.8723 | -0.5318 | |||
| EA / Electronic Arts Inc. | 0.25 | 1.55 | 31.49 | -2.94 | 2.5806 | 0.1104 | |||
| ANTM / Anthem Inc | 0.06 | -18.04 | 27.59 | -13.45 | 2.2607 | -0.1662 | |||
| ICE / Intercontinental Exchange, Inc. | 0.20 | 0.56 | 26.35 | -3.20 | 2.1594 | 0.0867 | |||
| HAS / Hasbro, Inc. | 0.31 | -1.56 | 25.05 | -21.05 | 2.0527 | -0.3629 | |||
| LHX / L3Harris Technologies, Inc. | 0.10 | 145.25 | 24.01 | 184.74 | 1.9678 | 1.3257 | |||
| IBKR / Interactive Brokers Group, Inc. | 0.36 | 5.88 | 23.86 | -12.44 | 1.8853 | -0.1894 | |||
| FICO / Fair Isaac Corporation | 0.05 | -46.38 | 23.38 | -42.53 | 1.9163 | -1.1816 | |||
| CCK / Crown Holdings, Inc. | 0.18 | -19.63 | 22.25 | -9.44 | 1.8236 | -0.0473 | |||
| WSC / WillScot Holdings Corporation | 0.52 | -1.05 | 20.49 | -5.53 | 1.6792 | 0.0278 | |||
| INTC / Intel Corporation | 0.41 | 118.23 | 20.30 | 109.27 | 1.6635 | 0.9250 | |||
| USFD / US Foods Holding Corp. | 0.51 | -2.55 | 19.05 | 4.92 | 1.5608 | 0.1787 | |||
| AON / Aon plc | 0.06 | 36.75 | 18.78 | 47.63 | 1.5388 | 0.5704 | |||
| FCX / Freeport-McMoRan Inc. | 0.37 | -11.07 | 18.12 | 5.62 | 1.4850 | 0.1787 | |||
| FTDR / Frontdoor, Inc. | 0.56 | -5.85 | 16.74 | -23.59 | 1.3716 | -0.2962 | |||
| CZOO / Cazoo Group Ltd | 5.43 | 0.00 | 14.96 | -54.39 | 1.2257 | -1.2712 | |||
| TSM / Taiwan Semiconductor Manufacturing Company Limited - Depositary Receipt (Common Stock) | 0.14 | -4.86 | 14.25 | -17.84 | 1.1679 | -0.1529 | |||
| SQM / Sociedad Química y Minera de Chile S.A. - Depositary Receipt (Common Stock) | 0.17 | -5.30 | 14.14 | 60.18 | 1.1174 | 0.4452 | |||
| NVDA / NVIDIA Corporation | 0.05 | -17.03 | 13.76 | -23.29 | 1.1273 | -0.2381 | |||
| MELI / MercadoLibre, Inc. | 0.01 | 2.47 | 13.35 | -9.93 | 1.0939 | -0.0344 | |||
| CNC / Centene Corporation | 0.15 | 0.17 | 12.19 | 1.98 | 0.9987 | 0.0889 | |||
| VRT / Vertiv Holdings Co | 0.82 | 59.98 | 11.52 | -10.62 | 0.9100 | -0.0710 | |||
| MU / Micron Technology, Inc. | 0.14 | -9.02 | 11.25 | -24.19 | 0.9218 | -0.2080 | |||
| GFI / Gold Fields Limited - Depositary Receipt (Common Stock) | 0.73 | -10.19 | 11.22 | 25.89 | 0.9193 | 0.2408 | |||
| CBOE / Cboe Global Markets, Inc. | 0.10 | -3.85 | 11.15 | -15.94 | 0.9138 | -0.0962 | |||
| MRK / Merck & Co., Inc. | 0.14 | 10.41 | 11.06 | 17.79 | 0.9062 | 0.1914 | |||
| EOG / EOG Resources, Inc. | 0.09 | 10.87 | 0.8907 | 0.8907 | |||||
| ARMK / Aramark | 0.29 | 20.86 | 10.85 | 22.89 | 0.8888 | 0.2168 | |||
| PFE / Pfizer Inc. | 0.20 | 27.47 | 10.08 | 11.35 | 0.8262 | 0.1369 | |||
| BAP / Credicorp Ltd. | 0.06 | -3.19 | 10.03 | 35.82 | 0.8222 | 0.2598 | |||
| NVS / Novartis AG - Depositary Receipt (Common Stock) | 0.11 | 9.96 | 0.8163 | 0.8163 | |||||
| TAP / Molson Coors Beverage Company | 0.18 | 8.73 | 9.81 | 24.78 | 0.8043 | 0.2054 | |||
| KHC / The Kraft Heinz Company | 0.25 | -10.23 | 9.75 | -1.85 | 0.7993 | 0.0427 | |||
| ADBE / Adobe Inc. | 0.02 | 9.69 | 0.7941 | 0.7941 | |||||
| ICLR / ICON Public Limited Company | 0.04 | 135.66 | 9.59 | 84.42 | 0.7859 | 0.3900 | |||
| PFGC / Performance Food Group Company | 0.19 | 9.58 | 0.7854 | 0.7854 | |||||
| DAL / Delta Air Lines, Inc. | 0.24 | -44.14 | 9.57 | -43.64 | 0.7845 | -0.5087 | |||
| CNHI / CNH Industrial N.V. | 0.60 | 176.25 | 9.56 | 127.17 | 0.7838 | 0.4632 | |||
| XPO / XPO, Inc. | 0.13 | -24.30 | 9.54 | -29.08 | 0.7816 | -0.2423 | |||
| CAH / Cardinal Health, Inc. | 0.16 | 1.98 | 9.01 | 11.90 | 0.7120 | 0.0989 | |||
| UHS / Universal Health Services, Inc. | 0.06 | 8.79 | 8.89 | 21.19 | 0.7024 | 0.1439 | |||
| TTWO / Take-Two Interactive Software, Inc. | 0.06 | -18.39 | 8.82 | -29.65 | 0.7231 | -0.2319 | |||
| RDS.A / Shell Plc - ADR (Representing Ordinary Shares - Class A) | 0.16 | 8.64 | 0.6831 | 0.6831 | |||||
| IBM / International Business Machines Corporation | 0.06 | -34.01 | 8.27 | -36.03 | 0.6775 | -0.3065 | |||
| NFLX / Netflix, Inc. | 0.02 | 15.95 | 8.24 | -28.15 | 0.6757 | -0.1981 | |||
| GSK / GSK plc - Depositary Receipt (Common Stock) | 0.19 | -18.37 | 8.13 | -19.65 | 0.6665 | -0.1042 | |||
| CPA / Copa Holdings, S.A. | 0.09 | -3.61 | 7.68 | -2.81 | 0.6294 | 0.0277 | |||
| BAH / Booz Allen Hamilton Holding Corporation | 0.08 | 7.37 | 0.5821 | 0.5821 | |||||
| HII / Huntington Ingalls Industries, Inc. | 0.04 | -1.19 | 7.30 | 5.16 | 0.5980 | 0.0697 | |||
| TTE / TotalEnergies SE - Depositary Receipt (Common Stock) | 0.14 | -41.09 | 7.23 | -40.02 | 0.5922 | -0.3251 | |||
| IONS / Ionis Pharmaceuticals, Inc. | 0.20 | 11.39 | 7.22 | 35.10 | 0.5920 | 0.1849 | |||
| IT / Gartner, Inc. | 0.02 | 3.53 | 7.01 | -8.22 | 0.5749 | -0.0071 | |||
| SBSW / Sibanye Stillwater Limited - Depositary Receipt (Common Stock) | 0.43 | 35.96 | 7.01 | 75.38 | 0.5543 | 0.2498 | |||
| WBA / Walgreens Boots Alliance, Inc. | 0.15 | 6.58 | 0.5397 | 0.5397 | |||||
| VTRS / Viatris Inc. | 0.57 | -18.24 | 6.23 | -34.49 | 0.5109 | -0.2137 | |||
| SCHW / The Charles Schwab Corporation | 0.07 | -32.47 | 5.94 | -32.55 | 0.4695 | -0.2012 | |||
| TCOM / Trip.com Group Limited - Depositary Receipt (Common Stock) | 0.26 | -2.58 | 5.92 | -8.84 | 0.4679 | -0.0267 | |||
| / ViacomCBS Inc | 0.16 | -17.51 | 5.92 | 2.99 | 0.4848 | 0.0475 | |||
| MGM / MGM Resorts International | 0.13 | -64.74 | 5.54 | -67.16 | 0.4540 | -0.8306 | |||
| HST / Host Hotels & Resorts, Inc. | 0.28 | -51.46 | 5.37 | -45.96 | 0.4239 | -0.3320 | |||
| CCJ / Cameco Corporation | 0.18 | -18.30 | 5.28 | 8.64 | 0.4330 | 0.0627 | |||
| ALNY / Alnylam Pharmaceuticals, Inc. | 0.03 | 5.14 | 0.4209 | 0.4209 | |||||
| C / Citigroup Inc. | 0.09 | -47.07 | 4.69 | -53.36 | 0.3847 | -0.3817 | |||
| IBP / Installed Building Products, Inc. | 0.04 | 1.16 | 3.66 | -39.05 | 0.3002 | -0.1574 | |||
| ADSK / Autodesk, Inc. | 0.02 | -10.00 | 3.61 | -31.63 | 0.2957 | -0.1061 | |||
| ALC / Alcon Inc. | 0.04 | -1.01 | 3.52 | -10.78 | 0.2779 | -0.0222 | |||
| BFAM / Bright Horizons Family Solutions Inc. | 0.02 | -25.68 | 3.20 | -21.95 | 0.2623 | -0.0499 | |||
| GXO / GXO Logistics, Inc. | 0.04 | 12.08 | 3.08 | -12.26 | 0.2527 | -0.0149 | |||
| ETSY / Etsy, Inc. | 0.02 | -55.05 | 2.25 | -74.58 | 0.1840 | -0.4883 | |||
| ILMN / Illumina, Inc. | 0.01 | -7.76 | 1.97 | -15.58 | 0.1616 | -0.0163 | |||
| MRVL / Marvell Technology, Inc. | 0.03 | 0.00 | 1.95 | -18.33 | 0.1600 | -0.0220 | |||
| FRC / First Republic Bank | 0.01 | -7.05 | 1.75 | -27.30 | 0.1384 | -0.0451 | |||
| SGEN / Seagen Inc | 0.01 | 0.00 | 1.31 | -7.10 | 0.1072 | -0.0000 | |||
| META / Meta Platforms, Inc. | 0.01 | -93.76 | 1.25 | -95.89 | 0.1020 | -2.2060 | |||
| SE / Sea Limited - Depositary Receipt (Common Stock) | 0.01 | 0.00 | 1.06 | -46.62 | 0.0866 | -0.0641 | |||
| NXPI / NXP Semiconductors N.V. | 0.01 | -97.47 | 1.00 | -97.95 | 0.0822 | -3.6501 | |||
| MMYT / MakeMyTrip Limited | 0.03 | 0.00 | 0.74 | -3.52 | 0.0606 | 0.0022 | |||
| ON / ON Semiconductor Corporation | 0.01 | -93.81 | 0.71 | -94.32 | 0.0583 | -0.8962 | |||
| LYV / Live Nation Entertainment, Inc. | 0.00 | -100.00 | 0.00 | -100.00 | -0.0554 | ||||
| RDS.B / Shell Plc - ADR | 0.00 | -100.00 | 0.00 | -100.00 | -0.9819 | ||||
| AEO / American Eagle Outfitters, Inc. | 0.00 | -100.00 | 0.00 | -100.00 | -0.2385 | ||||
| VNO.PRL / Vornado Realty Trust - Preferred Stock | 0.00 | -100.00 | 0.00 | -100.00 | -0.5026 | ||||
| ATUS / Altice USA, Inc. | 0.00 | -100.00 | 0.00 | -100.00 | -0.2329 | ||||
| CCL / Carnival Corporation & plc | 0.00 | -100.00 | 0.00 | -100.00 | -0.4204 | ||||
| LOPE / Grand Canyon Education, Inc. | 0.00 | -100.00 | 0.00 | -100.00 | -0.2789 |