Basic Stats
| Insider Profile | Madryn Asset Management, LP |
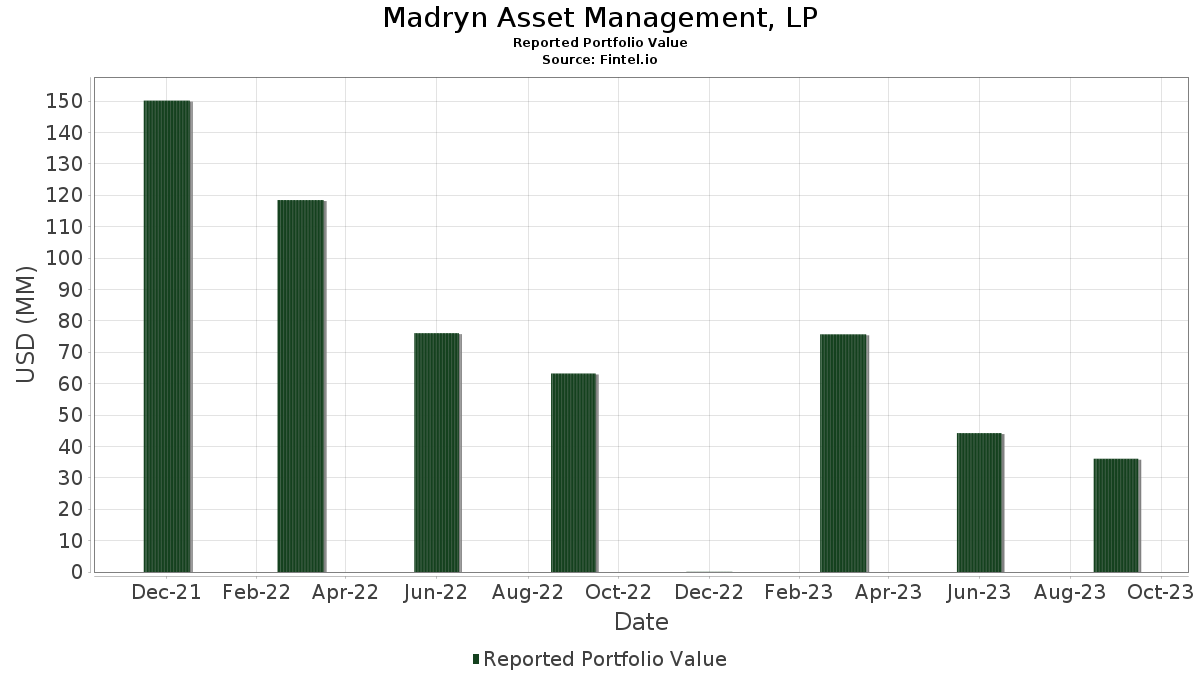
| Portfolio Value | $ 36,078,953 |
| Current Positions | 5 |
Latest Holdings, Performance, AUM (from 13F, 13D)
Madryn Asset Management, LP has disclosed 5 total holdings in their latest SEC filings. Most recent portfolio value is calculated to be $ 36,078,953 USD. Actual Assets Under Management (AUM) is this value plus cash (which is not disclosed). Madryn Asset Management, LP’s top holdings are Standard BioTools Inc. (US:SLGC) , Establishment Labs Holdings Inc. (US:ESTA) , Greenbrook TMS Inc. (US:GBNHF) , and Venus Concept Inc. (US:VERO) . Madryn Asset Management, LP’s top industries are "Measuring, Analyzing, And Controlling Instruments; Photographic, Medical And Optical Goods; Watches And Clocks" (sic 38) , and "Engineering, Accounting, Research, Management, And Related Services" (sic 87) .
Top Increases This Quarter
We use the change in the portfolio allocation because this is the most meaningful metric. Changes can be due to trades or changes in share prices.
| Security | Shares (MM) |
Value (MM$) |
Portfolio % | ΔPortfolio % |
|---|---|---|---|---|
| 7.47 | 17.85 | 49.4787 | 10.4790 | |
| 0.11 | 0.22 | 0.6087 | 0.0768 |
Top Decreases This Quarter
We use the change in the portfolio allocation because this is the most meaningful metric. Changes can be due to trades or changes in share prices.
| Security | Shares (MM) |
Value (MM$) |
Portfolio % | ΔPortfolio % |
|---|---|---|---|---|
| 0.32 | 15.76 | 43.6749 | -6.1254 | |
| 6.36 | 1.65 | 4.5859 | -4.7651 |
13D/G Filings
This is a list of 13D and 13G filings made in the last year (if any). Click the link icon to see the full transaction history. Green rows indicate new positions. Red rows indicate closed positions.
| File Date | Form | Security | Prev Shares |
Current Shares |
ΔShares % | % Ownership |
% ΔOwnership | |
|---|---|---|---|---|---|---|---|---|
| 2025-08-12 | STIM / Neuronetics, Inc. | 24,237,061 | 20,737,061 | -14.44 | 31.40 | -27.98 | ||
| 2025-07-02 | VERO / Venus Concept Inc. | 10,891,951 | 10,869,529 | -0.21 | 85.50 | 0.00 |
13F and Fund Filings
This form was filed on 2023-11-02 for the reporting period 2023-09-30. Click the link icon to see the full transaction history.
Upgrade to unlock premium data and export to Excel ![]() .
.
| Security | Type | Avg Share Price | Shares (MM) |
ΔShares (%) |
ΔShares (%) |
Value ($MM) |
Portfolio (%) |
ΔPortfolio (%) |
|
|---|---|---|---|---|---|---|---|---|---|
| SLGC / Standard BioTools Inc. | 7.47 | 0.00 | 17.85 | 3.47 | 49.4787 | 10.4790 | |||
| ESTA / Establishment Labs Holdings Inc. | 0.32 | 0.00 | 15.76 | -28.48 | 43.6749 | -6.1254 | |||
| GBNHF / Greenbrook TMS Inc. | 6.36 | 0.00 | 1.65 | -60.02 | 4.5859 | -4.7651 | |||
| SOMALOGIC INC / CALL (83444K905) | 0.84 | 0.60 | 0.0000 | ||||||
| VERO / Venus Concept Inc. | 0.11 | 0.00 | 0.22 | -6.81 | 0.6087 | 0.0768 |