Basic Stats
| Portfolio Value | $ 344,524,651 |
| Current Positions | 64 |
Latest Holdings, Performance, AUM (from 13F, 13D)
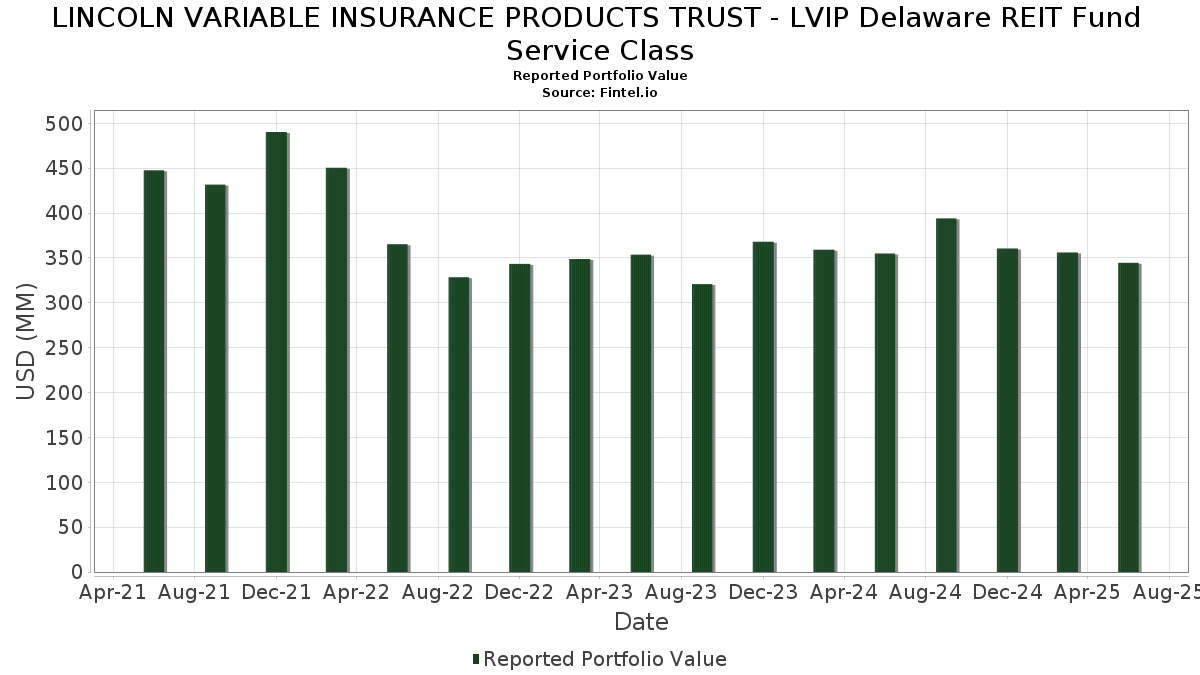
LINCOLN VARIABLE INSURANCE PRODUCTS TRUST - LVIP Delaware REIT Fund Service Class has disclosed 64 total holdings in their latest SEC filings. Most recent portfolio value is calculated to be $ 344,524,651 USD. Actual Assets Under Management (AUM) is this value plus cash (which is not disclosed). LINCOLN VARIABLE INSURANCE PRODUCTS TRUST - LVIP Delaware REIT Fund Service Class’s top holdings are Welltower Inc. (US:WELL) , Equinix, Inc. (US:EQIX) , Prologis, Inc. (US:PLD) , VICI Properties Inc. (US:VICI) , and Simon Property Group, Inc. (US:SPG) .
Top Increases This Quarter
We use the change in the portfolio allocation because this is the most meaningful metric. Changes can be due to trades or changes in share prices.
| Security | Shares (MM) |
Value (MM$) |
Portfolio % | ΔPortfolio % |
|---|---|---|---|---|
| 0.08 | 13.81 | 3.9945 | 0.8160 | |
| 0.08 | 8.18 | 2.3670 | 0.4448 | |
| 0.06 | 5.99 | 1.7327 | 0.1782 | |
| 0.33 | 5.13 | 1.4830 | 0.1548 | |
| 0.51 | 16.62 | 4.8062 | 0.1505 | |
| 0.28 | 16.31 | 4.7183 | 0.1188 | |
| 0.14 | 4.25 | 1.2279 | 0.1177 | |
| 0.04 | 4.35 | 1.2592 | 0.1163 | |
| 0.03 | 1.98 | 0.5714 | 0.0719 | |
| 0.16 | 4.76 | 1.3766 | 0.0674 |
Top Decreases This Quarter
We use the change in the portfolio allocation because this is the most meaningful metric. Changes can be due to trades or changes in share prices.
| Security | Shares (MM) |
Value (MM$) |
Portfolio % | ΔPortfolio % |
|---|---|---|---|---|
| 0.23 | 24.15 | 6.9856 | -0.4980 | |
| 0.07 | 5.03 | 1.4542 | -0.3389 | |
| 0.04 | 5.76 | 1.6672 | -0.1602 | |
| 0.18 | 28.14 | 8.1389 | -0.1570 | |
| 0.13 | 7.96 | 2.3029 | -0.1246 | |
| 0.17 | 7.73 | 2.2366 | -0.1244 | |
| 0.03 | 7.92 | 2.2904 | -0.1082 | |
| 0.06 | 6.36 | 1.8394 | -0.0932 | |
| 0.06 | 0.98 | 0.2838 | -0.0707 | |
| 0.25 | 8.04 | 2.3256 | -0.0665 |
13F and Fund Filings
This form was filed on 2025-08-06 for the reporting period 2025-06-30. Click the link icon to see the full transaction history.
Upgrade to unlock premium data and export to Excel ![]() .
.
| Security | Type | Avg Share Price | Shares (MM) |
ΔShares (%) |
ΔShares (%) |
Value ($MM) |
Portfolio (%) |
ΔPortfolio (%) |
|
|---|---|---|---|---|---|---|---|---|---|
| WELL / Welltower Inc. | 0.18 | -5.34 | 28.14 | -5.02 | 8.1389 | -0.1570 | |||
| EQIX / Equinix, Inc. | 0.03 | 0.00 | 25.31 | -2.44 | 7.3211 | 0.0565 | |||
| PLD / Prologis, Inc. | 0.23 | -3.90 | 24.15 | -9.63 | 6.9856 | -0.4980 | |||
| VICI / VICI Properties Inc. | 0.51 | 0.00 | 16.62 | -0.07 | 4.8062 | 0.1505 | |||
| SPG / Simon Property Group, Inc. | 0.10 | 0.00 | 16.42 | -3.20 | 4.7490 | -0.0006 | |||
| O / Realty Income Corporation | 0.28 | 0.00 | 16.31 | -0.69 | 4.7183 | 0.1188 | |||
| PSA / Public Storage | 0.05 | 0.00 | 15.51 | -1.96 | 4.4857 | 0.0563 | |||
| DLR / Digital Realty Trust, Inc. | 0.08 | 0.00 | 13.81 | 21.66 | 3.9945 | 0.8160 | |||
| AVB / AvalonBay Communities, Inc. | 0.05 | 0.00 | 10.64 | -5.19 | 3.0761 | -0.0646 | |||
| EQR / Equity Residential | 0.13 | 0.00 | 8.45 | -5.72 | 2.4429 | -0.0654 | |||
| BRX / Brixmor Property Group Inc. | 0.32 | 0.00 | 8.40 | -1.92 | 2.4281 | 0.0314 | |||
| EXR / Extra Space Storage Inc. | 0.06 | 0.00 | 8.36 | -0.71 | 2.4179 | 0.0605 | |||
| IRM / Iron Mountain Incorporated | 0.08 | 0.00 | 8.18 | 19.21 | 2.3670 | 0.4448 | |||
| INVH / Invitation Homes Inc. | 0.25 | 0.00 | 8.04 | -5.89 | 2.3256 | -0.0665 | |||
| VTR / Ventas, Inc. | 0.13 | 0.00 | 7.96 | -8.16 | 2.3029 | -0.1246 | |||
| ESS / Essex Property Trust, Inc. | 0.03 | 0.00 | 7.92 | -7.55 | 2.2904 | -0.1082 | |||
| GLPI / Gaming and Leisure Properties, Inc. | 0.17 | 0.00 | 7.73 | -8.29 | 2.2366 | -0.1244 | |||
| KIM / Kimco Realty Corporation | 0.33 | 0.00 | 6.93 | -1.04 | 2.0031 | 0.0436 | |||
| CPT / Camden Property Trust | 0.06 | 0.00 | 6.36 | -7.87 | 1.8394 | -0.0932 | |||
| RHP / Ryman Hospitality Properties, Inc. | 0.06 | 0.00 | 5.99 | 7.91 | 1.7327 | 0.1782 | |||
| MAA / Mid-America Apartment Communities, Inc. | 0.04 | 0.00 | 5.76 | -11.68 | 1.6672 | -0.1602 | |||
| REG / Regency Centers Corporation | 0.08 | 0.00 | 5.58 | -3.43 | 1.6145 | -0.0040 | |||
| GVMXX / State Street Institutional Investment Trust - State Street Institutional US Govt Money Market Fnd Premier Cls | 5.14 | -3.89 | 5.14 | -3.87 | 1.4854 | -0.0108 | |||
| HST / Host Hotels & Resorts, Inc. | 0.33 | 0.00 | 5.13 | 8.10 | 1.4830 | 0.1548 | |||
| ARE / Alexandria Real Estate Equities, Inc. | 0.07 | 0.00 | 5.03 | -21.49 | 1.4542 | -0.3389 | |||
| CUZ / Cousins Properties Incorporated | 0.16 | 0.00 | 4.76 | 1.80 | 1.3766 | 0.0674 | |||
| AMH / American Homes 4 Rent | 0.13 | 0.00 | 4.65 | -4.60 | 1.3441 | -0.0199 | |||
| CUBE / CubeSmart | 0.10 | 0.00 | 4.43 | -0.49 | 1.2808 | 0.0347 | |||
| LAMR / Lamar Advertising Company | 0.04 | 0.00 | 4.35 | 6.67 | 1.2592 | 0.1163 | |||
| CTRE / CareTrust REIT, Inc. | 0.14 | 0.00 | 4.25 | 7.06 | 1.2279 | 0.1177 | |||
| SUI / Sun Communities, Inc. | 0.03 | 0.00 | 3.76 | -1.67 | 1.0880 | 0.0168 | |||
| ELS / Equity LifeStyle Properties, Inc. | 0.06 | 0.00 | 3.52 | -7.55 | 1.0170 | -0.0479 | |||
| REXR / Rexford Industrial Realty, Inc. | 0.09 | 0.00 | 3.06 | -9.16 | 0.8861 | -0.0581 | |||
| APLE / Apple Hospitality REIT, Inc. | 0.25 | 0.00 | 2.88 | -9.63 | 0.8338 | -0.0592 | |||
| OUT / OUTFRONT Media Inc. | 0.16 | 0.00 | 2.59 | 1.13 | 0.7489 | 0.0319 | |||
| KRG / Kite Realty Group Trust | 0.09 | 0.00 | 2.13 | 1.24 | 0.6156 | 0.0270 | |||
| PDM / Piedmont Realty Trust, Inc. | 0.28 | 0.00 | 2.07 | -1.10 | 0.5991 | 0.0128 | |||
| BXP / Boston Properties, Inc. | 0.03 | 0.00 | 1.99 | 0.40 | 0.5755 | 0.0207 | |||
| EPR / EPR Properties | 0.03 | 0.00 | 1.98 | 10.71 | 0.5714 | 0.0719 | |||
| NHI / National Health Investors, Inc. | 0.02 | 0.00 | 1.72 | -5.07 | 0.4979 | -0.0098 | |||
| GOOD / Gladstone Commercial Corporation | 0.12 | 0.00 | 1.68 | -4.34 | 0.4845 | -0.0058 | |||
| PK / Park Hotels & Resorts Inc. | 0.15 | 0.00 | 1.49 | -4.24 | 0.4316 | -0.0046 | |||
| SHO / Sunstone Hotel Investors, Inc. | 0.16 | 0.00 | 1.43 | -7.76 | 0.4125 | -0.0204 | |||
| PLYM / Plymouth Industrial REIT, Inc. | 0.08 | 0.00 | 1.24 | -1.51 | 0.3591 | 0.0063 | |||
| CLDT / Chatham Lodging Trust | 0.17 | 0.00 | 1.20 | -2.21 | 0.3463 | 0.0034 | |||
| DOC / Healthpeak Properties, Inc. | 0.07 | 0.00 | 1.19 | -13.39 | 0.3443 | -0.0406 | |||
| IIPR / Innovative Industrial Properties, Inc. | 0.02 | 0.00 | 1.11 | 2.12 | 0.3205 | 0.0166 | |||
| COLD / Americold Realty Trust, Inc. | 0.06 | 0.00 | 0.98 | -22.51 | 0.2838 | -0.0707 | |||
| BNL / Broadstone Net Lease, Inc. | 0.06 | 0.00 | 0.97 | -5.82 | 0.2810 | -0.0078 | |||
| XHR / Xenia Hotels & Resorts, Inc. | 0.07 | 0.00 | 0.90 | 6.90 | 0.2601 | 0.0245 | |||
| TRNO / Terreno Realty Corporation | 0.02 | 0.00 | 0.89 | -11.31 | 0.2586 | -0.0237 | |||
| ALEX / Alexander & Baldwin, Inc. | 0.05 | 0.00 | 0.88 | 3.39 | 0.2560 | 0.0165 | |||
| PECO / Phillips Edison & Company, Inc. | 0.02 | 0.00 | 0.81 | -4.05 | 0.2333 | -0.0020 | |||
| MPW / Medical Properties Trust, Inc. | 0.14 | 0.00 | 0.59 | -28.52 | 0.1719 | -0.0609 | |||
| NXRT / NexPoint Residential Trust, Inc. | 0.02 | 0.00 | 0.51 | -15.65 | 0.1481 | -0.0220 | |||
| SITC / SITE Centers Corp. | 0.04 | 0.00 | 0.47 | -11.78 | 0.1365 | -0.0135 | |||
| RLJ / RLJ Lodging Trust | 0.06 | 0.00 | 0.45 | -7.57 | 0.1307 | -0.0064 | |||
| VNO / Vornado Realty Trust | 0.01 | 0.00 | 0.42 | 3.48 | 0.1204 | 0.0076 | |||
| SLG / SL Green Realty Corp. | 0.01 | 0.00 | 0.32 | 7.28 | 0.0938 | 0.0092 | |||
| OFC / Corporate Office Properties Trust | 0.01 | 0.00 | 0.28 | 1.45 | 0.0810 | 0.0035 | |||
| IVT / InvenTrust Properties Corp. | 0.01 | 0.00 | 0.19 | -6.34 | 0.0556 | -0.0021 | |||
| ALX / Alexander's, Inc. | 0.00 | 0.00 | 0.18 | 7.60 | 0.0534 | 0.0054 | |||
| UE / Urban Edge Properties | 0.01 | 0.00 | 0.18 | -2.15 | 0.0529 | 0.0008 | |||
| ONL / Orion Properties Inc. | 0.06 | 0.00 | 0.13 | -0.74 | 0.0389 | 0.0011 |