Basic Stats
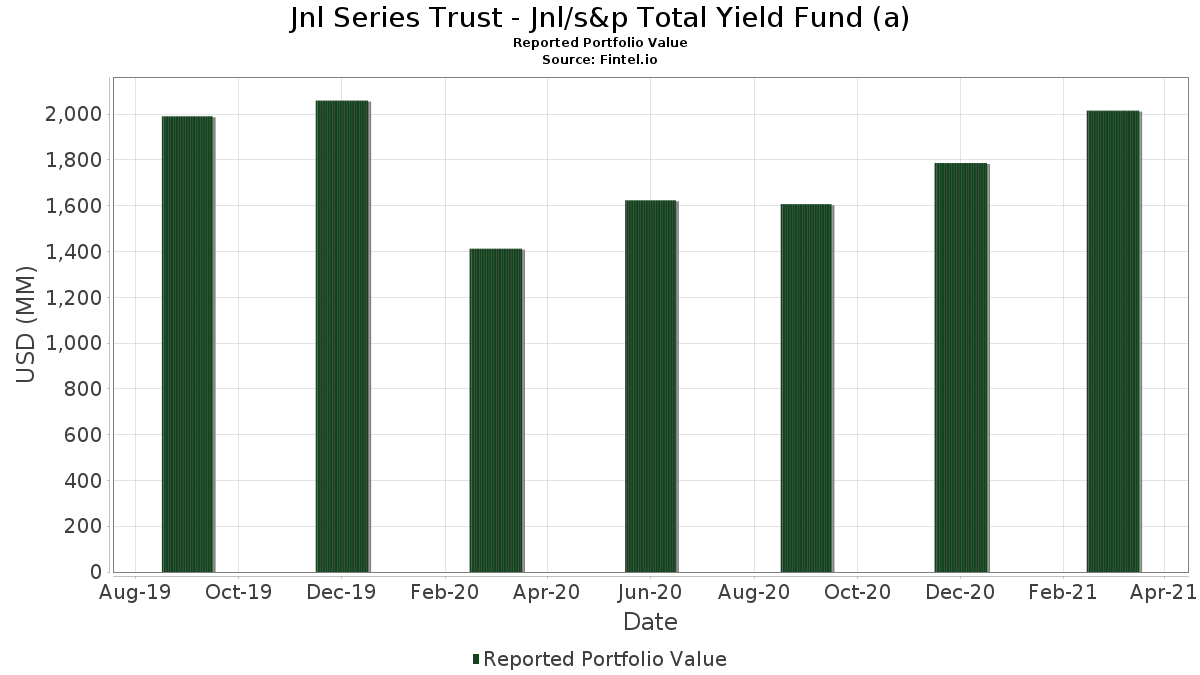
| Portfolio Value | $ 2,015,361,254 |
| Current Positions | 63 |
Latest Holdings, Performance, AUM (from 13F, 13D)
Jnl Series Trust - Jnl/s&p Total Yield Fund (a) has disclosed 63 total holdings in their latest SEC filings. Most recent portfolio value is calculated to be $ 2,015,361,254 USD. Actual Assets Under Management (AUM) is this value plus cash (which is not disclosed). Jnl Series Trust - Jnl/s&p Total Yield Fund (a)’s top holdings are Newell Brands Inc. (US:NWL) , International Paper Company (US:IP) , DaVita Inc. (US:DVA) , Discovery Inc - Class A (US:DISCA) , and Cardinal Health, Inc. (US:CAH) . Jnl Series Trust - Jnl/s&p Total Yield Fund (a)’s new positions include Treasury, United States Department of (US:US9127964L09) , United States Treasury Bill (US:US912796B328) , .
Top Increases This Quarter
We use the change in the portfolio allocation because this is the most meaningful metric. Changes can be due to trades or changes in share prices.
| Security | Shares (MM) |
Value (MM$) |
Portfolio % | ΔPortfolio % |
|---|---|---|---|---|
| 1.40 | 60.93 | 3.0174 | 0.5627 | |
| 0.17 | 56.20 | 2.7831 | 0.4804 | |
| 0.90 | 49.39 | 2.4457 | 0.3586 | |
| 2.96 | 79.25 | 3.9243 | 0.2685 | |
| 0.45 | 45.94 | 2.2747 | 0.2624 | |
| 0.43 | 25.86 | 1.2807 | 0.2544 | |
| 0.44 | 56.56 | 2.8008 | 0.2441 | |
| 0.20 | 22.17 | 1.0979 | 0.2417 | |
| 1.64 | 52.14 | 2.5819 | 0.2326 | |
| 19.80 | 19.80 | 0.9805 | 0.2204 |
Top Decreases This Quarter
We use the change in the portfolio allocation because this is the most meaningful metric. Changes can be due to trades or changes in share prices.
| Security | Shares (MM) |
Value (MM$) |
Portfolio % | ΔPortfolio % |
|---|---|---|---|---|
| 0.57 | 61.33 | 3.0371 | -0.8507 | |
| 2.21 | 53.58 | 2.6534 | -0.3256 | |
| 0.54 | 51.38 | 2.5444 | -0.3048 | |
| 1.27 | 68.62 | 3.3980 | -0.2738 | |
| 0.35 | 40.21 | 1.9912 | -0.2468 | |
| 0.67 | 33.58 | 1.6627 | -0.2158 | |
| 0.15 | 19.47 | 0.9640 | -0.2087 | |
| 1.82 | 21.29 | 1.0542 | -0.1931 | |
| 0.52 | 39.89 | 1.9756 | -0.1722 | |
| 0.61 | 36.74 | 1.8195 | -0.1405 |
13F and Fund Filings
This form was filed on 2021-05-27 for the reporting period 2021-03-31. Click the link icon to see the full transaction history.
Upgrade to unlock premium data and export to Excel ![]() .
.
| Security | Type | Avg Share Price | Shares (MM) |
ΔShares (%) |
ΔShares (%) |
Value ($MM) |
Portfolio (%) |
ΔPortfolio (%) |
|
|---|---|---|---|---|---|---|---|---|---|
| NWL / Newell Brands Inc. | 2.96 | -2.64 | 79.25 | 22.81 | 3.9243 | 0.2685 | |||
| IP / International Paper Company | 1.27 | -2.64 | 68.62 | 5.88 | 3.3980 | -0.2738 | |||
| DVA / DaVita Inc. | 0.57 | -2.64 | 61.33 | -10.63 | 3.0371 | -0.8507 | |||
| DISCA / Discovery Inc - Class A | 1.40 | -2.63 | 60.93 | 40.64 | 3.0174 | 0.5627 | |||
| CAH / Cardinal Health, Inc. | 0.97 | -2.63 | 59.20 | 10.44 | 2.9316 | -0.1054 | |||
| JNPR / Juniper Networks, Inc. | 2.28 | -2.63 | 57.64 | 9.57 | 2.8543 | -0.1261 | |||
| COF / Capital One Financial Corporation | 0.44 | -2.62 | 56.56 | 25.33 | 2.8008 | 0.2441 | |||
| URI / United Rentals, Inc. | 0.17 | -2.62 | 56.20 | 38.28 | 2.7831 | 0.4804 | |||
| XRX / Xerox Holdings Corporation | 2.21 | -2.63 | 53.58 | 1.91 | 2.6534 | -0.3256 | |||
| STX / Seagate Technology Holdings plc | 0.69 | -2.62 | 52.93 | 20.23 | 2.6211 | 0.1270 | |||
| HPQ / HP Inc. | 1.64 | -2.62 | 52.14 | 25.74 | 2.5819 | 0.2326 | |||
| DFS / Discover Financial Services | 0.54 | -2.63 | 51.38 | 2.17 | 2.5444 | -0.3048 | |||
| WBA / Walgreens Boots Alliance, Inc. | 0.90 | -2.61 | 49.39 | 34.06 | 2.4457 | 0.3586 | |||
| AMP / Ameriprise Financial, Inc. | 0.20 | -2.61 | 46.58 | 16.49 | 2.3066 | 0.0412 | |||
| LEN / Lennar Corporation | 0.45 | -2.61 | 45.94 | 29.33 | 2.2747 | 0.2624 | |||
| HCA / HCA Healthcare, Inc. | 0.24 | -2.62 | 45.05 | 11.52 | 2.2309 | -0.0577 | |||
| AXP / American Express Company | 0.31 | -2.61 | 44.00 | 13.92 | 2.1790 | -0.0093 | |||
| LKQ / LKQ Corporation | 1.02 | -2.61 | 43.22 | 16.98 | 2.1405 | 0.0470 | |||
| CSCO / Cisco Systems, Inc. | 0.81 | -2.61 | 41.71 | 12.54 | 2.0656 | -0.0344 | |||
| ALL / The Allstate Corporation | 0.35 | -2.61 | 40.21 | 1.79 | 1.9912 | -0.2468 | |||
| RTX / RTX Corporation | 0.52 | -2.61 | 39.89 | 5.23 | 1.9756 | -0.1722 | |||
| MAS / Masco Corporation | 0.61 | -2.60 | 36.74 | 6.21 | 1.8195 | -0.1405 | |||
| BIIB / Biogen Inc. | 0.13 | -2.60 | 36.74 | 11.28 | 1.8195 | -0.0512 | |||
| VNO / Vornado Realty Trust | 0.78 | -2.60 | 35.50 | 18.40 | 1.7580 | 0.0593 | |||
| CPB / The Campbell's Company | 0.67 | -2.60 | 33.58 | 1.27 | 1.6627 | -0.2158 | |||
| WHR / Whirlpool Corporation | 0.13 | -2.58 | 29.27 | 18.94 | 1.4495 | 0.0552 | |||
| JCI / Johnson Controls International plc | 0.46 | -2.57 | 27.71 | 24.78 | 1.3724 | 0.1141 | |||
| WRK / WestRock Company | 0.53 | -2.57 | 27.63 | 16.50 | 1.3684 | 0.0245 | |||
| NTAP / NetApp, Inc. | 0.36 | -2.57 | 26.42 | 6.89 | 1.3083 | -0.0921 | |||
| KSS / Kohl's Corporation | 0.43 | -2.55 | 25.86 | 42.77 | 1.2807 | 0.2544 | |||
| HBI / Hanesbrands Inc. | 1.28 | -3.06 | 25.23 | 30.79 | 1.2496 | 0.1565 | |||
| SPG / Simon Property Group, Inc. | 0.22 | -2.55 | 24.94 | 30.00 | 1.2351 | 0.1481 | |||
| WAT / Waters Corporation | 0.09 | -2.56 | 24.77 | 11.91 | 1.2265 | -0.0274 | |||
| HFC / HollyFrontier Corp | 0.67 | -3.04 | 24.14 | 34.20 | 1.1953 | 0.1763 | |||
| ORCL / Oracle Corporation | 0.34 | -2.56 | 24.10 | 5.69 | 1.1934 | -0.0984 | |||
| J / Jacobs Solutions Inc. | 0.18 | -3.05 | 23.78 | 15.01 | 1.1776 | 0.0062 | |||
| PWR / Quanta Services, Inc. | 0.26 | -2.55 | 23.31 | 19.05 | 1.1541 | 0.0450 | |||
| CTXS / Citrix Systems, Inc. | 0.16 | -2.56 | 23.06 | 5.12 | 1.1419 | -0.1009 | |||
| ADS / Bread Financial Holdings Inc | 0.20 | -3.02 | 22.17 | 46.69 | 1.0979 | 0.2417 | |||
| KHC / The Kraft Heinz Company | 0.55 | -2.55 | 21.98 | 12.46 | 1.0886 | -0.0188 | |||
| AMCR / Amcor plc | 1.82 | -2.55 | 21.29 | -3.30 | 1.0542 | -0.1931 | |||
| AMGN / Amgen Inc. | 0.09 | -2.55 | 21.16 | 5.46 | 1.0479 | -0.0889 | |||
| KMI / Kinder Morgan, Inc. | 1.26 | -2.53 | 20.96 | 18.72 | 1.0380 | 0.0376 | |||
| STT / State Street Corporation | 0.25 | -2.55 | 20.95 | 12.48 | 1.0376 | -0.0178 | |||
| M / Macy's, Inc. | 1.28 | -3.02 | 20.79 | 39.56 | 1.0294 | 0.1855 | |||
| EQR / Equity Residential | 0.29 | -2.53 | 20.43 | 17.77 | 1.0119 | 0.0289 | |||
| NTRS / Northern Trust Corporation | 0.19 | -2.54 | 20.35 | 9.99 | 1.0075 | -0.0405 | |||
| RL / Ralph Lauren Corporation | 0.16 | -2.53 | 19.83 | 15.72 | 0.9819 | 0.0111 | |||
| 46628D437 / JNL Government Money Market Fund | 19.80 | 47.58 | 19.80 | 47.59 | 0.9805 | 0.2204 | |||
| WU / The Western Union Company | 0.80 | -3.09 | 19.79 | 8.92 | 0.9800 | -0.0494 | |||
| GPC / Genuine Parts Company | 0.17 | -2.53 | 19.71 | 12.18 | 0.9761 | -0.0194 | |||
| WM / Waste Management, Inc. | 0.15 | -3.08 | 19.61 | 6.03 | 0.9710 | -0.0767 | |||
| UHS / Universal Health Services, Inc. | 0.15 | -3.05 | 19.47 | -5.95 | 0.9640 | -0.2087 | |||
| HSIC / Henry Schein, Inc. | 0.28 | -3.04 | 19.30 | 0.41 | 0.9558 | -0.1332 | |||
| T / AT&T Inc. | 0.62 | -3.35 | 18.90 | 1.73 | 0.9361 | -0.1167 | |||
| JWN / Nordstrom, Inc. | 0.49 | -3.02 | 18.54 | 17.67 | 0.9181 | 0.0255 | |||
| LEG / Leggett & Platt, Incorporated | 0.39 | -3.34 | 17.78 | -0.40 | 0.8805 | -0.1309 | |||
| DAL / Delta Air Lines, Inc. | 0.37 | -3.33 | 17.63 | 16.08 | 0.8731 | 0.0125 | |||
| TAP / Molson Coors Beverage Company | 0.34 | -3.02 | 17.52 | 9.78 | 0.8674 | -0.0366 | |||
| IBM / International Business Machines Corporation | 0.13 | -3.33 | 17.26 | 2.34 | 0.8547 | -0.1009 | |||
| US9127964L09 / Treasury, United States Department of | 0.73 | 0.0360 | 0.0360 | ||||||
| US912796B328 / United States Treasury Bill | 0.60 | 0.0296 | 0.0296 | ||||||
| FUTURE - CASH SETTLED / DE (N/A) | 0.25 | -323.21 | 0.0124 | 0.0000 |