Basic Stats
| Insider Profile | JACOBS ASSET MANAGEMENT, LLC |
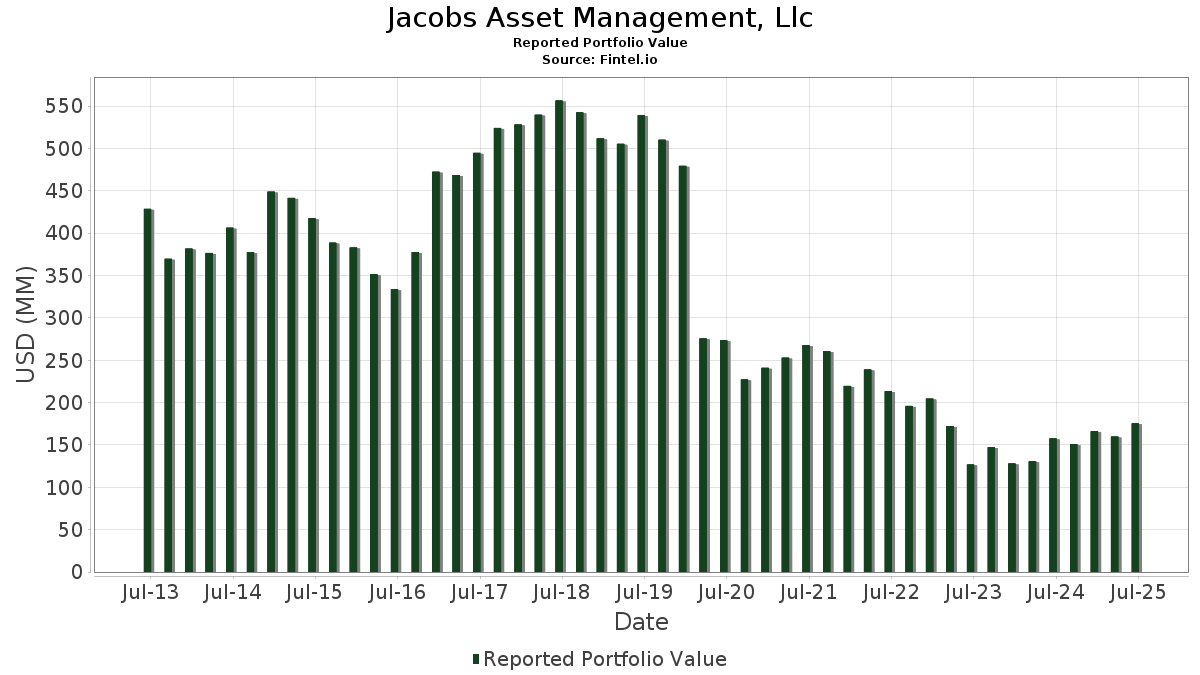
| Portfolio Value | $ 175,460,344 |
| Current Positions | 29 |
Latest Holdings, Performance, AUM (from 13F, 13D)
Jacobs Asset Management, Llc has disclosed 29 total holdings in their latest SEC filings. Most recent portfolio value is calculated to be $ 175,460,344 USD. Actual Assets Under Management (AUM) is this value plus cash (which is not disclosed). Jacobs Asset Management, Llc’s top holdings are Sprott Inc. (US:SII) , Popular, Inc. (US:BPOP) , First Citizens BancShares, Inc. (US:FCNCA) , QuinStreet, Inc. (US:QNST) , and The Allstate Corporation (US:ALL) . Jacobs Asset Management, Llc’s top industries are "Security And Commodity Brokers, Dealers, Exchanges, And Services" (sic 62) , "Business Services" (sic 73) , and "Non-depository Credit Institutions" (sic 61) .
Top Increases This Quarter
We use the change in the portfolio allocation because this is the most meaningful metric. Changes can be due to trades or changes in share prices.
| Security | Shares (MM) |
Value (MM$) |
Portfolio % | ΔPortfolio % |
|---|---|---|---|---|
| 0.12 | 5.66 | 3.2272 | 3.2272 | |
| 0.80 | 8.75 | 4.9843 | 2.6231 | |
| 0.11 | 3.98 | 2.2691 | 2.2691 | |
| 0.14 | 15.18 | 8.6513 | 1.5464 | |
| 0.71 | 11.47 | 6.5378 | 1.0252 | |
| 0.05 | 1.74 | 0.9913 | 0.9913 | |
| 0.04 | 2.85 | 1.6246 | 0.9568 | |
| 0.10 | 9.69 | 5.5209 | 0.8540 | |
| 0.14 | 9.30 | 5.2990 | 0.7782 | |
| 0.23 | 15.55 | 8.8597 | 0.7524 |
Top Decreases This Quarter
We use the change in the portfolio allocation because this is the most meaningful metric. Changes can be due to trades or changes in share prices.
| Security | Shares (MM) |
Value (MM$) |
Portfolio % | ΔPortfolio % |
|---|---|---|---|---|
| 0.05 | 1.74 | 0.9911 | -2.4017 | |
| 0.01 | 13.70 | 7.8053 | -2.0554 | |
| 0.07 | 0.69 | 0.3928 | -1.4054 | |
| 0.04 | 1.10 | 0.6257 | -1.3217 | |
| 0.15 | 4.32 | 2.4595 | -1.2458 | |
| 0.00 | 0.00 | -1.1563 | ||
| 0.62 | 8.56 | 4.8770 | -0.7531 | |
| 0.05 | 9.76 | 5.5645 | -0.7191 | |
| 0.14 | 3.45 | 1.9684 | -0.2832 | |
| 0.16 | 4.60 | 2.6217 | -0.1893 |
13D/G Filings
This is a list of 13D and 13G filings made in the last year (if any). Click the link icon to see the full transaction history. Green rows indicate new positions. Red rows indicate closed positions.
| File Date | Form | Security | Prev Shares |
Current Shares |
ΔShares % | % Ownership |
% ΔOwnership | |
|---|---|---|---|---|---|---|---|---|
| 2025-07-24 | PBBK / PB Bankshares, Inc. | 157,700 | 6.18 |
13F and Fund Filings
This form was filed on 2025-08-13 for the reporting period 2025-06-30. Click the link icon to see the full transaction history.
Upgrade to unlock premium data and export to Excel ![]() .
.
| Security | Type | Avg Share Price | Shares (MM) |
ΔShares (%) |
ΔShares (%) |
Value ($MM) |
Portfolio (%) |
ΔPortfolio (%) |
|
|---|---|---|---|---|---|---|---|---|---|
| SII / Sprott Inc. | 0.23 | -22.09 | 15.55 | 19.97 | 8.8597 | 0.7524 | |||
| BPOP / Popular, Inc. | 0.14 | 12.04 | 15.18 | 33.68 | 8.6513 | 1.5464 | |||
| FCNCA / First Citizens BancShares, Inc. | 0.01 | -17.65 | 13.70 | -13.10 | 7.8053 | -2.0554 | |||
| QNST / QuinStreet, Inc. | 0.71 | 44.27 | 11.47 | 30.20 | 6.5378 | 1.0252 | |||
| ALL / The Allstate Corporation | 0.05 | 0.00 | 9.76 | -2.78 | 5.5645 | -0.7191 | |||
| CCB / Coastal Financial Corporation | 0.10 | 21.21 | 9.69 | 29.89 | 5.5209 | 0.8540 | |||
| QCRH / QCR Holdings, Inc. | 0.14 | 35.16 | 9.30 | 28.68 | 5.2990 | 0.7782 | |||
| MAX / MediaAlpha, Inc. | 0.80 | 95.55 | 8.75 | 131.78 | 4.9843 | 2.6231 | |||
| NPB / Northpointe Bancshares, Inc. | 0.62 | 0.16 | 8.56 | -4.90 | 4.8770 | -0.7531 | |||
| OSBC / Old Second Bancorp, Inc. | 0.46 | 14.66 | 8.20 | 22.23 | 4.6761 | 0.4765 | |||
| AMRK / A-Mark Precious Metals, Inc. | 0.36 | 32.11 | 7.98 | 15.49 | 4.5508 | 0.2252 | |||
| MYFW / First Western Financial, Inc. | 0.34 | 4.56 | 7.67 | 20.05 | 4.3716 | 0.3736 | |||
| FBK / FB Financial Corporation | 0.12 | 5.66 | 3.2272 | 3.2272 | |||||
| EVER / EverQuote, Inc. | 0.21 | 11.69 | 5.06 | 3.12 | 2.8859 | -0.1866 | |||
| COFS / ChoiceOne Financial Services, Inc. | 0.16 | 2.64 | 4.60 | 2.38 | 2.6217 | -0.1893 | |||
| OFG / OFG Bancorp | 0.10 | 29.21 | 4.39 | 38.22 | 2.5003 | 0.5139 | |||
| MOFG / MidWestOne Financial Group, Inc. | 0.15 | -25.00 | 4.32 | -27.14 | 2.4595 | -1.2458 | |||
| TREE / LendingTree, Inc. | 0.11 | 3.98 | 2.2691 | 2.2691 | |||||
| BHLB / Berkshire Hills Bancorp, Inc. | 0.14 | 0.00 | 3.45 | -4.03 | 1.9684 | -0.2832 | |||
| PGR / The Progressive Corporation | 0.01 | 25.00 | 3.34 | 17.84 | 1.9011 | 0.1304 | |||
| SFBS / ServisFirst Bancshares, Inc. | 0.04 | 184.60 | 2.85 | 167.10 | 1.6246 | 0.9568 | |||
| AOMR / Angel Oak Mortgage REIT, Inc. | 0.27 | -1.55 | 2.54 | -2.68 | 1.4496 | -0.1857 | |||
| BRBS / Blue Ridge Bankshares, Inc. | 0.59 | 38.82 | 2.12 | 52.92 | 1.2072 | 0.3403 | |||
| TRMK / Trustmark Corporation | 0.05 | 1.74 | 0.9913 | 0.9913 | |||||
| FSUN / FirstSun Capital Bancorp | 0.05 | -66.64 | 1.74 | -67.95 | 0.9911 | -2.4017 | |||
| NWFL / Norwood Financial Corp. | 0.05 | -15.43 | 1.31 | -9.79 | 0.7455 | -0.1618 | |||
| FISI / Financial Institutions, Inc. | 0.04 | -65.72 | 1.10 | -64.75 | 0.6257 | -1.3217 | |||
| SBCF / Seacoast Banking Corporation of Florida | 0.03 | 0.77 | 0.4408 | 0.4408 | |||||
| AGNC / AGNC Investment Corp. | 0.07 | -75.00 | 0.69 | -76.03 | 0.3928 | -1.4054 | |||
| MITT / AG Mortgage Investment Trust, Inc. | 0.00 | -100.00 | 0.00 | 0.0000 | |||||
| EFSI / Eagle Financial Services, Inc. | 0.00 | -100.00 | 0.00 | 0.0000 | |||||
| PPBI / Pacific Premier Bancorp, Inc. | 0.00 | -100.00 | 0.00 | 0.0000 | |||||
| MAX / MediaAlpha, Inc. | Call | 0.00 | -100.00 | 0.00 | -100.00 | -1.1563 | |||
| EFC / Ellington Financial Inc. | 0.00 | -100.00 | 0.00 | 0.0000 | |||||
| IBOC / International Bancshares Corporation | 0.00 | -100.00 | 0.00 | 0.0000 |