Basic Stats
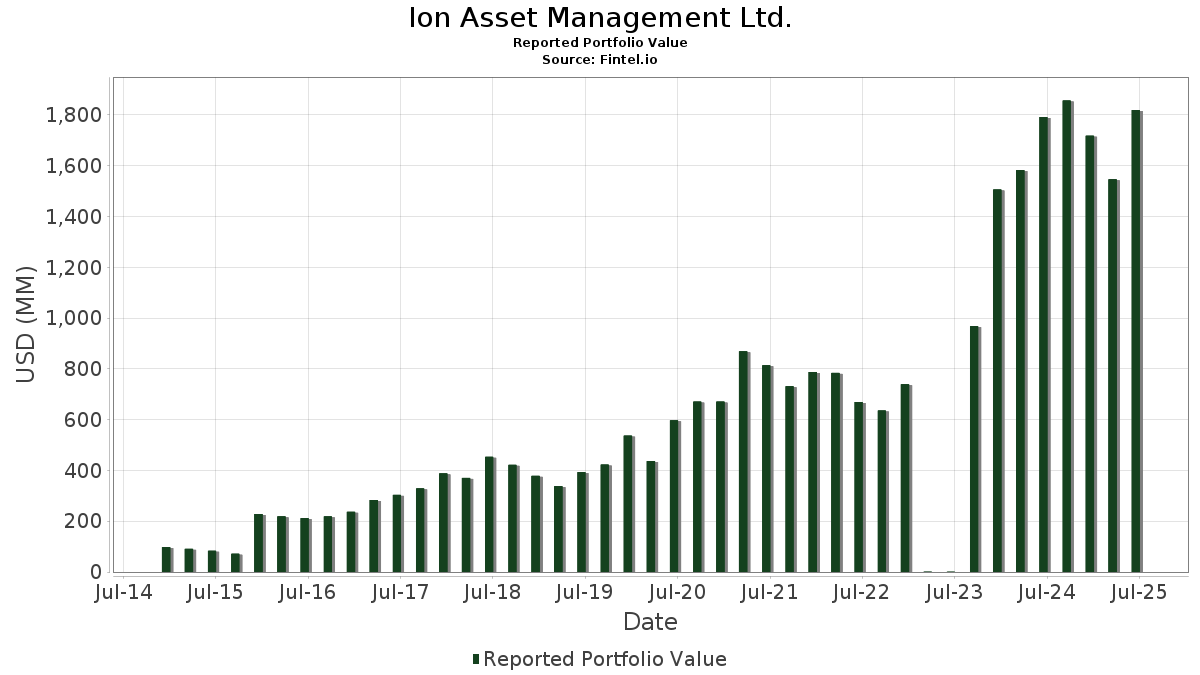
| Portfolio Value | $ 1,818,794,612 |
| Current Positions | 65 |
Latest Holdings, Performance, AUM (from 13F, 13D)
Ion Asset Management Ltd. has disclosed 65 total holdings in their latest SEC filings. Most recent portfolio value is calculated to be $ 1,818,794,612 USD. Actual Assets Under Management (AUM) is this value plus cash (which is not disclosed). Ion Asset Management Ltd.’s top holdings are Teva Pharmaceutical Industries Limited - Depositary Receipt (Common Stock) (US:TEVA) , AerCap Holdings N.V. (US:AER) , Perrigo Company plc (US:PRGO) , Ciena Corporation (US:CIEN) , and CoStar Group, Inc. (US:CSGP) . Ion Asset Management Ltd.’s new positions include iShares Bitcoin Trust ETF (US:IBIT) , ZIM Integrated Shipping Services Ltd. (US:ZIM) , eToro Group Ltd. (US:ETOR) , CVR Energy, Inc. (US:CVI) , and Voyager Technologies, Inc. (US:VOYG) . Ion Asset Management Ltd.’s top industries are "Engineering, Accounting, Research, Management, And Related Services" (sic 87) , "Electric, Gas, And Sanitary Services " (sic 49) , and "Chemicals And Allied Products" (sic 28) .
Top Increases This Quarter
We use the change in the portfolio allocation because this is the most meaningful metric. Changes can be due to trades or changes in share prices.
| Security | Shares (MM) |
Value (MM$) |
Portfolio % | ΔPortfolio % |
|---|---|---|---|---|
| 1.63 | 84.38 | 2.8885 | 2.8885 | |
| 1.17 | 94.05 | 3.2197 | 2.4977 | |
| 0.60 | 52.95 | 1.8126 | 1.8126 | |
| 0.45 | 27.54 | 1.5144 | 1.5144 | |
| 0.95 | 15.24 | 0.8380 | 0.8380 | |
| 0.20 | 13.32 | 0.7322 | 0.7322 | |
| 0.18 | 4.82 | 0.2651 | 0.2651 | |
| 0.05 | 1.96 | 0.1079 | 0.1079 | |
| 0.02 | 1.11 | 0.0609 | 0.0609 | |
| 0.03 | 1.05 | 0.0575 | 0.0575 |
Top Decreases This Quarter
We use the change in the portfolio allocation because this is the most meaningful metric. Changes can be due to trades or changes in share prices.
| Security | Shares (MM) |
Value (MM$) |
Portfolio % | ΔPortfolio % |
|---|---|---|---|---|
| 0.07 | 40.93 | 1.4012 | -7.5797 | |
| 38.35 | 642.71 | 35.3372 | -3.4683 | |
| 0.95 | 111.03 | 3.8009 | -3.0456 | |
| 1.21 | 98.51 | 3.3723 | -1.9308 | |
| 3.82 | 102.01 | 3.4920 | -1.6478 | |
| 0.20 | 16.13 | 0.5522 | -1.4889 | |
| 0.75 | 71.65 | 2.4526 | -1.3128 | |
| 0.98 | 50.97 | 1.7447 | -1.1531 | |
| 0.82 | 30.82 | 1.0551 | -0.9761 | |
| 1.12 | 36.73 | 1.2573 | -0.9609 |
13D/G Filings
This is a list of 13D and 13G filings made in the last year (if any). Click the link icon to see the full transaction history. Green rows indicate new positions. Red rows indicate closed positions.
| File Date | Form | Security | Prev Shares |
Current Shares |
ΔShares % | % Ownership |
% ΔOwnership | |
|---|---|---|---|---|---|---|---|---|
| 2025-08-14 | DK / Delek US Holdings, Inc. | 3,258,371 | 3,743,890 | 14.90 | 6.17 | 22.18 |
13F and Fund Filings
This form was filed on 2025-08-15 for the reporting period 2025-06-30. Click the link icon to see the full transaction history.
Upgrade to unlock premium data and export to Excel ![]() .
.
| Security | Type | Avg Share Price | Shares (MM) |
ΔShares (%) |
ΔShares (%) |
Value ($MM) |
Portfolio (%) |
ΔPortfolio (%) |
|
|---|---|---|---|---|---|---|---|---|---|
| TEVA / Teva Pharmaceutical Industries Limited - Depositary Receipt (Common Stock) | 38.35 | -1.76 | 642.71 | 7.13 | 35.3372 | -3.4683 | |||
| AER / AerCap Holdings N.V. | 0.95 | -8.40 | 111.03 | 4.90 | 3.8009 | -3.0456 | |||
| PRGO / Perrigo Company plc | 3.82 | 34.71 | 102.01 | 28.37 | 3.4920 | -1.6478 | |||
| CIEN / Ciena Corporation | 1.21 | -10.72 | 98.51 | 20.15 | 3.3723 | -1.9308 | |||
| CSGP / CoStar Group, Inc. | 1.17 | 730.26 | 94.05 | 742.55 | 3.2197 | 2.4977 | |||
| LW / Lamb Weston Holdings, Inc. | 1.63 | 84.38 | 2.8885 | 2.8885 | |||||
| DK / Delek US Holdings, Inc. | 3.74 | 1.84 | 79.30 | 43.12 | 2.7145 | -0.8691 | |||
| ILMN / Illumina, Inc. | 0.75 | 2.34 | 71.65 | 23.07 | 2.4526 | -1.3128 | |||
| DAC / Danaos Corporation | 0.65 | 15.46 | 56.43 | 27.61 | 1.9317 | -0.9285 | |||
| TLT / iShares Trust - iShares 20+ Year Treasury Bond ETF | Put | 0.60 | 52.95 | 1.8126 | 1.8126 | ||||
| GDX / VanEck ETF Trust - VanEck Gold Miners ETF | 0.98 | 0.45 | 50.97 | 13.76 | 1.7447 | -1.1531 | |||
| QQQ / Invesco QQQ Trust, Series 1 | Put | 0.07 | -74.94 | 40.93 | -70.52 | 1.4012 | -7.5797 | ||
| SLV / iShares Silver Trust | 1.12 | 1.16 | 36.73 | 7.10 | 1.2573 | -0.9609 | |||
| NMM / Navios Maritime Partners L.P. - Limited Partnership | 0.82 | 2.16 | 30.82 | -1.85 | 1.0551 | -0.9761 | |||
| PHIN / PHINIA Inc. | 0.63 | -2.13 | 27.82 | 2.63 | 0.9525 | -0.8012 | |||
| IBIT / iShares Bitcoin Trust ETF | Put | 0.45 | 27.54 | 1.5144 | 1.5144 | ||||
| IMAX / IMAX Corporation | 0.78 | -14.53 | 21.75 | -9.30 | 0.7445 | -0.8065 | |||
| OKTA / Okta, Inc. | 0.17 | -15.04 | 16.68 | -19.27 | 0.5711 | -0.7656 | |||
| DT / Dynatrace, Inc. | 0.30 | 15.38 | 16.56 | 35.11 | 0.5670 | -0.2259 | |||
| HYG / iShares Trust - iShares iBoxx $ High Yield Corporate Bond ETF | Put | 0.20 | -50.00 | 16.13 | -48.88 | 0.5522 | -1.4889 | ||
| ZIM / ZIM Integrated Shipping Services Ltd. | Call | 0.95 | 15.24 | 0.8380 | 0.8380 | ||||
| MNDY / monday.com Ltd. | 0.05 | 15.08 | 14.40 | 48.84 | 0.4928 | -0.1328 | |||
| ETOR / eToro Group Ltd. | 0.20 | 13.32 | 0.7322 | 0.7322 | |||||
| XYZ / Block, Inc. | 0.18 | 0.00 | 12.23 | 25.03 | 0.4186 | -0.2140 | |||
| RIG / Transocean Ltd. | 3.90 | -9.30 | 10.10 | -25.90 | 0.3458 | -0.5359 | |||
| ITRI / Itron, Inc. | 0.07 | 0.00 | 9.48 | 25.66 | 0.3244 | -0.1634 | |||
| UAN / CVR Partners, LP - Limited Partnership | 0.09 | 0.00 | 7.69 | 18.19 | 0.2634 | -0.1577 | |||
| TTMI / TTM Technologies, Inc. | 0.17 | -47.47 | 7.07 | 4.56 | 0.2420 | -0.1953 | |||
| FCX / Freeport-McMoRan Inc. | Call | 0.15 | 0.00 | 6.50 | 14.49 | 0.2226 | -0.1447 | ||
| TTD / The Trade Desk, Inc. | 0.08 | -42.86 | 5.76 | -24.82 | 0.1972 | -0.2984 | |||
| CVI / CVR Energy, Inc. | Call | 0.18 | 4.82 | 0.2651 | 0.2651 | ||||
| MTSI / MACOM Technology Solutions Holdings, Inc. | 0.02 | 53.85 | 2.87 | 119.71 | 0.0981 | 0.0137 | |||
| IBIT / iShares Bitcoin Trust ETF | 0.04 | 0.00 | 2.45 | 30.77 | 0.1346 | 0.0135 | |||
| GLD / SPDR Gold Trust | 0.01 | -2.68 | 2.05 | 2.97 | 0.1125 | -0.0160 | |||
| VOYG / Voyager Technologies, Inc. | 0.05 | 1.96 | 0.1079 | 0.1079 | |||||
| SIL / Global X Funds - Global X Silver Miners ETF | 0.03 | 15.36 | 1.48 | 40.74 | 0.0508 | -0.0174 | |||
| AEM / Agnico Eagle Mines Limited | 0.01 | 0.00 | 1.32 | 9.67 | 0.0451 | -0.0326 | |||
| GDXJ / VanEck ETF Trust - VanEck Junior Gold Miners ETF | 0.02 | -8.64 | 1.25 | 7.94 | 0.0428 | -0.0321 | |||
| WPM / Wheaton Precious Metals Corp. | 0.01 | -12.77 | 1.23 | 0.90 | 0.0421 | -0.0367 | |||
| PANW / Palo Alto Networks, Inc. | 0.01 | -17.99 | 1.17 | -1.60 | 0.0399 | -0.0368 | |||
| IBKR / Interactive Brokers Group, Inc. | 0.02 | 1.11 | 0.0609 | 0.0609 | |||||
| MP / MP Materials Corp. | 0.03 | 1.05 | 0.0575 | 0.0575 | |||||
| CMI / Cummins Inc. | 0.00 | -10.58 | 1.01 | -6.57 | 0.0346 | -0.0354 | |||
| MOS / The Mosaic Company | 0.03 | 0.99 | 0.0339 | 0.0339 | |||||
| FCX / Freeport-McMoRan Inc. | 0.02 | -78.80 | 0.93 | -75.75 | 0.0319 | -0.2167 | |||
| LITE / Lumentum Holdings Inc. | 0.01 | 0.87 | 0.0299 | 0.0299 | |||||
| KMI / Kinder Morgan, Inc. | 0.03 | 0.00 | 0.84 | 3.06 | 0.0289 | -0.0241 | |||
| PARR / Par Pacific Holdings, Inc. | 0.03 | 0.84 | 0.0461 | 0.0461 | |||||
| NTR / Nutrien Ltd. | 0.01 | 0.00 | 0.82 | 17.38 | 0.0282 | -0.0172 | |||
| KTOS / Kratos Defense & Security Solutions, Inc. | 0.02 | 0.82 | 0.0453 | 0.0453 | |||||
| CVI / CVR Energy, Inc. | 0.03 | 0.74 | 0.0409 | 0.0409 | |||||
| RGLD / Royal Gold, Inc. | 0.00 | 0.73 | 0.0401 | 0.0401 | |||||
| XOM / Exxon Mobil Corporation | 0.01 | 0.00 | 0.66 | -9.44 | 0.0227 | -0.0246 | |||
| VAL / Valaris Limited | 0.02 | 0.00 | 0.66 | 7.33 | 0.0226 | -0.0172 | |||
| EOG / EOG Resources, Inc. | 0.01 | 0.00 | 0.66 | -6.81 | 0.0225 | -0.0231 | |||
| SCCO / Southern Copper Corporation | 0.01 | 0.98 | 0.61 | 9.37 | 0.0208 | -0.0152 | |||
| RTX / RTX Corporation | 0.00 | 36.07 | 0.61 | 49.75 | 0.0207 | -0.0054 | |||
| SBLK / Star Bulk Carriers Corp. | 0.03 | 0.00 | 0.52 | 10.83 | 0.0179 | -0.0126 | |||
| NSC / Norfolk Southern Corporation | 0.00 | -24.80 | 0.48 | -18.75 | 0.0165 | -0.0218 | |||
| GNK / Genco Shipping & Trading Limited | 0.04 | -6.60 | 0.48 | -8.64 | 0.0163 | -0.0174 | |||
| NXE / NexGen Energy Ltd. | 0.07 | 0.46 | 0.0256 | 0.0256 | |||||
| GLNG / Golar LNG Limited | 0.01 | 0.00 | 0.45 | 8.54 | 0.0152 | -0.0113 | |||
| PAA / Plains All American Pipeline, L.P. - Limited Partnership | 0.02 | 0.00 | 0.44 | -8.47 | 0.0152 | -0.0161 | |||
| BEKE / KE Holdings Inc. - Depositary Receipt (Common Stock) | 0.02 | 0.39 | 0.0212 | 0.0212 | |||||
| COST / Costco Wholesale Corporation | 0.00 | -26.25 | 0.29 | -22.75 | 0.0100 | -0.0145 | |||
| ASHR / DBX ETF Trust - Xtrackers Harvest CSI 300 China A-Shares ETF | 0.00 | -100.00 | 0.00 | 0.0000 | |||||
| PR / Permian Resources Corporation | 0.00 | -100.00 | 0.00 | 0.0000 | |||||
| SEDG / SolarEdge Technologies, Inc. | 0.00 | -100.00 | 0.00 | 0.0000 | |||||
| PI / Impinj, Inc. | 0.00 | -100.00 | 0.00 | 0.0000 | |||||
| MPC / Marathon Petroleum Corporation | 0.00 | -100.00 | 0.00 | 0.0000 | |||||
| XLE / The Select Sector SPDR Trust - The Energy Select Sector SPDR Fund | Call | 0.00 | -100.00 | 0.00 | 0.0000 | ||||
| MRVL / Marvell Technology, Inc. | 0.00 | -100.00 | 0.00 | 0.0000 | |||||
| QRVO / Qorvo, Inc. | 0.00 | -100.00 | 0.00 | 0.0000 | |||||
| EWZ / iShares, Inc. - iShares MSCI Brazil ETF | Call | 0.00 | -100.00 | 0.00 | 0.0000 |