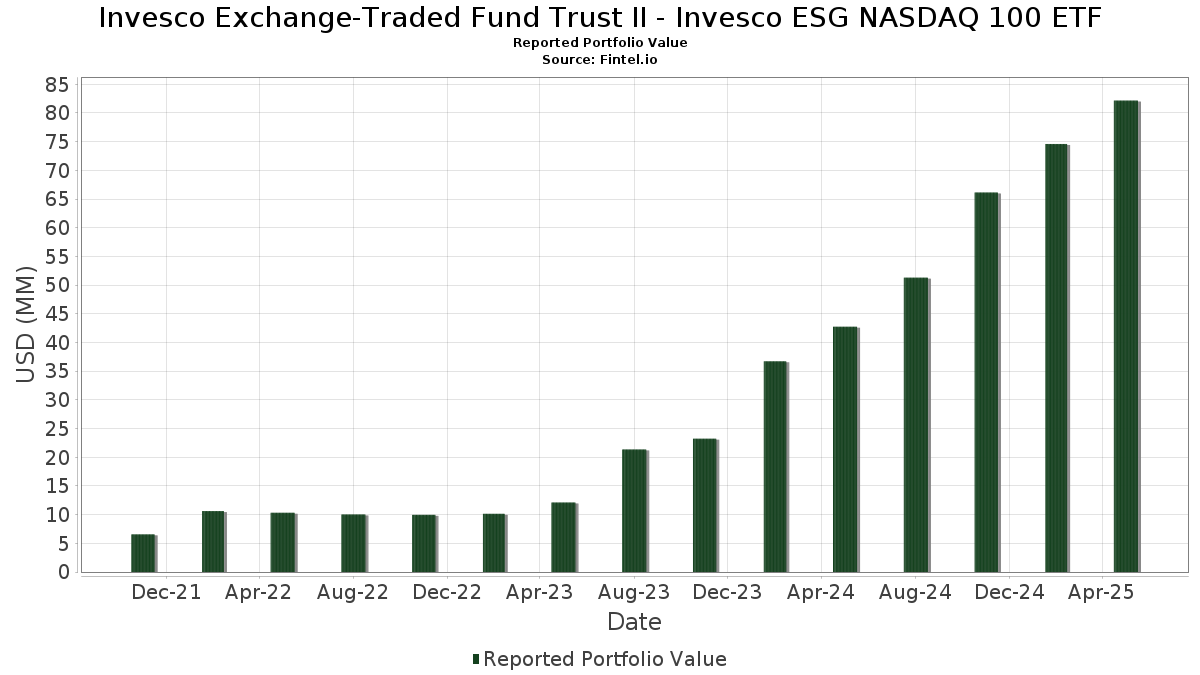
Basic Stats
| Portfolio Value | $ 82,158,313 |
| Current Positions | 93 |
Latest Holdings, Performance, AUM (from 13F, 13D)
Invesco Exchange-Traded Fund Trust II - Invesco ESG NASDAQ 100 ETF has disclosed 93 total holdings in their latest SEC filings. Most recent portfolio value is calculated to be $ 82,158,313 USD. Actual Assets Under Management (AUM) is this value plus cash (which is not disclosed). Invesco Exchange-Traded Fund Trust II - Invesco ESG NASDAQ 100 ETF’s top holdings are NVIDIA Corporation (US:NVDA) , Microsoft Corporation (US:MSFT) , Apple Inc. (US:AAPL) , Broadcom Inc. (US:AVGO) , and Netflix, Inc. (US:NFLX) .
Top Increases This Quarter
We use the change in the portfolio allocation because this is the most meaningful metric. Changes can be due to trades or changes in share prices.
| Security | Shares (MM) |
Value (MM$) |
Portfolio % | ΔPortfolio % |
|---|---|---|---|---|
| 0.02 | 8.86 | 10.8888 | 0.9534 | |
| 0.62 | 0.62 | 0.7577 | 0.7577 | |
| 0.00 | 3.28 | 4.0374 | 0.7383 | |
| 0.01 | 1.36 | 1.6731 | 0.6378 | |
| 0.02 | 3.82 | 4.6970 | 0.5097 | |
| 0.01 | 2.96 | 3.6333 | 0.4310 | |
| 0.01 | 2.04 | 2.5048 | 0.3863 | |
| 0.24 | 0.24 | 0.2905 | 0.2905 | |
| 0.00 | 1.27 | 1.5620 | 0.2849 | |
| 0.01 | 1.28 | 1.5777 | 0.2168 |
Top Decreases This Quarter
We use the change in the portfolio allocation because this is the most meaningful metric. Changes can be due to trades or changes in share prices.
| Security | Shares (MM) |
Value (MM$) |
Portfolio % | ΔPortfolio % |
|---|---|---|---|---|
| 0.03 | 6.98 | 8.5817 | -2.5011 | |
| 0.02 | 0.46 | 0.5640 | -0.2461 | |
| 0.01 | 0.33 | 0.4002 | -0.2117 | |
| 0.01 | 0.44 | 0.5383 | -0.2093 | |
| 0.01 | 1.23 | 1.5063 | -0.2086 | |
| 0.01 | 1.10 | 1.3547 | -0.2044 | |
| 0.00 | 0.30 | 0.3641 | -0.2029 | |
| 0.00 | 0.11 | 0.1359 | -0.1448 | |
| 0.01 | 0.94 | 1.1542 | -0.1401 | |
| 0.01 | 1.52 | 1.8700 | -0.1328 |
13F and Fund Filings
This form was filed on 2025-07-28 for the reporting period 2025-05-31. Click the link icon to see the full transaction history.
Upgrade to unlock premium data and export to Excel ![]() .
.
| Security | Type | Avg Share Price | Shares (MM) |
ΔShares (%) |
ΔShares (%) |
Value ($MM) |
Portfolio (%) |
ΔPortfolio (%) |
|
|---|---|---|---|---|---|---|---|---|---|
| NVDA / NVIDIA Corporation | 0.07 | 5.53 | 8.94 | 14.16 | 10.9941 | 0.1670 | |||
| MSFT / Microsoft Corporation | 0.02 | 6.25 | 8.86 | 23.21 | 10.8888 | 0.9534 | |||
| AAPL / Apple Inc. | 0.03 | 4.82 | 6.98 | -12.95 | 8.5817 | -2.5011 | |||
| AVGO / Broadcom Inc. | 0.02 | 3.90 | 3.82 | 26.11 | 4.6970 | 0.5097 | |||
| NFLX / Netflix, Inc. | 0.00 | 11.75 | 3.28 | 37.59 | 4.0374 | 0.7383 | |||
| AMZN / Amazon.com, Inc. | 0.01 | 32.08 | 2.96 | 27.59 | 3.6333 | 0.4310 | |||
| TSLA / Tesla, Inc. | 0.01 | 12.41 | 2.04 | 32.96 | 2.5048 | 0.3863 | |||
| CSCO / Cisco Systems, Inc. | 0.03 | 12.15 | 1.77 | 10.28 | 2.1774 | -0.0424 | |||
| LIN / Linde plc | 0.00 | 11.52 | 1.63 | 11.61 | 2.0099 | -0.0141 | |||
| GOOGL / Alphabet Inc. | 0.01 | 5.08 | 1.60 | 5.95 | 1.9716 | -0.1200 | |||
| GOOG / Alphabet Inc. | 0.01 | 4.59 | 1.52 | 4.97 | 1.8700 | -0.1328 | |||
| PLTR / Palantir Technologies Inc. | 0.01 | 17.07 | 1.36 | 81.82 | 1.6731 | 0.6378 | |||
| COST / Costco Wholesale Corporation | 0.00 | 12.42 | 1.31 | 11.51 | 1.6089 | -0.0131 | |||
| AMD / Advanced Micro Devices, Inc. | 0.01 | 17.54 | 1.28 | 30.39 | 1.5777 | 0.2168 | |||
| INTU / Intuit Inc. | 0.00 | 12.03 | 1.27 | 37.59 | 1.5620 | 0.2849 | |||
| TMUS / T-Mobile US, Inc. | 0.01 | 9.96 | 1.23 | -1.21 | 1.5063 | -0.2086 | |||
| ADBE / Adobe Inc. | 0.00 | 10.75 | 1.22 | 4.82 | 1.4979 | -0.1086 | |||
| BKNG / Booking Holdings Inc. | 0.00 | 18.68 | 1.19 | 30.70 | 1.4657 | 0.2038 | |||
| ISRG / Intuitive Surgical, Inc. | 0.00 | 11.86 | 1.13 | 7.86 | 1.3834 | -0.0594 | |||
| QCOM / QUALCOMM Incorporated | 0.01 | 5.74 | 1.10 | -2.31 | 1.3547 | -0.2044 | |||
| META / Meta Platforms, Inc. | 0.00 | 12.58 | 1.09 | 9.12 | 1.3399 | -0.0410 | |||
| AMAT / Applied Materials, Inc. | 0.01 | 10.05 | 0.94 | 9.15 | 1.1583 | -0.0349 | |||
| PEP / PepsiCo, Inc. | 0.01 | 17.05 | 0.94 | 0.21 | 1.1542 | -0.1401 | |||
| PANW / Palo Alto Networks, Inc. | 0.00 | 15.66 | 0.90 | 16.82 | 1.1027 | 0.0419 | |||
| ADP / Automatic Data Processing, Inc. | 0.00 | 11.99 | 0.86 | 15.81 | 1.0539 | 0.0296 | |||
| TXN / Texas Instruments Incorporated | 0.00 | 12.72 | 0.78 | 5.23 | 0.9645 | -0.0666 | |||
| LRCX / Lam Research Corporation | 0.01 | 11.97 | 0.75 | 17.95 | 0.9215 | 0.0427 | |||
| KLAC / KLA Corporation | 0.00 | 25.68 | 0.70 | 34.16 | 0.8655 | 0.1404 | |||
| AMGN / Amgen Inc. | 0.00 | 11.90 | 0.69 | 4.68 | 0.8532 | -0.0632 | |||
| APP / AppLovin Corporation | 0.00 | 15.92 | 0.66 | 40.00 | 0.8094 | 0.1587 | |||
| GILD / Gilead Sciences, Inc. | 0.01 | 11.92 | 0.65 | 7.93 | 0.8030 | -0.0346 | |||
| CRWD / CrowdStrike Holdings, Inc. | 0.00 | 11.92 | 0.64 | 35.53 | 0.7836 | 0.1329 | |||
| Invesco Private Prime Fund / STIV (N/A) | 0.62 | 0.62 | 0.7577 | 0.7577 | |||||
| VRTX / Vertex Pharmaceuticals Incorporated | 0.00 | 12.06 | 0.60 | 3.25 | 0.7425 | -0.0660 | |||
| CMCSA / Comcast Corporation | 0.02 | 10.14 | 0.60 | 6.18 | 0.7394 | -0.0440 | |||
| MELI / MercadoLibre, Inc. | 0.00 | 12.20 | 0.59 | 35.71 | 0.7249 | 0.1236 | |||
| MU / Micron Technology, Inc. | 0.01 | 12.03 | 0.59 | 12.93 | 0.7202 | 0.0038 | |||
| ORLY / O'Reilly Automotive, Inc. | 0.00 | 11.11 | 0.57 | 10.60 | 0.7062 | -0.0116 | |||
| ASML / ASML Holding N.V. - Depositary Receipt (Common Stock) | 0.00 | 16.88 | 0.55 | 21.38 | 0.6713 | 0.0498 | |||
| CTAS / Cintas Corporation | 0.00 | 12.04 | 0.55 | 22.20 | 0.6712 | 0.0542 | |||
| CDNS / Cadence Design Systems, Inc. | 0.00 | 0.33 | 0.52 | 14.98 | 0.6424 | 0.0143 | |||
| FTNT / Fortinet, Inc. | 0.00 | 11.66 | 0.49 | 5.16 | 0.6018 | -0.0412 | |||
| SNPS / Synopsys, Inc. | 0.00 | 12.24 | 0.48 | 13.88 | 0.5962 | 0.0077 | |||
| INTC / Intel Corporation | 0.02 | -4.99 | 0.46 | -21.84 | 0.5640 | -0.2461 | |||
| SBUX / Starbucks Corporation | 0.01 | 11.67 | 0.44 | -19.07 | 0.5383 | -0.2093 | |||
| PYPL / PayPal Holdings, Inc. | 0.01 | 11.12 | 0.43 | 9.74 | 0.5275 | -0.0120 | |||
| ADSK / Autodesk, Inc. | 0.00 | 11.93 | 0.41 | 20.88 | 0.5057 | 0.0353 | |||
| MDLZ / Mondelez International, Inc. | 0.01 | 2.80 | 0.41 | 8.20 | 0.5032 | -0.0205 | |||
| MAR / Marriott International, Inc. | 0.00 | 10.43 | 0.39 | 3.72 | 0.4807 | -0.0395 | |||
| DASH / DoorDash, Inc. | 0.00 | 4.03 | 0.36 | 9.23 | 0.4372 | -0.0122 | |||
| PAYX / Paychex, Inc. | 0.00 | 11.60 | 0.34 | 16.22 | 0.4240 | 0.0137 | |||
| WDAY / Workday, Inc. | 0.00 | 18.92 | 0.33 | 11.95 | 0.4039 | -0.0020 | |||
| ROP / Roper Technologies, Inc. | 0.00 | 11.46 | 0.33 | 8.64 | 0.4025 | -0.0136 | |||
| MRVL / Marvell Technology, Inc. | 0.01 | 12.18 | 0.33 | -26.47 | 0.4002 | -0.2117 | |||
| REGN / Regeneron Pharmaceuticals, Inc. | 0.00 | 2.90 | 0.30 | -27.80 | 0.3641 | -0.2029 | |||
| NXPI / NXP Semiconductors N.V. | 0.00 | 24.76 | 0.29 | 10.57 | 0.3612 | -0.0060 | |||
| CPRT / Copart, Inc. | 0.01 | 0.13 | 0.28 | -6.02 | 0.3459 | -0.0675 | |||
| ROST / Ross Stores, Inc. | 0.00 | 11.10 | 0.28 | 11.29 | 0.3395 | -0.0046 | |||
| VRSK / Verisk Analytics, Inc. | 0.00 | 10.63 | 0.27 | 17.32 | 0.3337 | 0.0132 | |||
| EA / Electronic Arts Inc. | 0.00 | 11.02 | 0.26 | 23.47 | 0.3240 | 0.0294 | |||
| ZS / Zscaler, Inc. | 0.00 | 11.56 | 0.26 | 57.32 | 0.3173 | 0.0897 | |||
| IDXX / IDEXX Laboratories, Inc. | 0.00 | 10.82 | 0.26 | 29.80 | 0.3169 | 0.0431 | |||
| CTSH / Cognizant Technology Solutions Corporation | 0.00 | 10.72 | 0.26 | 7.56 | 0.3159 | -0.0141 | |||
| CCEP / Coca-Cola Europacific Partners PLC | 0.00 | -1.77 | 0.25 | 4.53 | 0.3133 | -0.0237 | |||
| TTWO / Take-Two Interactive Software, Inc. | 0.00 | 11.93 | 0.25 | 19.62 | 0.3080 | 0.0182 | |||
| LULU / lululemon athletica inc. | 0.00 | 10.42 | 0.25 | -4.25 | 0.3053 | -0.0536 | |||
| ABNB / Airbnb, Inc. | 0.00 | 14.15 | 0.24 | 6.17 | 0.2968 | -0.0179 | |||
| EXC / Exelon Corporation | 0.01 | 10.70 | 0.24 | 9.59 | 0.2961 | -0.0072 | |||
| CHTR / Charter Communications, Inc. | 0.00 | 11.28 | 0.24 | 21.43 | 0.2933 | 0.0214 | |||
| Invesco Private Government Fund / STIV (N/A) | 0.24 | 0.24 | 0.2905 | 0.2905 | |||||
| DDOG / Datadog, Inc. | 0.00 | 13.21 | 0.23 | 14.85 | 0.2857 | 0.0052 | |||
| ODFL / Old Dominion Freight Line, Inc. | 0.00 | 11.01 | 0.21 | 0.95 | 0.2621 | -0.0304 | |||
| MSTR / Strategy Inc | 0.00 | -20.03 | 0.20 | 16.00 | 0.2500 | 0.0068 | |||
| CDW / CDW Corporation | 0.00 | 10.70 | 0.20 | 12.29 | 0.2477 | -0.0008 | |||
| AZN / AstraZeneca PLC - Depositary Receipt (Common Stock) | 0.00 | 9.56 | 0.20 | 4.71 | 0.2463 | -0.0182 | |||
| TEAM / Atlassian Corporation | 0.00 | 13.59 | 0.20 | -17.23 | 0.2433 | -0.0864 | |||
| ANSS / ANSYS, Inc. | 0.00 | 11.58 | 0.19 | 11.05 | 0.2351 | -0.0035 | |||
| KDP / Keurig Dr Pepper Inc. | 0.01 | 9.55 | 0.19 | 10.06 | 0.2298 | -0.0050 | |||
| PDD / PDD Holdings Inc. - Depositary Receipt (Common Stock) | 0.00 | 11.39 | 0.19 | -5.13 | 0.2275 | -0.0430 | |||
| FAST / Fastenal Company | 0.00 | 123.47 | 0.18 | 21.85 | 0.2270 | 0.0178 | |||
| DXCM / DexCom, Inc. | 0.00 | 20.66 | 0.17 | 17.01 | 0.2119 | 0.0086 | |||
| GEHC / GE HealthCare Technologies Inc. | 0.00 | 11.76 | 0.16 | -9.88 | 0.1912 | -0.0470 | |||
| TTD / The Trade Desk, Inc. | 0.00 | 9.52 | 0.15 | 17.83 | 0.1872 | 0.0076 | |||
| CSGP / CoStar Group, Inc. | 0.00 | 9.59 | 0.14 | 5.88 | 0.1777 | -0.0113 | |||
| WBD / Warner Bros. Discovery, Inc. | 0.01 | 11.73 | 0.14 | -2.80 | 0.1712 | -0.0268 | |||
| GFS / GLOBALFOUNDRIES Inc. | 0.00 | 11.37 | 0.12 | 2.59 | 0.1471 | -0.0137 | |||
| MNST / Monster Beverage Corporation | 0.00 | 11.75 | 0.11 | 31.03 | 0.1414 | 0.0198 | |||
| PCAR / PACCAR Inc | 0.00 | -37.80 | 0.11 | -45.81 | 0.1359 | -0.1448 | |||
| BIIB / Biogen Inc. | 0.00 | 11.78 | 0.10 | 3.23 | 0.1181 | -0.0105 | |||
| ON / ON Semiconductor Corporation | 0.00 | 9.56 | 0.09 | -2.27 | 0.1066 | -0.0159 | |||
| MCHP / Microchip Technology Incorporated | 0.00 | 9.50 | 0.08 | 7.89 | 0.1020 | -0.0042 | |||
| US8252528851 / Invesco Government & Agency Portfolio, Institutional Class | 0.08 | 735.21 | 0.08 | 744.44 | 0.0937 | 0.0811 | |||
| KHC / The Kraft Heinz Company | 0.00 | 9.49 | 0.07 | -3.90 | 0.0910 | -0.0164 |