Basic Stats
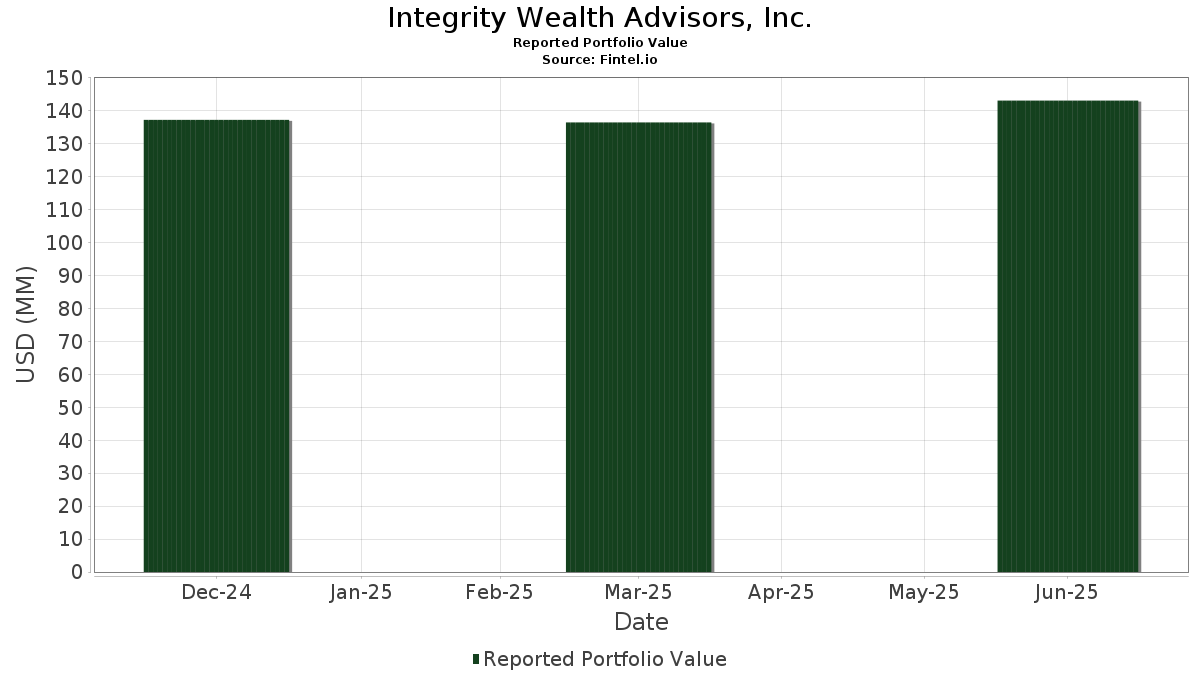
| Portfolio Value | $ 143,096,858 |
| Current Positions | 64 |
Latest Holdings, Performance, AUM (from 13F, 13D)
Integrity Wealth Advisors, Inc. has disclosed 64 total holdings in their latest SEC filings. Most recent portfolio value is calculated to be $ 143,096,858 USD. Actual Assets Under Management (AUM) is this value plus cash (which is not disclosed). Integrity Wealth Advisors, Inc.’s top holdings are First Trust Exchange-Traded Fund III - First Trust Preferred Securities and Income ETF (US:FPE) , Davis Fundamental ETF Trust - Davis Select International ETF (US:DINT) , First Trust Exchange-Traded Fund VI - First Trust Rising Dividend Achievers ETF (US:RDVY) , Genasys Inc. (US:GNSS) , and Berkshire Hathaway Inc. (US:BRK.B) . Integrity Wealth Advisors, Inc.’s new positions include VanEck ETF Trust - VanEck Semiconductor ETF (US:SMH) , Micron Technology, Inc. (US:MU) , Edison International (US:EIX) , First Trust Exchange-Traded Fund VI - First Trust RBA American Industrial Renaissance ETF (US:AIRR) , and CrowdStrike Holdings, Inc. (US:CRWD) . Integrity Wealth Advisors, Inc.’s top industries are "Electronic And Other Electrical Equipment And Components, Except Computer Equipment" (sic 36) .
Top Increases This Quarter
We use the change in the portfolio allocation because this is the most meaningful metric. Changes can be due to trades or changes in share prices.
| Security | Shares (MM) |
Value (MM$) |
Portfolio % | ΔPortfolio % |
|---|---|---|---|---|
| 0.29 | 17.97 | 12.5591 | 2.8266 | |
| 0.03 | 2.50 | 1.7443 | 1.4062 | |
| 0.77 | 19.91 | 13.9134 | 1.2265 | |
| 0.00 | 0.90 | 0.6268 | 0.6268 | |
| 0.29 | 1.65 | 1.1512 | 0.6097 | |
| 0.01 | 0.82 | 0.5741 | 0.5741 | |
| 0.00 | 1.61 | 1.1238 | 0.5255 | |
| 0.01 | 2.09 | 1.4622 | 0.4353 | |
| 0.02 | 1.29 | 0.8985 | 0.4043 | |
| 0.02 | 0.51 | 0.3590 | 0.3590 |
Top Decreases This Quarter
We use the change in the portfolio allocation because this is the most meaningful metric. Changes can be due to trades or changes in share prices.
| Security | Shares (MM) |
Value (MM$) |
Portfolio % | ΔPortfolio % |
|---|---|---|---|---|
| 6.93 | 11.99 | 8.3775 | -3.3176 | |
| 1.15 | 20.55 | 14.3633 | -1.6868 | |
| 0.02 | 8.11 | 5.6644 | -1.2164 | |
| 0.02 | 3.25 | 2.2689 | -0.7387 | |
| 0.04 | 6.68 | 4.6666 | -0.6526 | |
| 0.26 | 7.50 | 5.2389 | -0.5819 | |
| 0.72 | 1.05 | 0.7320 | -0.3067 | |
| 0.02 | 1.08 | 0.7549 | -0.2954 | |
| 0.03 | 1.75 | 1.2216 | -0.1835 | |
| 0.00 | 1.05 | 0.7317 | -0.1589 |
13D/G Filings
This is a list of 13D and 13G filings made in the last year (if any). Click the link icon to see the full transaction history. Green rows indicate new positions. Red rows indicate closed positions.
| File Date | Form | Security | Prev Shares |
Current Shares |
ΔShares % | % Ownership |
% ΔOwnership | |
|---|---|---|---|---|---|---|---|---|
| 2024-09-26 | GNSS / Genasys Inc. | 5,819,279 | 6,654,818 | 14.36 | 14.92 | -6.16 |
13F and Fund Filings
This form was filed on 2025-08-14 for the reporting period 2025-06-30. Click the link icon to see the full transaction history.
Upgrade to unlock premium data and export to Excel ![]() .
.