Basic Stats
| Insider Profile | GOFF JOHN C |
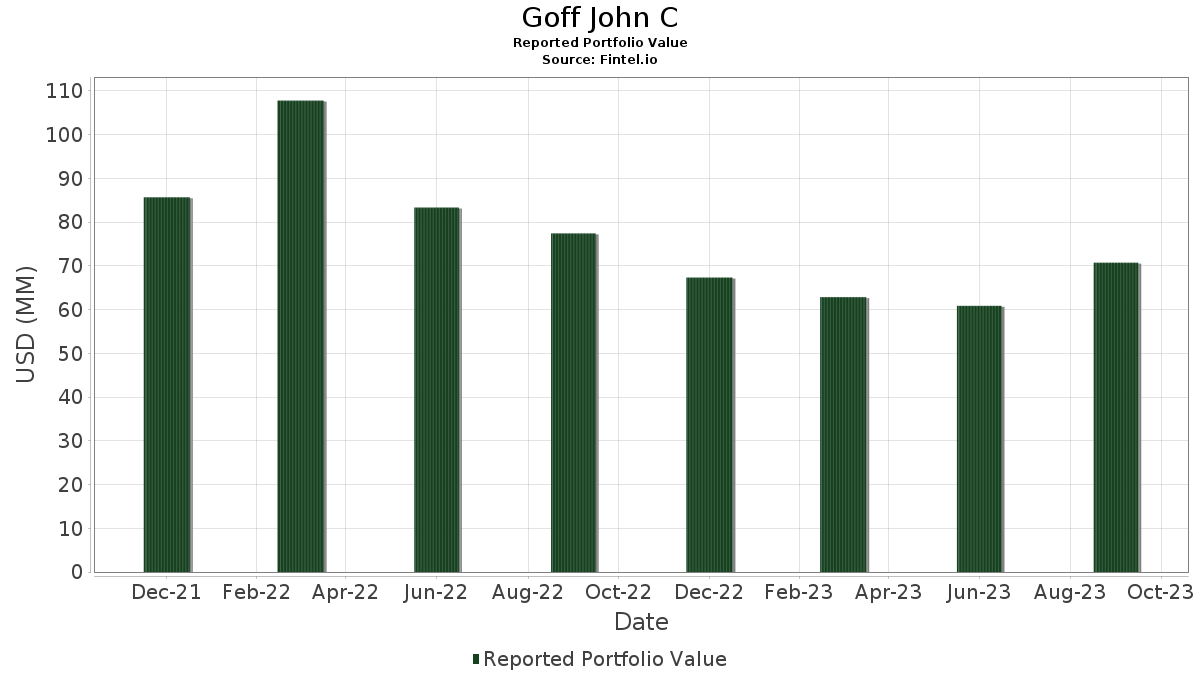
| Portfolio Value | $ 70,717,766 |
| Current Positions | 7 |
Latest Holdings, Performance, AUM (from 13F, 13D)
Goff John C has disclosed 7 total holdings in their latest SEC filings. Most recent portfolio value is calculated to be $ 70,717,766 USD. Actual Assets Under Management (AUM) is this value plus cash (which is not disclosed). Goff John C’s top holdings are Crescent Energy Company (US:CRGY) , Alpine Income Property Trust, Inc. (US:PINE) , GameSquare Holdings, Inc. (US:GAME) , FTAI Aviation Ltd. (US:FTAI) , and Microsoft Corporation (US:MSFT) . Goff John C’s top industries are "Oil And Gas Extraction" (sic 13) .
Top Increases This Quarter
We use the change in the portfolio allocation because this is the most meaningful metric. Changes can be due to trades or changes in share prices.
| Security | Shares (MM) |
Value (MM$) |
Portfolio % | ΔPortfolio % |
|---|---|---|---|---|
| 4.68 | 59.21 | 83.7319 | 3.5146 | |
| 0.05 | 0.26 | 0.3740 | 0.0178 |
Top Decreases This Quarter
We use the change in the portfolio allocation because this is the most meaningful metric. Changes can be due to trades or changes in share prices.
| Security | Shares (MM) |
Value (MM$) |
Portfolio % | ΔPortfolio % |
|---|---|---|---|---|
| 0.53 | 8.75 | 12.3732 | -1.9094 | |
| 0.76 | 1.66 | 2.3484 | -1.4448 | |
| 0.00 | 0.33 | 0.4644 | -0.1177 | |
| 0.01 | 0.46 | 0.6494 | -0.0409 | |
| 0.01 | 0.04 | 0.0588 | -0.0195 |
13D/G Filings
This is a list of 13D and 13G filings made in the last year (if any). Click the link icon to see the full transaction history. Green rows indicate new positions. Red rows indicate closed positions.
| File Date | Form | Security | Prev Shares |
Current Shares |
ΔShares % | % Ownership |
% ΔOwnership | |
|---|---|---|---|---|---|---|---|---|
| 2025-08-22 | GAME / GameSquare Holdings, Inc. | 6,342,653 | 6,342,653 | 0.00 | 6.40 | -61.21 | ||
| 2025-05-23 | CRGY / Crescent Energy Company | 9,741,648 | 9,805,786 | 0.66 | 3.80 | -30.78 |
13F and Fund Filings
This form was filed on 2023-11-03 for the reporting period 2023-09-30. Click the link icon to see the full transaction history.
Upgrade to unlock premium data and export to Excel ![]() .
.
| Security | Type | Avg Share Price | Shares (MM) |
ΔShares (%) |
ΔShares (%) |
Value ($MM) |
Portfolio (%) |
ΔPortfolio (%) |
|
|---|---|---|---|---|---|---|---|---|---|
| CRGY / Crescent Energy Company | 4.68 | 0.00 | 59.21 | 21.31 | 83.7319 | 3.5146 | |||
| PINE / Alpine Income Property Trust, Inc. | 0.53 | 0.00 | 8.75 | 0.68 | 12.3732 | -1.9094 | |||
| GAME / GameSquare Holdings, Inc. | 0.76 | 0.00 | 1.66 | -28.08 | 2.3484 | -1.4448 | |||
| FTAI / FTAI Aviation Ltd. | 0.01 | -2.64 | 0.46 | 9.29 | 0.6494 | -0.0409 | |||
| MSFT / Microsoft Corporation | 0.00 | 0.00 | 0.33 | -7.34 | 0.4644 | -0.1177 | |||
| HLLY / Holley Inc. | 0.05 | 0.00 | 0.26 | 22.22 | 0.3740 | 0.0178 | |||
| FIP / FTAI Infrastructure Inc. | 0.01 | 0.00 | 0.04 | -12.77 | 0.0588 | -0.0195 |