Basic Stats
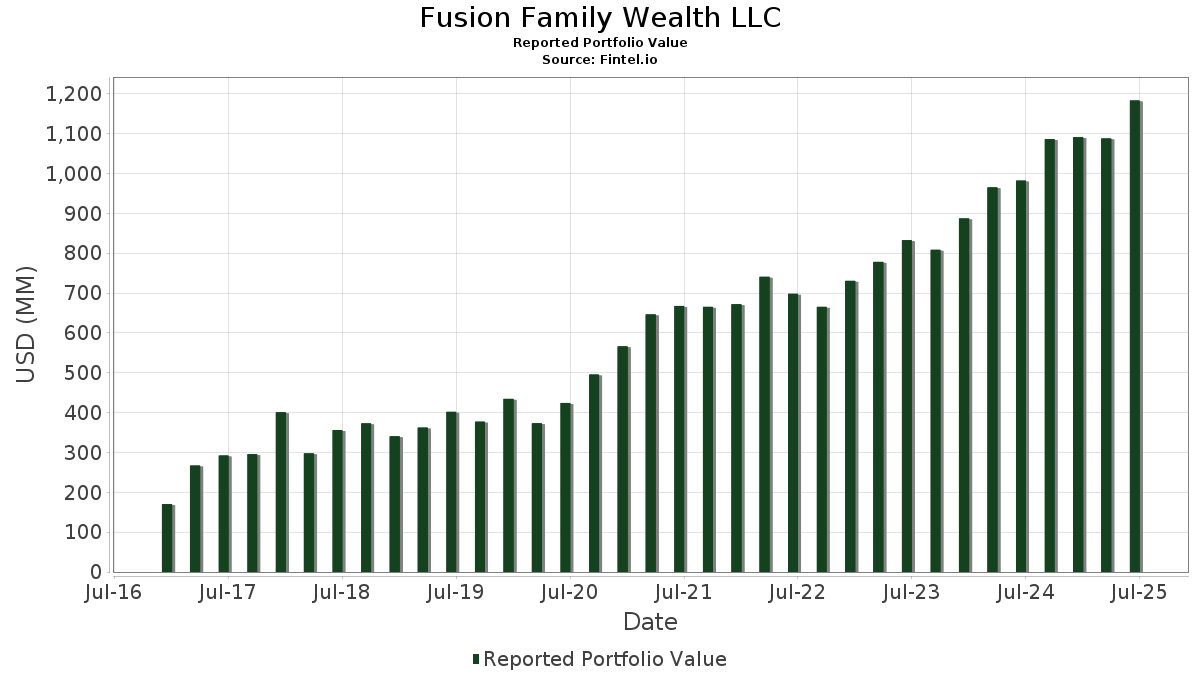
| Portfolio Value | $ 1,182,889,245 |
| Current Positions | 47 |
Latest Holdings, Performance, AUM (from 13F, 13D)
Fusion Family Wealth LLC has disclosed 47 total holdings in their latest SEC filings. Most recent portfolio value is calculated to be $ 1,182,889,245 USD. Actual Assets Under Management (AUM) is this value plus cash (which is not disclosed). Fusion Family Wealth LLC’s top holdings are Vanguard Index Funds - Vanguard S&P 500 ETF (US:VOO) , Invesco Exchange-Traded Fund Trust II - Invesco S&P 500 Revenue ETF (US:RWL) , Vanguard Tax-Managed Funds - Vanguard FTSE Developed Markets ETF (US:VEA) , Vanguard Emerging Markets Stock Index Fund (US:VERSX) , and Vanguard Index Funds - Vanguard Small-Cap ETF (US:VB) . Fusion Family Wealth LLC’s new positions include General Electric Company (US:GE) , . Fusion Family Wealth LLC’s top industries are "Metal Mining" (sic 10) , "Mining And Quarrying Of Nonmetallic Minerals, Except Fuels" (sic 14) , and "Heavy Construction Other Than Building Construction Contractors" (sic 16) .
Top Increases This Quarter
We use the change in the portfolio allocation because this is the most meaningful metric. Changes can be due to trades or changes in share prices.
| Security | Shares (MM) |
Value (MM$) |
Portfolio % | ΔPortfolio % |
|---|---|---|---|---|
| 0.38 | 214.55 | 18.1374 | 0.7634 | |
| 0.10 | 57.30 | 4.8442 | 0.3630 | |
| 0.56 | 46.64 | 3.9431 | 0.2472 | |
| 1.17 | 70.25 | 5.9387 | 0.2164 | |
| 0.15 | 34.39 | 2.9072 | 0.1971 | |
| 0.04 | 23.06 | 1.9494 | 0.1809 | |
| 1.83 | 104.60 | 8.8430 | 0.1789 | |
| 0.41 | 97.74 | 8.2631 | 0.1746 | |
| 0.02 | 1.30 | 0.1102 | 0.0477 | |
| 0.00 | 0.27 | 0.0231 | 0.0231 |
Top Decreases This Quarter
We use the change in the portfolio allocation because this is the most meaningful metric. Changes can be due to trades or changes in share prices.
| Security | Shares (MM) |
Value (MM$) |
Portfolio % | ΔPortfolio % |
|---|---|---|---|---|
| 0.11 | 14.41 | 1.2185 | -0.5661 | |
| 0.01 | 5.83 | 0.4933 | -0.4957 | |
| 1.58 | 164.74 | 13.9268 | -0.4190 | |
| 0.18 | 19.59 | 1.6559 | -0.3568 | |
| 2.09 | 103.24 | 8.7277 | -0.3089 | |
| 1.80 | 35.11 | 2.9685 | -0.1011 | |
| 1.63 | 33.35 | 2.8197 | -0.0680 | |
| 1.44 | 62.54 | 5.2872 | -0.0466 | |
| 0.52 | 61.03 | 5.1597 | -0.0235 | |
| 0.12 | 2.39 | 0.2021 | -0.0232 |
13D/G Filings
This is a list of 13D and 13G filings made in the last year (if any). Click the link icon to see the full transaction history. Green rows indicate new positions. Red rows indicate closed positions.
| File Date | Form | Security | Prev Shares |
Current Shares |
ΔShares % | % Ownership |
% ΔOwnership | |
|---|---|---|---|---|---|---|---|---|
| 2025-07-30 | RWK / Invesco Exchange-Traded Fund Trust II - Invesco S&P MidCap 400 Revenue ETF | 440,114 | 527,424 | 19.84 | 7.60 | -29.17 |
13F and Fund Filings
This form was filed on 2025-07-30 for the reporting period 2025-06-30. Click the link icon to see the full transaction history.
Upgrade to unlock premium data and export to Excel ![]() .
.