Basic Stats
| Portfolio Value | $ 646,664,949 |
| Current Positions | 50 |
Latest Holdings, Performance, AUM (from 13F, 13D)
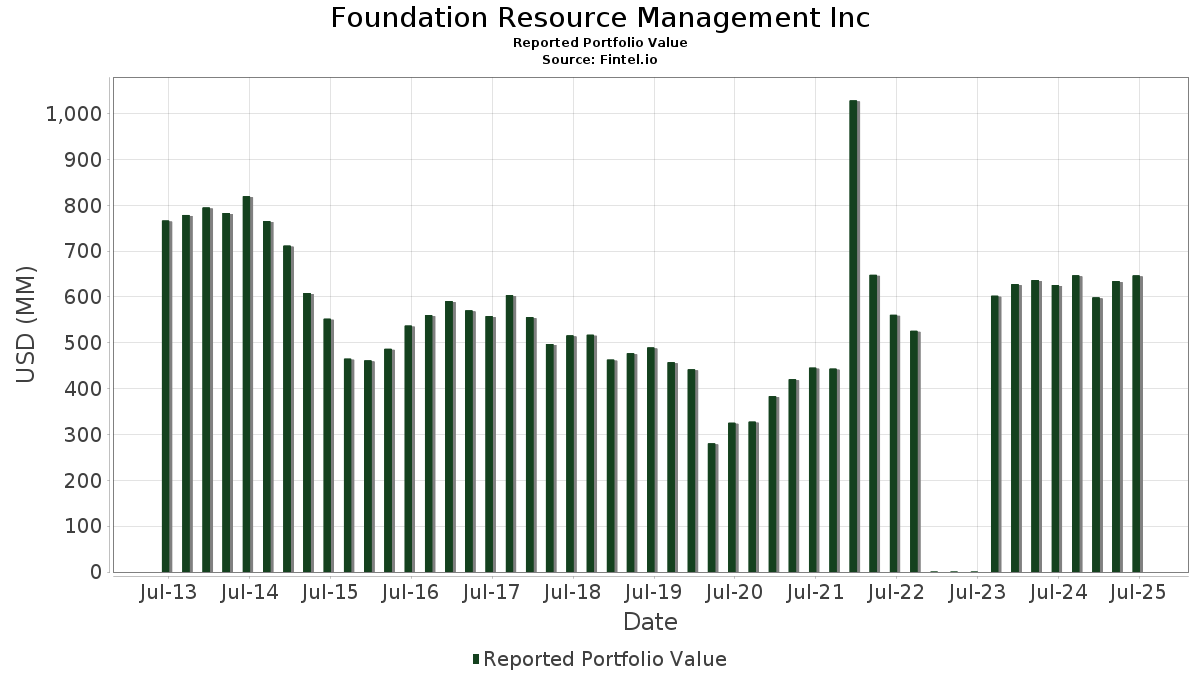
Foundation Resource Management Inc has disclosed 50 total holdings in their latest SEC filings. Most recent portfolio value is calculated to be $ 646,664,949 USD. Actual Assets Under Management (AUM) is this value plus cash (which is not disclosed). Foundation Resource Management Inc’s top holdings are Berkshire Hathaway Inc. (US:BRK.B) , Exxon Mobil Corporation (US:XOM) , Newmont Corporation (US:NEM) , Teck Resources Limited (US:TECK) , and Agnico Eagle Mines Limited (US:AEM) . Foundation Resource Management Inc’s new positions include Barrick Mining Corporation (US:B) , Comcast Corporation (US:CMCSA) , .
Top Increases This Quarter
We use the change in the portfolio allocation because this is the most meaningful metric. Changes can be due to trades or changes in share prices.
| Security | Shares (MM) |
Value (MM$) |
Portfolio % | ΔPortfolio % |
|---|---|---|---|---|
| 0.60 | 12.40 | 1.9180 | 1.9180 | |
| 0.21 | 7.43 | 1.1483 | 1.1483 | |
| 0.28 | 32.25 | 4.9872 | 1.0664 | |
| 0.64 | 23.36 | 3.6123 | 0.9157 | |
| 0.68 | 39.53 | 6.1134 | 0.9151 | |
| 0.95 | 38.34 | 5.9291 | 0.4811 | |
| 0.58 | 13.86 | 2.1440 | 0.3978 | |
| 0.30 | 36.03 | 5.5711 | 0.3249 | |
| 0.64 | 8.01 | 1.2394 | 0.2274 | |
| 0.17 | 9.93 | 1.5351 | 0.1973 |
Top Decreases This Quarter
We use the change in the portfolio allocation because this is the most meaningful metric. Changes can be due to trades or changes in share prices.
| Security | Shares (MM) |
Value (MM$) |
Portfolio % | ΔPortfolio % |
|---|---|---|---|---|
| 0.23 | 33.12 | 5.1217 | -0.9822 | |
| 0.10 | 46.91 | 7.2548 | -0.9534 | |
| 0.42 | 45.09 | 6.9727 | -0.8618 | |
| 0.28 | 25.38 | 3.9250 | -0.7568 | |
| 0.26 | 19.39 | 2.9990 | -0.5838 | |
| 0.15 | 7.08 | 1.0953 | -0.3750 | |
| 0.26 | 12.46 | 1.9265 | -0.3523 | |
| 0.19 | 14.93 | 2.3081 | -0.3264 | |
| 0.62 | 26.67 | 4.1243 | -0.2979 | |
| 0.31 | 8.09 | 1.2511 | -0.2477 |
13F and Fund Filings
This form was filed on 2025-07-14 for the reporting period 2025-06-30. Click the link icon to see the full transaction history.
Upgrade to unlock premium data and export to Excel ![]() .
.
| Security | Type | Avg Share Price | Shares (MM) |
ΔShares (%) |
ΔShares (%) |
Value ($MM) |
Portfolio (%) |
ΔPortfolio (%) |
|
|---|---|---|---|---|---|---|---|---|---|
| BRK.B / Berkshire Hathaway Inc. | 0.10 | -1.22 | 46.91 | -9.90 | 7.2548 | -0.9534 | |||
| XOM / Exxon Mobil Corporation | 0.42 | 0.09 | 45.09 | -9.28 | 6.9727 | -0.8618 | |||
| NEM / Newmont Corporation | 0.68 | -0.66 | 39.53 | 19.88 | 6.1134 | 0.9151 | |||
| TECK / Teck Resources Limited | 0.95 | 0.08 | 38.34 | 10.94 | 5.9291 | 0.4811 | |||
| AEM / Agnico Eagle Mines Limited | 0.30 | -1.33 | 36.03 | 8.25 | 5.5711 | 0.3249 | |||
| CVX / Chevron Corporation | 0.23 | -0.07 | 33.12 | -14.47 | 5.1217 | -0.9822 | |||
| DG / Dollar General Corporation | 0.28 | -0.32 | 32.25 | 29.66 | 4.9872 | 1.0664 | |||
| VZ / Verizon Communications Inc. | 0.62 | -0.34 | 26.67 | -4.93 | 4.1243 | -0.2979 | |||
| COP / ConocoPhillips | 0.28 | 0.01 | 25.38 | -14.54 | 3.9250 | -0.7568 | |||
| MOS / The Mosaic Company | 0.64 | 1.10 | 23.36 | 36.55 | 3.6123 | 0.9157 | |||
| PFE / Pfizer Inc. | 0.89 | 0.07 | 21.64 | -4.27 | 3.3465 | -0.2170 | |||
| CCJ / Cameco Corporation | 0.26 | -52.69 | 19.39 | -14.67 | 2.9990 | -0.5838 | |||
| FHI / Federated Hermes, Inc. | 0.40 | -0.79 | 17.66 | 7.85 | 2.7313 | 0.1498 | |||
| ABEV / Ambev S.A. - Depositary Receipt (Common Stock) | 6.83 | 0.17 | 16.45 | 3.61 | 2.5441 | 0.0411 | |||
| MRK / Merck & Co., Inc. | 0.19 | 1.26 | 14.93 | -10.70 | 2.3081 | -0.3264 | |||
| BEN / Franklin Resources, Inc. | 0.58 | 1.02 | 13.86 | 25.16 | 2.1440 | 0.3978 | |||
| SNY / Sanofi - Depositary Receipt (Common Stock) | 0.26 | -1.07 | 12.46 | -13.83 | 1.9265 | -0.3523 | |||
| B / Barrick Mining Corporation | 0.60 | 12.40 | 1.9180 | 1.9180 | |||||
| GILD / Gilead Sciences, Inc. | 0.11 | -0.74 | 12.10 | -1.79 | 1.8706 | -0.0708 | |||
| INTC / Intel Corporation | 0.53 | -1.02 | 11.76 | -2.37 | 1.8193 | -0.0802 | |||
| L / Loews Corporation | 0.13 | -1.54 | 11.68 | -1.80 | 1.8057 | -0.0688 | |||
| NTR / Nutrien Ltd. | 0.17 | -0.25 | 9.93 | 16.97 | 1.5351 | 0.1973 | |||
| CSCO / Cisco Systems, Inc. | 0.14 | -1.00 | 9.60 | 11.31 | 1.4852 | 0.1251 | |||
| FCX / Freeport-McMoRan Inc. | 0.22 | -1.47 | 9.57 | 12.83 | 1.4799 | 0.1428 | |||
| HPQ / HP Inc. | 0.37 | 1.07 | 9.13 | -10.72 | 1.4124 | -0.2003 | |||
| CNH / CNH Industrial N.V. | 0.63 | 0.96 | 8.21 | 6.54 | 1.2694 | 0.0549 | |||
| TRC / Tejon Ranch Co. | 0.48 | 0.46 | 8.20 | 7.50 | 1.2673 | 0.0656 | |||
| KHC / The Kraft Heinz Company | 0.31 | 0.28 | 8.09 | -14.91 | 1.2511 | -0.2477 | |||
| PBT / Permian Basin Royalty Trust | 0.64 | -0.71 | 8.01 | 24.83 | 1.2394 | 0.2274 | |||
| PSX / Phillips 66 | 0.06 | -0.65 | 7.51 | -4.01 | 1.1610 | -0.0720 | |||
| CMCSA / Comcast Corporation | 0.21 | 7.43 | 1.1483 | 1.1483 | |||||
| PKE / Park Aerospace Corp. | 0.49 | 4.04 | 7.27 | 14.25 | 1.1235 | 0.1211 | |||
| BMY / Bristol-Myers Squibb Company | 0.15 | 0.05 | 7.08 | -24.06 | 1.0953 | -0.3750 | |||
| TEN / Tsakos Energy Navigation Limited | 0.35 | -0.81 | 6.71 | 11.58 | 1.0374 | 0.0896 | |||
| CVE / Cenovus Energy Inc. | 0.47 | 3.56 | 6.36 | 1.26 | 0.9836 | -0.0066 | |||
| APA / APA Corporation | 0.22 | 24.60 | 4.02 | 8.41 | 0.6224 | 0.0372 | |||
| DVN / Devon Energy Corporation | 0.12 | 19.70 | 3.74 | 1.82 | 0.5787 | -0.0007 | |||
| OVV / Ovintiv Inc. | 0.09 | 0.98 | 3.44 | -10.23 | 0.5319 | -0.0721 | |||
| BRK.A / Berkshire Hathaway Inc. | 0.00 | 0.00 | 2.92 | -8.71 | 0.4508 | -0.0526 | |||
| EAF / GrafTech International Ltd. | 1.67 | -1.98 | 1.63 | 9.05 | 0.2515 | 0.0164 | |||
| WMT / Walmart Inc. | 0.02 | -0.12 | 1.62 | 11.21 | 0.2502 | 0.0209 | |||
| AGI / Alamos Gold Inc. | 0.05 | -2.54 | 1.37 | -3.19 | 0.2114 | -0.0112 | |||
| MPC / Marathon Petroleum Corporation | 0.00 | 0.00 | 0.82 | 13.93 | 0.1266 | 0.0134 | |||
| TRV / The Travelers Companies, Inc. | 0.00 | 0.00 | 0.61 | 1.16 | 0.0946 | -0.0007 | |||
| CB / Chubb Limited | 0.00 | 0.00 | 0.59 | -4.09 | 0.0907 | -0.0057 | |||
| IMO / Imperial Oil Limited | 0.01 | 0.00 | 0.55 | 9.76 | 0.0854 | 0.0062 | |||
| RIG / Transocean Ltd. | 0.19 | 1.31 | 0.49 | -17.38 | 0.0751 | -0.0174 | |||
| IBM / International Business Machines Corporation | 0.00 | 0.00 | 0.41 | 18.73 | 0.0638 | 0.0089 | |||
| RTX / RTX Corporation | 0.00 | 0.00 | 0.26 | 10.39 | 0.0395 | 0.0030 | |||
| SJT / San Juan Basin Royalty Trust | 0.01 | 0.00 | 0.09 | 8.75 | 0.0135 | 0.0008 | |||
| GOLD / Barrick Mining Corporation | 0.00 | -100.00 | 0.00 | 0.0000 | |||||
| EMN / Eastman Chemical Company | 0.00 | -100.00 | 0.00 | 0.0000 |