Basic Stats
| Portfolio Value | $ 337,575,231 |
| Current Positions | 274 |
Latest Holdings, Performance, AUM (from 13F, 13D)
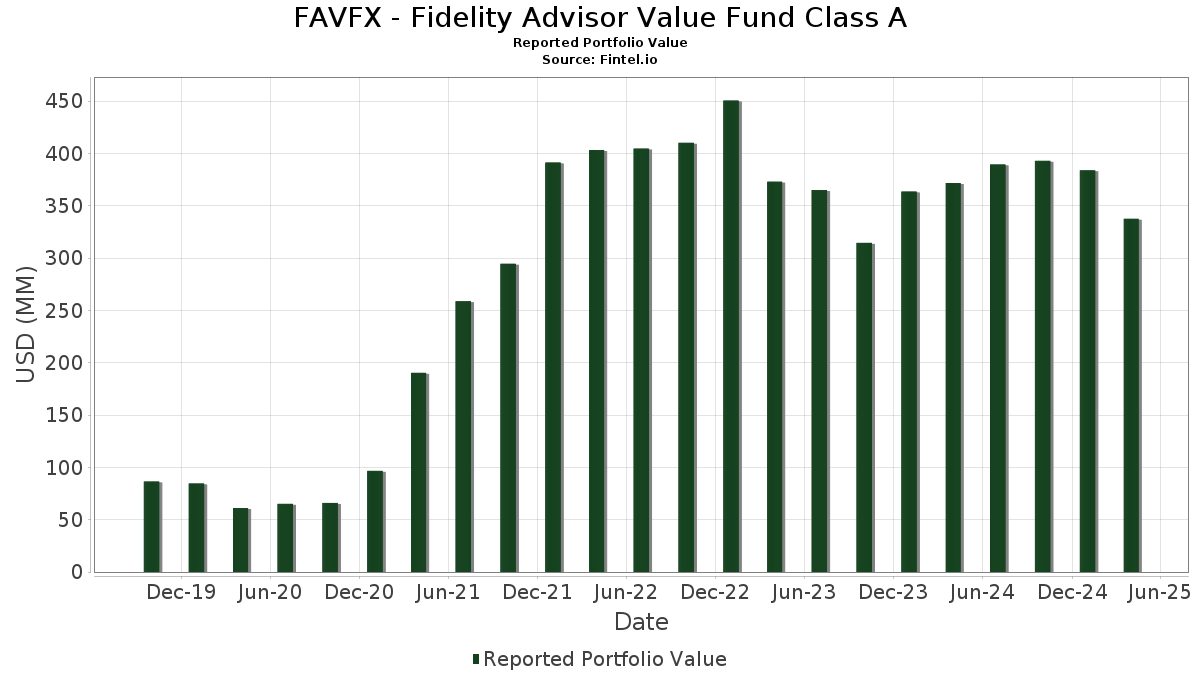
FAVFX - Fidelity Advisor Value Fund Class A has disclosed 274 total holdings in their latest SEC filings. Most recent portfolio value is calculated to be $ 337,575,231 USD. Actual Assets Under Management (AUM) is this value plus cash (which is not disclosed). FAVFX - Fidelity Advisor Value Fund Class A’s top holdings are Fidelity Securities Lending Cash Central Fund (US:US31635A3032) , Fidelity Cash Central Fund (US:US31635A1051) , PG&E Corporation (US:PCG) , Ventas, Inc. (US:VTR) , and Eversource Energy (US:ES) . FAVFX - Fidelity Advisor Value Fund Class A’s new positions include Evergy, Inc. (US:EVRG) , Hasbro, Inc. (US:HAS) , James Hardie Industries plc (US:JHX) , Ingevity Corporation (US:NGVT) , and Avnet, Inc. (US:AVT) .
Top Increases This Quarter
We use the change in the portfolio allocation because this is the most meaningful metric. Changes can be due to trades or changes in share prices.
| Security | Shares (MM) |
Value (MM$) |
Portfolio % | ΔPortfolio % |
|---|---|---|---|---|
| 20.18 | 20.18 | 6.3512 | 3.4093 | |
| 4.49 | 4.49 | 1.4139 | 0.6713 | |
| 0.03 | 2.04 | 0.6413 | 0.6413 | |
| 0.03 | 1.93 | 0.6072 | 0.6072 | |
| 0.01 | 1.38 | 0.4332 | 0.3785 | |
| 0.04 | 2.08 | 0.6544 | 0.3349 | |
| 0.05 | 1.41 | 0.4445 | 0.3337 | |
| 0.02 | 1.56 | 0.4896 | 0.3258 | |
| 0.01 | 1.61 | 0.5073 | 0.3228 | |
| 0.04 | 2.32 | 0.7289 | 0.3099 |
Top Decreases This Quarter
We use the change in the portfolio allocation because this is the most meaningful metric. Changes can be due to trades or changes in share prices.
| Security | Shares (MM) |
Value (MM$) |
Portfolio % | ΔPortfolio % |
|---|---|---|---|---|
| 0.00 | 0.56 | 0.1775 | -0.9801 | |
| 0.04 | 0.78 | 0.2468 | -0.6593 | |
| 0.00 | 0.02 | 0.0068 | -0.6008 | |
| 0.00 | 0.29 | 0.0900 | -0.5392 | |
| 0.00 | 0.05 | 0.0150 | -0.5087 | |
| 0.01 | 0.48 | 0.1521 | -0.4876 | |
| 0.00 | 0.00 | -0.3072 | ||
| 0.02 | 1.75 | 0.5517 | -0.2637 | |
| 0.00 | 0.14 | 0.0439 | -0.2544 | |
| 0.11 | 0.91 | 0.2848 | -0.2279 |
13F and Fund Filings
This form was filed on 2025-06-26 for the reporting period 2025-04-30. Click the link icon to see the full transaction history.
Upgrade to unlock premium data and export to Excel ![]() .
.
| Security | Type | Avg Share Price | Shares (MM) |
ΔShares (%) |
ΔShares (%) |
Value ($MM) |
Portfolio (%) |
ΔPortfolio (%) |
|
|---|---|---|---|---|---|---|---|---|---|
| US31635A3032 / Fidelity Securities Lending Cash Central Fund | 20.18 | 83.77 | 20.18 | 83.77 | 6.3512 | 3.4093 | |||
| US31635A1051 / Fidelity Cash Central Fund | 4.49 | 62.06 | 4.49 | 62.05 | 1.4139 | 0.6713 | |||
| PCG / PG&E Corporation | 0.25 | 0.00 | 4.13 | 5.57 | 1.2995 | 0.2516 | |||
| VTR / Ventas, Inc. | 0.05 | 2.55 | 3.27 | 18.95 | 1.0297 | 0.2928 | |||
| ES / Eversource Energy | 0.05 | 0.00 | 3.07 | 3.13 | 0.9659 | 0.1686 | |||
| SMURFIT WESTROCK PLC / EC (IE00028FXN24) | 0.07 | 19.58 | 2.75 | -5.34 | 0.8649 | 0.0871 | |||
| LNG / Cheniere Energy, Inc. | 0.01 | -4.10 | 2.71 | -0.88 | 0.8517 | 0.1202 | |||
| MOH / Molina Healthcare, Inc. | 0.01 | -5.41 | 2.66 | -0.37 | 0.8371 | 0.1221 | |||
| APO / Apollo Global Management, Inc. | 0.02 | 64.99 | 2.62 | 31.67 | 0.8244 | 0.2916 | |||
| FQVLF / First Quantum Minerals Ltd. | 0.19 | 2.40 | 2.53 | 9.86 | 0.7961 | 0.1793 | |||
| SUI / Sun Communities, Inc. | 0.02 | -6.51 | 2.43 | -8.03 | 0.7642 | 0.0568 | |||
| CH1300646267 / Bunge Global SA | 0.03 | 21.84 | 2.35 | 25.96 | 0.7408 | 0.2403 | |||
| IP / International Paper Company | 0.05 | 4.65 | 2.34 | -14.09 | 0.7351 | 0.0069 | |||
| CNC / Centene Corporation | 0.04 | 58.42 | 2.32 | 48.11 | 0.7289 | 0.3099 | |||
| TRGP / Targa Resources Corp. | 0.01 | -2.73 | 2.31 | -15.55 | 0.7282 | -0.0056 | |||
| UGI / UGI Corporation | 0.07 | -10.19 | 2.29 | -4.15 | 0.7201 | 0.0805 | |||
| ENR / Siemens Energy AG | 0.03 | -21.47 | 2.25 | 1.90 | 0.7092 | 0.1167 | |||
| SRE / Sempra | 0.03 | 8.30 | 2.25 | -2.98 | 0.7073 | 0.0866 | |||
| RS / Reliance, Inc. | 0.01 | 0.00 | 2.24 | -0.44 | 0.7057 | 0.1024 | |||
| PSX / Phillips 66 | 0.02 | 61.70 | 2.24 | 42.74 | 0.7055 | 0.2848 | |||
| OMF / OneMain Holdings, Inc. | 0.05 | -2.69 | 2.21 | -17.54 | 0.6969 | -0.0224 | |||
| RGA / Reinsurance Group of America, Incorporated | 0.01 | -5.59 | 2.21 | -22.41 | 0.6964 | -0.0674 | |||
| DLTR / Dollar Tree, Inc. | 0.03 | -13.17 | 2.20 | -3.21 | 0.6923 | 0.0835 | |||
| FSLR / First Solar, Inc. | 0.02 | 31.72 | 2.19 | -1.04 | 0.6906 | 0.0964 | |||
| CSTM / Constellium SE | 0.22 | 12.46 | 2.18 | 14.53 | 0.6874 | 0.1764 | |||
| LNTH / Lantheus Holdings, Inc. | 0.02 | -10.46 | 2.14 | 0.99 | 0.6745 | 0.1060 | |||
| GXO / GXO Logistics, Inc. | 0.06 | 35.27 | 2.14 | 7.86 | 0.6736 | 0.1420 | |||
| SLM / SLM Corporation | 0.07 | 8.49 | 2.14 | 12.43 | 0.6719 | 0.1630 | |||
| ALSN / Allison Transmission Holdings, Inc. | 0.02 | -5.66 | 2.11 | -25.97 | 0.6632 | -0.0993 | |||
| CVS / CVS Health Corporation | 0.03 | -17.09 | 2.10 | -2.05 | 0.6623 | 0.0867 | |||
| BPOP / Popular, Inc. | 0.02 | 1.53 | 2.09 | -5.91 | 0.6568 | 0.0628 | |||
| SIG / Signet Jewelers Limited | 0.04 | 74.16 | 2.08 | 74.41 | 0.6544 | 0.3349 | |||
| SGI / Somnigroup International Inc. | 0.03 | 2.97 | 2.08 | -0.43 | 0.6537 | 0.0949 | |||
| CEG / Constellation Energy Corporation | 0.01 | 49.16 | 2.06 | 11.11 | 0.6486 | 0.1517 | |||
| BLDR / Builders FirstSource, Inc. | 0.02 | 3.26 | 2.04 | -26.17 | 0.6433 | -0.0982 | |||
| EVRG / Evergy, Inc. | 0.03 | 2.04 | 0.6413 | 0.6413 | |||||
| FCNCA / First Citizens BancShares, Inc. | 0.00 | -1.74 | 2.01 | -20.69 | 0.6310 | -0.0464 | |||
| ARW / Arrow Electronics, Inc. | 0.02 | -3.23 | 2.00 | -7.53 | 0.6301 | 0.0500 | |||
| GTES / Gates Industrial Corporation plc | 0.11 | 10.32 | 2.00 | 0.91 | 0.6296 | 0.0984 | |||
| AES / The AES Corporation | 0.20 | -6.13 | 1.98 | -14.64 | 0.6241 | 0.0016 | |||
| ACHC / Acadia Healthcare Company, Inc. | 0.08 | 26.12 | 1.97 | -34.59 | 0.6209 | -0.1869 | |||
| HAS / Hasbro, Inc. | 0.03 | 1.93 | 0.6072 | 0.6072 | |||||
| IMO / Imperial Oil Limited | 0.03 | 9.15 | 1.92 | 10.69 | 0.6029 | 0.1393 | |||
| LAD / Lithia Motors, Inc. | 0.01 | -5.30 | 1.88 | -26.29 | 0.5931 | -0.0917 | |||
| AHR / American Healthcare REIT, Inc. | 0.06 | -9.91 | 1.88 | 2.79 | 0.5913 | 0.1017 | |||
| ON / ON Semiconductor Corporation | 0.05 | -6.14 | 1.86 | -28.82 | 0.5846 | -0.1143 | |||
| VK / Vallourec S.A. | 0.10 | -6.59 | 1.83 | -9.58 | 0.5768 | 0.0339 | |||
| DAR / Darling Ingredients Inc. | 0.06 | 6.81 | 1.83 | -8.23 | 0.5755 | 0.0418 | |||
| KDP / Keurig Dr Pepper Inc. | 0.05 | -14.56 | 1.83 | -7.91 | 0.5750 | 0.0434 | |||
| AMTM / Amentum Holdings, Inc. | 0.08 | 19.60 | 1.82 | 24.44 | 0.5724 | 0.1809 | |||
| TRV / The Travelers Companies, Inc. | 0.01 | -12.77 | 1.80 | -6.04 | 0.5677 | 0.0535 | |||
| HIG / The Hartford Insurance Group, Inc. | 0.01 | -13.04 | 1.80 | -4.36 | 0.5666 | 0.0623 | |||
| CNR / Core Natural Resources, Inc. | 0.02 | 32.89 | 1.79 | 6.22 | 0.5647 | 0.1122 | |||
| FA / First Advantage Corporation | 0.13 | 55.52 | 1.78 | 16.13 | 0.5597 | 0.1495 | |||
| AHCO / AdaptHealth Corp. | 0.21 | 19.58 | 1.76 | -5.92 | 0.5553 | 0.0527 | |||
| WCC / WESCO International, Inc. | 0.01 | -13.86 | 1.76 | -24.12 | 0.5546 | -0.0676 | |||
| HGV / Hilton Grand Vacations Inc. | 0.05 | 7.65 | 1.76 | -12.13 | 0.5542 | 0.0173 | |||
| GPN / Global Payments Inc. | 0.02 | -14.83 | 1.75 | -42.43 | 0.5517 | -0.2637 | |||
| UPBD / Upbound Group, Inc. | 0.09 | 32.92 | 1.75 | -9.85 | 0.5503 | 0.0307 | |||
| OI / O-I Glass, Inc. | 0.14 | -4.17 | 1.75 | 1.57 | 0.5494 | 0.0892 | |||
| GO / Grocery Outlet Holding Corp. | 0.10 | 68.60 | 1.74 | 74.80 | 0.5482 | 0.2813 | |||
| CTRI / Centuri Holdings, Inc. | 0.10 | 9.84 | 1.72 | -11.45 | 0.5428 | 0.0210 | |||
| CXT / Crane NXT, Co. | 0.04 | 34.14 | 1.72 | -1.60 | 0.5407 | 0.0729 | |||
| LPLA / LPL Financial Holdings Inc. | 0.01 | -5.80 | 1.71 | -17.93 | 0.5390 | -0.0198 | |||
| BBWI / Bath & Body Works, Inc. | 0.06 | 89.74 | 1.68 | 56.23 | 0.5291 | 0.2281 | |||
| AIZ / Assurant, Inc. | 0.01 | -5.95 | 1.67 | -15.79 | 0.5271 | -0.0055 | |||
| GEO / The GEO Group, Inc. | 0.05 | -5.15 | 1.67 | -5.81 | 0.5260 | 0.0505 | |||
| DRVN / Driven Brands Holdings Inc. | 0.10 | -16.00 | 1.67 | -15.95 | 0.5258 | -0.0067 | |||
| CTVA / Corteva, Inc. | 0.03 | -3.29 | 1.64 | -8.13 | 0.5159 | 0.0378 | |||
| BCO / The Brink's Company | 0.02 | 1.27 | 1.64 | -3.19 | 0.5158 | 0.0624 | |||
| UFPI / UFP Industries, Inc. | 0.02 | 34.18 | 1.63 | 14.68 | 0.5142 | 0.1326 | |||
| CNH / CNH Industrial N.V. | 0.14 | -11.49 | 1.63 | -20.48 | 0.5134 | -0.0362 | |||
| US7587501039 / Regal-Beloit Corp. | 0.02 | 15.10 | 1.63 | -23.27 | 0.5129 | -0.0560 | |||
| SCT / SSE plc | 0.07 | 1.21 | 1.63 | 13.29 | 0.5125 | 0.1274 | |||
| BGC / BGC Group, Inc. | 0.18 | -12.93 | 1.62 | -17.33 | 0.5106 | -0.0150 | |||
| VSTS / Vestis Corporation | 0.18 | 86.31 | 1.62 | 16.75 | 0.5090 | 0.1379 | |||
| BLD / TopBuild Corp. | 0.01 | 171.14 | 1.61 | 134.16 | 0.5073 | 0.3228 | |||
| QDEL / QuidelOrtho Corporation | 0.06 | 53.54 | 1.60 | -1.84 | 0.5034 | 0.0670 | |||
| WLK / Westlake Corporation | 0.02 | 9.94 | 1.60 | -11.09 | 0.5021 | 0.0215 | |||
| EGP / EastGroup Properties, Inc. | 0.01 | -17.11 | 1.58 | -20.13 | 0.4982 | -0.0328 | |||
| CNXC / Concentrix Corporation | 0.03 | -9.23 | 1.56 | -11.34 | 0.4898 | 0.0195 | |||
| GIL / Gildan Activewear Inc. | 0.03 | -17.09 | 1.56 | -25.95 | 0.4897 | -0.0729 | |||
| STT / State Street Corporation | 0.02 | 193.36 | 1.56 | 154.50 | 0.4896 | 0.3258 | |||
| WEX / WEX Inc. | 0.01 | -13.27 | 1.55 | -38.54 | 0.4880 | -0.1876 | |||
| CLNX / Cellnex Telecom, S.A. | 0.04 | -4.97 | 1.55 | 14.84 | 0.4873 | 0.1261 | |||
| HRI / Herc Holdings Inc. | 0.01 | 67.51 | 1.55 | -10.07 | 0.4863 | 0.0258 | |||
| MHK / Mohawk Industries, Inc. | 0.01 | -4.60 | 1.54 | -17.05 | 0.4855 | -0.0127 | |||
| NATL / NCR Atleos Corporation | 0.06 | -6.14 | 1.54 | -17.76 | 0.4838 | -0.0168 | |||
| R / Ryder System, Inc. | 0.01 | -11.86 | 1.53 | -23.87 | 0.4828 | -0.0571 | |||
| NXST / Nexstar Media Group, Inc. | 0.01 | 10.10 | 1.53 | 7.58 | 0.4826 | 0.1006 | |||
| OSK / Oshkosh Corporation | 0.02 | 4.39 | 1.53 | -24.89 | 0.4825 | -0.0642 | |||
| UHALB / U-Haul Holding Company - Series N | 0.03 | -0.36 | 1.52 | -15.67 | 0.4794 | -0.0044 | |||
| SECYF / SECURE Waste Infrastructure Corp. | 0.16 | -10.53 | 1.52 | -17.56 | 0.4788 | -0.0155 | |||
| EWBC / East West Bancorp, Inc. | 0.02 | -12.88 | 1.50 | -27.62 | 0.4735 | -0.0833 | |||
| OUT / OUTFRONT Media Inc. | 0.10 | 6.44 | 1.50 | -12.46 | 0.4731 | 0.0130 | |||
| RJF / Raymond James Financial, Inc. | 0.01 | -8.36 | 1.50 | -25.46 | 0.4728 | -0.0671 | |||
| GMS / GMS Inc. | 0.02 | 13.66 | 1.49 | -1.26 | 0.4701 | 0.0648 | |||
| G / Genpact Limited | 0.03 | -4.53 | 1.48 | -1.46 | 0.4663 | 0.0635 | |||
| TEX / Terex Corporation | 0.04 | 11.11 | 1.48 | -18.65 | 0.4655 | -0.0217 | |||
| KBR / KBR, Inc. | 0.03 | -20.56 | 1.48 | -3.34 | 0.4647 | 0.0625 | |||
| KEY / KeyCorp | 0.10 | -6.08 | 1.47 | -22.50 | 0.4620 | -0.0453 | |||
| INGR / Ingredion Incorporated | 0.01 | 26.82 | 1.46 | 23.47 | 0.4586 | 0.1424 | |||
| EIX / Edison International | 0.03 | 0.00 | 1.45 | -0.95 | 0.4575 | 0.0645 | |||
| ALLY / Ally Financial Inc. | 0.04 | 30.77 | 1.45 | 9.66 | 0.4574 | 0.1021 | |||
| PAG / Penske Automotive Group, Inc. | 0.01 | -15.18 | 1.45 | -20.26 | 0.4571 | -0.0310 | |||
| CNQ / Canadian Natural Resources Limited | 0.05 | -4.17 | 1.45 | -9.48 | 0.4569 | 0.0273 | |||
| SSNC / SS&C Technologies Holdings, Inc. | 0.02 | -4.96 | 1.45 | -11.22 | 0.4559 | 0.0187 | |||
| COMP / Compass, Inc. | 0.19 | -34.12 | 1.45 | -29.84 | 0.4551 | -0.0971 | |||
| WSC / WillScot Holdings Corporation | 0.06 | 119.77 | 1.42 | 49.11 | 0.4472 | 0.1917 | |||
| PRI / Primerica, Inc. | 0.01 | 0.00 | 1.42 | -9.67 | 0.4470 | 0.0257 | |||
| MOS / The Mosaic Company | 0.05 | 213.28 | 1.41 | 241.89 | 0.4445 | 0.3337 | |||
| WELL / Welltower Inc. | 0.01 | -29.75 | 1.41 | -21.47 | 0.4444 | -0.0372 | |||
| TEVA / Teva Pharmaceutical Industries Limited - Depositary Receipt (Common Stock) | 0.09 | 56.26 | 1.40 | 36.68 | 0.4410 | 0.1664 | |||
| MEOH / Methanex Corporation | 0.04 | 14.50 | 1.40 | -31.37 | 0.4394 | -0.1055 | |||
| STZ / Constellation Brands, Inc. | 0.01 | 549.56 | 1.38 | 574.51 | 0.4332 | 0.3785 | |||
| VTRS / Viatris Inc. | 0.16 | -4.89 | 1.38 | -29.00 | 0.4331 | -0.0862 | |||
| PFSI / PennyMac Financial Services, Inc. | 0.01 | -22.46 | 1.38 | -27.86 | 0.4330 | -0.0777 | |||
| ICLR / ICON Public Limited Company | 0.01 | 127.07 | 1.37 | 72.80 | 0.4318 | 0.2190 | |||
| ET / Energy Transfer LP - Limited Partnership | 0.08 | -3.94 | 1.37 | -22.45 | 0.4318 | -0.0420 | |||
| CVE / Cenovus Energy Inc. | 0.12 | -7.62 | 1.37 | -24.81 | 0.4312 | -0.0569 | |||
| HNI / HNI Corporation | 0.03 | 7.12 | 1.37 | -9.10 | 0.4308 | 0.0274 | |||
| SYENS / Syensqo SA/NV | 0.02 | -10.32 | 1.35 | -19.89 | 0.4249 | -0.0263 | |||
| MBC / MasterBrand, Inc. | 0.11 | 245.55 | 1.34 | 142.42 | 0.4227 | 0.2743 | |||
| JAZZ / Jazz Pharmaceuticals plc | 0.01 | 12.03 | 1.33 | 5.37 | 0.4201 | 0.0807 | |||
| GLPEY / Galp Energia, SGPS, S.A. - Depositary Receipt (Common Stock) | 0.08 | -4.60 | 1.29 | -11.74 | 0.4047 | 0.0147 | |||
| TGLS / Tecnoglass Inc. | 0.02 | -5.27 | 1.28 | -11.17 | 0.4034 | 0.0169 | |||
| FDX / FedEx Corporation | 0.01 | -3.21 | 1.27 | -23.15 | 0.3991 | -0.0429 | |||
| CPRI / Capri Holdings Limited | 0.08 | 70.96 | 1.26 | 3.69 | 0.3981 | 0.0715 | |||
| BTSG / BrightSpring Health Services, Inc. | 0.07 | -2.06 | 1.25 | -27.24 | 0.3934 | -0.0669 | |||
| IFSPF / Interfor Corporation | 0.13 | -5.40 | 1.25 | -22.08 | 0.3931 | -0.0364 | |||
| ACI / Albertsons Companies, Inc. | 0.06 | -41.32 | 1.25 | -35.67 | 0.3923 | -0.1268 | |||
| WBS / Webster Financial Corporation | 0.03 | 189.87 | 1.21 | 127.79 | 0.3793 | 0.2374 | |||
| MGRC / McGrath RentCorp | 0.01 | 2.12 | 1.18 | -11.18 | 0.3726 | 0.0154 | |||
| PVH / PVH Corp. | 0.02 | -24.31 | 1.18 | -41.77 | 0.3710 | -0.1710 | |||
| PUK / Prudential plc - Depositary Receipt (Common Stock) | 0.11 | 11.71 | 1.17 | 42.72 | 0.3670 | 0.1481 | |||
| GAP / The Gap, Inc. | 0.05 | 18.26 | 1.17 | 7.57 | 0.3669 | 0.0767 | |||
| STC / Stewart Information Services Corporation | 0.02 | 30.91 | 1.16 | 31.53 | 0.3666 | 0.1293 | |||
| KGS / Kodiak Gas Services, Inc. | 0.03 | -21.85 | 1.15 | -43.21 | 0.3634 | -0.1810 | |||
| VOYA / Voya Financial, Inc. | 0.02 | 29.57 | 1.15 | 8.01 | 0.3609 | 0.0766 | |||
| NCR / NCR Corp. | 0.13 | 3.16 | 1.13 | -28.08 | 0.3564 | -0.0653 | |||
| JBL / Jabil Inc. | 0.01 | 5.75 | 1.13 | -4.56 | 0.3562 | 0.0385 | |||
| PM / Philip Morris International Inc. | 0.01 | -39.99 | 1.13 | -21.04 | 0.3545 | -0.0275 | |||
| BC / Brunswick Corporation | 0.02 | 72.47 | 1.12 | -0.36 | 0.3532 | 0.0567 | |||
| UBSG / UBS Group AG | 0.04 | -10.05 | 1.11 | -23.57 | 0.3500 | -0.0400 | |||
| PLD / Prologis, Inc. | 0.01 | 8.97 | 1.10 | -6.60 | 0.3476 | 0.0308 | |||
| NFI / NFI Group Inc. | 0.13 | 0.00 | 1.10 | 1.76 | 0.3453 | 0.0564 | |||
| CC / The Chemours Company | 0.08 | -4.73 | 1.05 | -37.88 | 0.3298 | -0.1222 | |||
| TEN / Tenaris S.A. | 0.06 | -5.99 | 1.05 | -17.12 | 0.3295 | -0.0086 | |||
| AMP / Ameriprise Financial, Inc. | 0.00 | -4.32 | 1.04 | -17.02 | 0.3283 | -0.0086 | |||
| SOLV / Solventum Corporation | 0.02 | 16.20 | 1.04 | 3.70 | 0.3270 | 0.0587 | |||
| WDC / Western Digital Corporation | 0.02 | 21.72 | 1.03 | -18.03 | 0.3249 | -0.0125 | |||
| XPO / XPO, Inc. | 0.01 | -3.00 | 1.03 | -23.02 | 0.3244 | -0.0342 | |||
| TKR / The Timken Company | 0.02 | -34.83 | 1.02 | -47.82 | 0.3204 | -0.2025 | |||
| SMSOF / Samsonite Group S.A. | 0.56 | -5.51 | 1.01 | -41.46 | 0.3183 | -0.1444 | |||
| DOOO / BRP Inc. | 0.03 | 8.43 | 1.01 | -23.19 | 0.3180 | -0.0344 | |||
| TFII / TFI International Inc. | 0.01 | 32.61 | 0.99 | -18.26 | 0.3131 | -0.0127 | |||
| LEN / Lennar Corporation | 0.01 | 55.78 | 0.99 | 28.92 | 0.3131 | 0.1064 | |||
| MLKN / MillerKnoll, Inc. | 0.06 | 6.01 | 0.97 | -22.54 | 0.3051 | -0.0301 | |||
| PATK / Patrick Industries, Inc. | 0.01 | 697.08 | 0.97 | 535.53 | 0.3041 | 0.2632 | |||
| PCAR / PACCAR Inc | 0.01 | -3.67 | 0.95 | -21.62 | 0.2978 | -0.0257 | |||
| HII / Huntington Ingalls Industries, Inc. | 0.00 | 161.15 | 0.94 | 205.50 | 0.2972 | 0.2143 | |||
| ASGN / ASGN Incorporated | 0.02 | 34.00 | 0.92 | -23.49 | 0.2881 | -0.0323 | |||
| GTM / ZoomInfo Technologies Inc. | 0.11 | -43.15 | 0.91 | -52.69 | 0.2848 | -0.2279 | |||
| PRMB / Primo Brands Corporation | 0.03 | -27.05 | 0.90 | -26.37 | 0.2831 | -0.0442 | |||
| PRG / PROG Holdings, Inc. | 0.03 | 33.07 | 0.89 | -17.92 | 0.2811 | -0.0105 | |||
| XPRO / Expro Group Holdings N.V. | 0.11 | -4.94 | 0.89 | -37.81 | 0.2804 | -0.1030 | |||
| AYI / Acuity Inc. | 0.00 | 0.00 | 0.89 | -26.72 | 0.2789 | -0.0450 | |||
| MLM / Martin Marietta Materials, Inc. | 0.00 | 0.00 | 0.88 | -3.71 | 0.2782 | 0.0323 | |||
| LAMR / Lamar Advertising Company | 0.01 | 25.15 | 0.88 | 12.63 | 0.2781 | 0.0680 | |||
| JHX / James Hardie Industries plc | 0.04 | 0.88 | 0.2780 | 0.2780 | |||||
| THRY / Thryv Holdings, Inc. | 0.06 | -6.00 | 0.88 | -26.42 | 0.2770 | -0.0436 | |||
| ELAN / Elanco Animal Health Incorporated | 0.09 | 1,168.95 | 0.88 | 906.90 | 0.2758 | 0.2524 | |||
| JLL / Jones Lang LaSalle Incorporated | 0.00 | 0.86 | 0.2698 | 0.2698 | |||||
| SOBO / South Bow Corporation | 0.03 | -3.89 | 0.85 | -0.81 | 0.2686 | 0.0381 | |||
| GLPG / Galapagos NV | 0.03 | 0.00 | 0.85 | 17.66 | 0.2665 | 0.0737 | |||
| IRM / Iron Mountain Incorporated | 0.01 | 2.61 | 0.84 | -10.25 | 0.2647 | 0.0201 | |||
| NGVT / Ingevity Corporation | 0.03 | 0.84 | 0.2645 | 0.2645 | |||||
| ECN / ECN Capital Corp. | 0.41 | 0.00 | 0.83 | -6.61 | 0.2625 | 0.0232 | |||
| ATS / ATS Corporation | 0.03 | -3.51 | 0.83 | -10.16 | 0.2617 | 0.0139 | |||
| STLD / Steel Dynamics, Inc. | 0.01 | -3.07 | 0.82 | -1.92 | 0.2577 | 0.0340 | |||
| DK / Delek US Holdings, Inc. | 0.06 | 12.03 | 0.79 | -18.33 | 0.2496 | -0.0105 | |||
| COLD / Americold Realty Trust, Inc. | 0.04 | -32.16 | 0.78 | -66.24 | 0.2468 | -0.6593 | |||
| LDOS / Leidos Holdings, Inc. | 0.01 | -19.66 | 0.78 | 6.98 | 0.2464 | 0.0404 | |||
| MRNA / Moderna, Inc. | 0.03 | 30.62 | 0.76 | -5.47 | 0.2395 | 0.0239 | |||
| BNTX / BioNTech SE - Depositary Receipt (Common Stock) | 0.01 | 14.80 | 0.76 | -3.31 | 0.2389 | 0.0284 | |||
| AVT / Avnet, Inc. | 0.02 | 0.76 | 0.2388 | 0.2388 | |||||
| OLN / Olin Corporation | 0.03 | 0.00 | 0.75 | -26.13 | 0.2357 | -0.0361 | |||
| FANG / Diamondback Energy, Inc. | 0.01 | -1.76 | 0.74 | -21.15 | 0.2324 | -0.0183 | |||
| RRC / Range Resources Corporation | 0.02 | -1.37 | 0.73 | -9.63 | 0.2306 | 0.0133 | |||
| FTRE / Fortrea Holdings Inc. | 0.12 | 31.03 | 0.73 | -51.46 | 0.2297 | -0.1729 | |||
| PACS / PACS Group, Inc. | 0.08 | 108.02 | 0.72 | 37.90 | 0.2280 | 0.0872 | |||
| GSK / GSK plc - Depositary Receipt (Common Stock) | 0.02 | 0.72 | 0.2275 | 0.2275 | |||||
| TV / Grupo Televisa, S.A.B. - Depositary Receipt (Common Stock) | 0.39 | -4.26 | 0.70 | -9.29 | 0.2215 | 0.0138 | |||
| FLR / Fluor Corporation | 0.02 | -3.89 | 0.69 | -30.44 | 0.2172 | -0.0486 | |||
| ONEXF / Onex Corporation | 0.01 | 0.00 | 0.69 | -7.76 | 0.2170 | 0.0169 | |||
| MTX / Minerals Technologies Inc. | 0.01 | -2.21 | 0.69 | -34.20 | 0.2156 | -0.0634 | |||
| NOMD / Nomad Foods Limited | 0.03 | 0.00 | 0.64 | 11.91 | 0.2014 | 0.0482 | |||
| ASO / Academy Sports and Outdoors, Inc. | 0.02 | -2.93 | 0.63 | -30.01 | 0.1967 | -0.0427 | |||
| TGC / TGS ASA | 0.08 | 8.41 | 0.60 | -20.66 | 0.1887 | -0.0137 | |||
| NWL / Newell Brands Inc. | 0.12 | 25.17 | 0.59 | -39.98 | 0.1850 | -0.0771 | |||
| SATS / EchoStar Corporation | 0.03 | 0.58 | 0.1840 | 0.1840 | |||||
| VST / Vistra Corp. | 0.00 | -87.64 | 0.56 | -87.20 | 0.1775 | -0.9801 | |||
| A / Agilent Technologies, Inc. | 0.01 | -10.48 | 0.55 | -36.45 | 0.1735 | -0.0588 | |||
| GPK / Graphic Packaging Holding Company | 0.02 | -57.73 | 0.53 | -64.48 | 0.1673 | -0.2229 | |||
| XGGB / Gerdau S.A. - Preferred Stock | 0.20 | 0.00 | 0.53 | -10.36 | 0.1664 | 0.0084 | |||
| PHLLF / Petershill Partners plc | 0.17 | -13.05 | 0.50 | -26.83 | 0.1573 | -0.0257 | |||
| AR / Antero Resources Corporation | 0.01 | -78.32 | 0.48 | -79.77 | 0.1521 | -0.4876 | |||
| IQV / IQVIA Holdings Inc. | 0.00 | -11.80 | 0.46 | -32.11 | 0.1459 | -0.0369 | |||
| AMBC / Ambac Financial Group, Inc. | 0.06 | -4.76 | 0.46 | -34.60 | 0.1458 | -0.0441 | |||
| LPX / Louisiana-Pacific Corporation | 0.01 | 0.00 | 0.46 | -26.32 | 0.1457 | -0.0224 | |||
| SQ / Block, Inc. | 0.01 | 0.46 | 0.1454 | 0.1454 | |||||
| GCC / GCC, S.A.B. de C.V. | 0.05 | 0.00 | 0.45 | -9.82 | 0.1417 | 0.0080 | |||
| MMS / Maximus, Inc. | 0.01 | 66.17 | 0.44 | 47.67 | 0.1397 | 0.0592 | |||
| REXR / Rexford Industrial Realty, Inc. | 0.01 | 0.41 | 0.1302 | 0.1302 | |||||
| GEHC / GE HealthCare Technologies Inc. | 0.01 | -16.97 | 0.41 | -33.92 | 0.1296 | -0.0372 | |||
| JCDXF / JCDecaux SE | 0.02 | 0.41 | 0.1295 | 0.1295 | |||||
| HUM / Humana Inc. | 0.00 | -8.91 | 0.40 | -18.55 | 0.1273 | -0.0057 | |||
| ASTL / Algoma Steel Group Inc. | 0.08 | 0.00 | 0.40 | -37.40 | 0.1262 | -0.0452 | |||
| SNX / TD SYNNEX Corporation | 0.00 | 0.40 | 0.1255 | 0.1255 | |||||
| EHC / Encompass Health Corporation | 0.00 | -7.55 | 0.40 | 9.04 | 0.1253 | 0.0274 | |||
| MEGEF / MEG Energy Corp. | 0.03 | -17.70 | 0.39 | -29.55 | 0.1232 | -0.0257 | |||
| COR / Cencora, Inc. | 0.00 | -44.73 | 0.37 | -36.38 | 0.1163 | -0.0393 | |||
| SNDK.V / Sandisk Corporation | 0.01 | 0.37 | 0.1161 | 0.1161 | |||||
| FWRD / Forward Air Corporation | 0.02 | 0.37 | 0.1157 | 0.1157 | |||||
| RPM / RPM International Inc. | 0.00 | 0.36 | 0.1142 | 0.1142 | |||||
| COO / The Cooper Companies, Inc. | 0.00 | -8.66 | 0.36 | -22.66 | 0.1117 | -0.0114 | |||
| STE / STERIS plc | 0.00 | -15.59 | 0.35 | -13.87 | 0.1115 | 0.0011 | |||
| LILAB / Liberty Latin America Ltd. | 0.06 | 0.00 | 0.35 | -10.31 | 0.1097 | 0.0056 | |||
| YETI / YETI Holdings, Inc. | 0.01 | 0.34 | 0.1059 | 0.1059 | |||||
| LBRT / Liberty Energy Inc. | 0.03 | -1.35 | 0.34 | -38.08 | 0.1056 | -0.0395 | |||
| FCNCB / First Citizens BancShares, Inc. | 0.00 | 0.00 | 0.33 | -12.00 | 0.1041 | 0.0034 | |||
| WAL / Western Alliance Bancorporation | 0.00 | 0.32 | 0.1007 | 0.1007 | |||||
| ZBH / Zimmer Biomet Holdings, Inc. | 0.00 | -87.07 | 0.29 | -87.86 | 0.0900 | -0.5392 | |||
| APD / Air Products and Chemicals, Inc. | 0.00 | -9.09 | 0.27 | -26.36 | 0.0853 | -0.0135 | |||
| EXAS / Exact Sciences Corporation | 0.00 | -10.81 | 0.23 | -27.65 | 0.0711 | -0.0122 | |||
| MASI / Masimo Corporation | 0.00 | -9.52 | 0.22 | -16.48 | 0.0688 | -0.0013 | |||
| KOS / Kosmos Energy Ltd. | 0.14 | 0.00 | 0.22 | -51.78 | 0.0686 | -0.0520 | |||
| THC / Tenet Healthcare Corporation | 0.00 | -11.78 | 0.21 | -10.46 | 0.0674 | 0.0033 | |||
| AVNT / Avient Corporation | 0.01 | -7.35 | 0.21 | -28.18 | 0.0660 | -0.0121 | |||
| BAX / Baxter International Inc. | 0.01 | -15.13 | 0.20 | -18.67 | 0.0618 | -0.0029 | |||
| AVTR / Avantor, Inc. | 0.01 | -11.38 | 0.19 | -48.39 | 0.0605 | -0.0392 | |||
| CHE / Chemed Corporation | 0.00 | -56.38 | 0.19 | -55.02 | 0.0595 | -0.0527 | |||
| ALGN / Align Technology, Inc. | 0.00 | -15.55 | 0.19 | -33.10 | 0.0592 | -0.0163 | |||
| HOLX / Hologic, Inc. | 0.00 | -9.60 | 0.16 | -27.11 | 0.0518 | -0.0086 | |||
| RPRX / Royalty Pharma plc | 0.00 | -21.25 | 0.16 | -18.09 | 0.0515 | -0.0021 | |||
| LH / Labcorp Holdings Inc. | 0.00 | 14.65 | 0.16 | 10.96 | 0.0510 | 0.0118 | |||
| WST / West Pharmaceutical Services, Inc. | 0.00 | -12.21 | 0.15 | -45.88 | 0.0478 | -0.0271 | |||
| PKI / Revvity Inc. | 0.00 | -9.49 | 0.15 | -33.03 | 0.0468 | -0.0126 | |||
| WFRD / Weatherford International plc | 0.00 | -2.81 | 0.14 | -35.87 | 0.0450 | -0.0149 | |||
| TFX / Teleflex Incorporated | 0.00 | -83.52 | 0.14 | -87.51 | 0.0439 | -0.2544 | |||
| DGX / Quest Diagnostics Incorporated | 0.00 | -79.72 | 0.11 | -74.03 | 0.0362 | -0.0844 | |||
| UTHR / United Therapeutics Corporation | 0.00 | -38.24 | 0.11 | -20.28 | 0.0361 | -0.0033 | |||
| EAF / GrafTech International Ltd. | 0.18 | 0.00 | 0.11 | -58.05 | 0.0355 | -0.0361 | |||
| MTD / Mettler-Toledo International Inc. | 0.00 | -12.28 | 0.11 | -30.97 | 0.0337 | -0.0080 | |||
| RMD / ResMed Inc. | 0.00 | 0.10 | 0.0328 | 0.0328 | |||||
| GMED / Globus Medical, Inc. | 0.00 | 29.13 | 0.09 | 0.00 | 0.0282 | 0.0042 | |||
| UST BILLS 0% 06/12/2025 / DBT (US912797LN52) | 0.09 | 0.0282 | 0.0282 | ||||||
| ALNY / Alnylam Pharmaceuticals, Inc. | 0.00 | -1.90 | 0.08 | -4.71 | 0.0257 | 0.0027 | |||
| UST BILLS 0% 07/31/2025 / DBT (US912797PG65) | 0.08 | 0.0249 | 0.0249 | ||||||
| ROIV / Roivant Sciences Ltd. | 0.01 | -10.21 | 0.07 | -6.58 | 0.0225 | 0.0021 | |||
| UST BILLS 0% 06/20/2025 / DBT (US912797NV50) | 0.07 | 0.0219 | 0.0219 | ||||||
| ILMN / Illumina, Inc. | 0.00 | -10.29 | 0.07 | -48.06 | 0.0213 | -0.0133 | |||
| LEGN / Legend Biotech Corporation - Depositary Receipt (Common Stock) | 0.00 | -10.79 | 0.06 | -18.57 | 0.0182 | -0.0007 | |||
| HSIC / Henry Schein, Inc. | 0.00 | -96.99 | 0.05 | -97.59 | 0.0150 | -0.5087 | |||
| BMRN / BioMarin Pharmaceutical Inc. | 0.00 | -12.21 | 0.05 | -11.76 | 0.0144 | 0.0005 | |||
| BIO / Bio-Rad Laboratories, Inc. | 0.00 | 0.00 | 0.04 | -32.20 | 0.0127 | -0.0033 | |||
| WAY / Waystar Holding Corp. | 0.00 | 0.04 | 0.0123 | 0.0123 | |||||
| CRL / Charles River Laboratories International, Inc. | 0.00 | 0.00 | 0.03 | -28.57 | 0.0096 | -0.0017 | |||
| PRGO / Perrigo Company plc | 0.00 | -99.07 | 0.02 | -99.07 | 0.0068 | -0.6008 | |||
| SGRY / Surgery Partners, Inc. | 0.00 | 0.02 | 0.0068 | 0.0068 | |||||
| NVST / Envista Holdings Corporation | 0.00 | -7.81 | 0.02 | -30.77 | 0.0060 | -0.0011 | |||
| BRKR / Bruker Corporation | 0.00 | -19.01 | 0.02 | -43.33 | 0.0054 | -0.0028 | |||
| P1UK34 / Prudential plc - Depositary Receipt (Common Stock) | 0.10 | 0.02 | 0.0052 | 0.0052 | |||||
| S and P MID 400 EMINI FUT JUN25 FAM5 / DE (N/A) | 0.01 | 0.0032 | 0.0032 | ||||||
| BCC / Boise Cascade Company | 0.00 | -100.00 | 0.00 | -100.00 | -0.3072 | ||||
| PCRX / Pacira BioSciences, Inc. | 0.00 | -100.00 | 0.00 | -100.00 | -0.0171 | ||||
| PFGC / Performance Food Group Company | 0.00 | -100.00 | 0.00 | -100.00 | -0.1442 | ||||
| WOR / Worthington Enterprises, Inc. | 0.00 | -100.00 | 0.00 | -100.00 | -0.1427 | ||||
| RKT / Rocket Companies, Inc. | 0.00 | -100.00 | 0.00 | -100.00 | -0.0672 |