Basic Stats
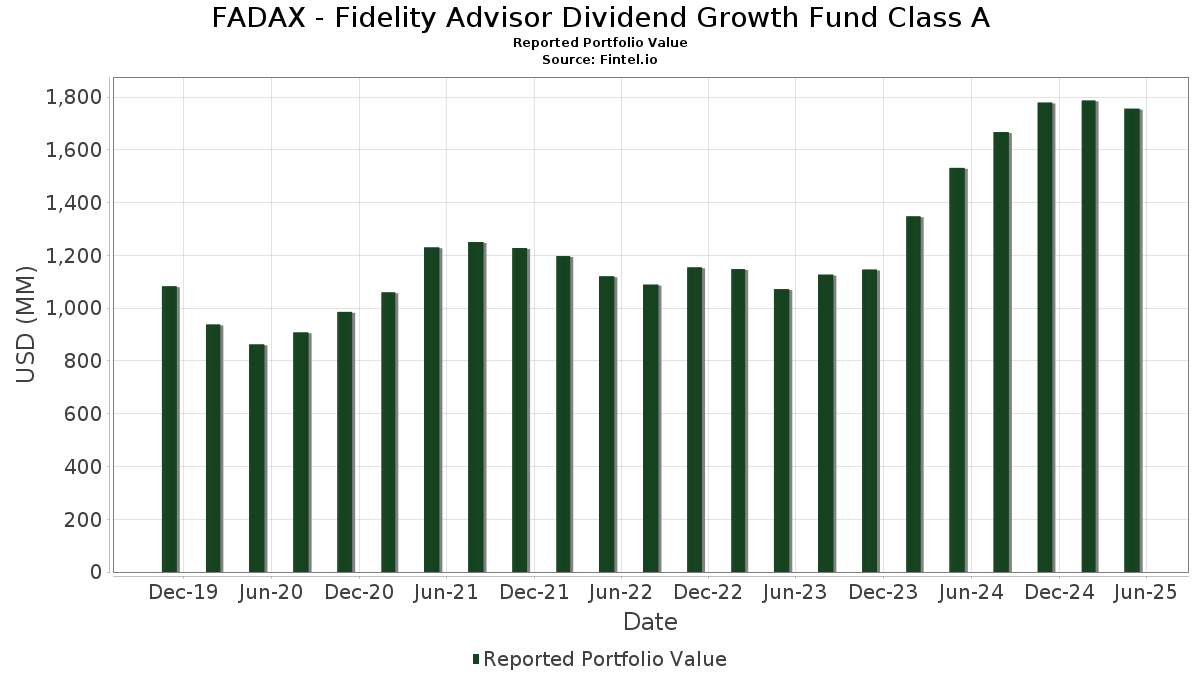
| Portfolio Value | $ 1,756,110,562 |
| Current Positions | 122 |
Latest Holdings, Performance, AUM (from 13F, 13D)
FADAX - Fidelity Advisor Dividend Growth Fund Class A has disclosed 122 total holdings in their latest SEC filings. Most recent portfolio value is calculated to be $ 1,756,110,562 USD. Actual Assets Under Management (AUM) is this value plus cash (which is not disclosed). FADAX - Fidelity Advisor Dividend Growth Fund Class A’s top holdings are NVIDIA Corporation (US:NVDA) , Microsoft Corporation (US:MSFT) , Meta Platforms, Inc. (US:META) , Alphabet Inc. (US:GOOGL) , and The Boeing Company (US:BA) . FADAX - Fidelity Advisor Dividend Growth Fund Class A’s new positions include Cboe Global Markets, Inc. (US:CBOE) , FirstCash Holdings, Inc. (US:FCFS) , LPL Financial Holdings Inc. (US:LPLA) , Imperial Oil Limited (CA:IMO) , and Regal Rexnord Corporation (US:RRX) .
Top Increases This Quarter
We use the change in the portfolio allocation because this is the most meaningful metric. Changes can be due to trades or changes in share prices.
| Security | Shares (MM) |
Value (MM$) |
Portfolio % | ΔPortfolio % |
|---|---|---|---|---|
| 23.02 | 23.03 | 1.3278 | 1.1987 | |
| 0.35 | 28.30 | 1.6319 | 0.9906 | |
| 0.39 | 27.27 | 1.5723 | 0.9747 | |
| 0.80 | 107.59 | 6.2042 | 0.9147 | |
| 0.06 | 13.66 | 0.7874 | 0.7874 | |
| 0.11 | 50.68 | 2.9223 | 0.7403 | |
| 0.40 | 25.82 | 1.4890 | 0.6995 | |
| 0.31 | 63.51 | 3.6623 | 0.6978 | |
| 0.17 | 18.88 | 1.0885 | 0.6883 | |
| 0.10 | 11.41 | 0.6578 | 0.5832 |
Top Decreases This Quarter
We use the change in the portfolio allocation because this is the most meaningful metric. Changes can be due to trades or changes in share prices.
| Security | Shares (MM) |
Value (MM$) |
Portfolio % | ΔPortfolio % |
|---|---|---|---|---|
| 0.43 | 74.17 | 4.2772 | -1.4529 | |
| 0.04 | 2.38 | 0.1373 | -1.3135 | |
| 9.29 | 9.29 | 0.5357 | -1.2661 | |
| 0.48 | 35.62 | 2.0543 | -0.6396 | |
| 0.78 | 34.44 | 1.9862 | -0.5929 | |
| 0.20 | 20.15 | 1.1617 | -0.5542 | |
| 0.09 | 34.23 | 1.9737 | -0.5455 | |
| 0.12 | 80.81 | 4.6597 | -0.4818 | |
| 0.03 | 6.29 | 0.3628 | -0.4739 | |
| 0.42 | 14.52 | 0.8374 | -0.4664 |
13F and Fund Filings
This form was filed on 2025-07-24 for the reporting period 2025-05-31. Click the link icon to see the full transaction history.
Upgrade to unlock premium data and export to Excel ![]() .
.
| Security | Type | Avg Share Price | Shares (MM) |
ΔShares (%) |
ΔShares (%) |
Value ($MM) |
Portfolio (%) |
ΔPortfolio (%) |
|
|---|---|---|---|---|---|---|---|---|---|
| NVDA / NVIDIA Corporation | 0.80 | 5.30 | 107.59 | 13.91 | 6.2042 | 0.9147 | |||
| MSFT / Microsoft Corporation | 0.22 | -19.66 | 99.90 | -6.83 | 5.7606 | -0.2442 | |||
| META / Meta Platforms, Inc. | 0.12 | -9.17 | 80.81 | -11.99 | 4.6597 | -0.4818 | |||
| GOOGL / Alphabet Inc. | 0.43 | -28.12 | 74.17 | -27.51 | 4.2772 | -1.4529 | |||
| BA / The Boeing Company | 0.31 | 1.06 | 63.51 | 19.97 | 3.6623 | 0.6978 | |||
| GEV / GE Vernova Inc. | 0.11 | -7.83 | 50.68 | 30.06 | 2.9223 | 0.7403 | |||
| BN / Brookfield Corporation | 0.72 | 11.41 | 41.72 | 10.98 | 2.4058 | 0.3006 | |||
| AVGO / Broadcom Inc. | 0.17 | -28.30 | 40.84 | -12.97 | 2.3549 | -0.2730 | |||
| WFC / Wells Fargo & Company | 0.48 | -22.44 | 35.62 | -25.94 | 2.0543 | -0.6396 | |||
| BAC / Bank of America Corporation | 0.78 | -21.87 | 34.44 | -25.21 | 1.9862 | -0.5929 | |||
| V / Visa Inc. | 0.09 | -24.43 | 34.23 | -23.92 | 1.9737 | -0.5455 | |||
| OBDC / Blue Owl Capital Corporation | 2.19 | 45.55 | 32.09 | 37.93 | 1.8505 | 0.5476 | |||
| ALSN / Allison Transmission Holdings, Inc. | 0.30 | -17.86 | 30.95 | -16.43 | 1.7848 | -0.2893 | |||
| EME / EMCOR Group, Inc. | 0.06 | -11.16 | 30.06 | 2.52 | 1.7333 | 0.0914 | |||
| PAYC / Paycom Software, Inc. | 0.11 | 14.49 | 29.28 | 35.16 | 1.6883 | 0.4752 | |||
| ET / Energy Transfer LP - Limited Partnership | 1.64 | -1.87 | 28.60 | -11.07 | 1.6492 | -0.1519 | |||
| TSM / Taiwan Semiconductor Manufacturing Company Limited - Depositary Receipt (Common Stock) | 0.15 | -12.88 | 28.50 | -6.71 | 1.6432 | -0.0674 | |||
| WAB / Westinghouse Air Brake Technologies Corporation | 0.14 | -2.96 | 28.49 | 5.92 | 1.6427 | 0.1365 | |||
| SSNC / SS&C Technologies Holdings, Inc. | 0.35 | 172.32 | 28.30 | 147.13 | 1.6319 | 0.9906 | |||
| NEE / NextEra Energy, Inc. | 0.39 | 153.78 | 27.27 | 155.50 | 1.5723 | 0.9747 | |||
| SGI / Somnigroup International Inc. | 0.40 | 79.84 | 25.82 | 83.16 | 1.4890 | 0.6995 | |||
| PM / Philip Morris International Inc. | 0.14 | 2.90 | 25.61 | 19.68 | 1.4767 | 0.2784 | |||
| APO / Apollo Global Management, Inc. | 0.19 | -5.33 | 25.08 | -17.11 | 1.4462 | -0.2482 | |||
| EPD / Enterprise Products Partners L.P. - Limited Partnership | 0.79 | 8.56 | 24.43 | 0.15 | 1.4088 | 0.0426 | |||
| RPRX / Royalty Pharma plc | 0.71 | -9.38 | 23.36 | -11.43 | 1.3469 | -0.1298 | |||
| US31635A3032 / Fidelity Securities Lending Cash Central Fund | 23.02 | 898.95 | 23.03 | 898.96 | 1.3278 | 1.1987 | |||
| BATS / British American Tobacco p.l.c. | 0.51 | 38.37 | 22.79 | 60.48 | 1.3145 | 0.5190 | |||
| XOM / Exxon Mobil Corporation | 0.20 | -28.45 | 20.15 | -34.25 | 1.1617 | -0.5542 | |||
| SHEL / Shell plc - Depositary Receipt (Common Stock) | 0.30 | 9.23 | 20.06 | 7.23 | 1.1566 | 0.1090 | |||
| MA / Mastercard Incorporated | 0.03 | -25.81 | 20.03 | -24.62 | 1.1549 | -0.3330 | |||
| VRT / Vertiv Holdings Co | 0.17 | 132.89 | 18.88 | 164.11 | 1.0885 | 0.6883 | |||
| FE / FirstEnergy Corp. | 0.43 | 42.03 | 17.94 | 53.64 | 1.0346 | 0.3807 | |||
| AAPL / Apple Inc. | 0.08 | 11.07 | 16.73 | -7.76 | 0.9647 | -0.0510 | |||
| VTR / Ventas, Inc. | 0.26 | 121.73 | 16.66 | 106.02 | 0.9608 | 0.5079 | |||
| CI / The Cigna Group | 0.05 | -34.52 | 15.67 | -32.88 | 0.9038 | -0.4038 | |||
| MTN / Vail Resorts, Inc. | 0.10 | -7.83 | 15.65 | -7.14 | 0.9024 | -0.0414 | |||
| MPLX / MPLX LP - Limited Partnership | 0.29 | -22.99 | 14.78 | -27.15 | 0.8523 | -0.2838 | |||
| CMCSA / Comcast Corporation | 0.42 | -35.26 | 14.52 | -37.62 | 0.8374 | -0.4664 | |||
| CBOE / Cboe Global Markets, Inc. | 0.06 | 13.66 | 0.7874 | 0.7874 | |||||
| CRM / Salesforce, Inc. | 0.05 | -13.40 | 13.37 | -22.85 | 0.7712 | -0.1995 | |||
| INTU / Intuit Inc. | 0.02 | -17.70 | 12.96 | 1.01 | 0.7473 | 0.0289 | |||
| CB / Chubb Limited | 0.04 | 11.26 | 12.63 | 15.83 | 0.7284 | 0.1177 | |||
| ARCC / Ares Capital Corporation | 0.55 | -14.03 | 12.05 | -18.93 | 0.6947 | -0.1374 | |||
| KDP / Keurig Dr Pepper Inc. | 0.35 | 66.97 | 11.69 | 64.14 | 0.6743 | 0.2044 | |||
| UNH / UnitedHealth Group Incorporated | 0.04 | 255.63 | 11.59 | 126.05 | 0.6685 | 0.3813 | |||
| TNK / Teekay Tankers Ltd. | 0.26 | 3.69 | 11.42 | 21.41 | 0.6586 | 0.1318 | |||
| SJM / The J. M. Smucker Company | 0.10 | 740.25 | 11.41 | 756.38 | 0.6578 | 0.5832 | |||
| SCI / Service Corporation International | 0.14 | 89.64 | 10.99 | 82.62 | 0.6337 | 0.2967 | |||
| TMUS / T-Mobile US, Inc. | 0.04 | 15.06 | 10.73 | 3.33 | 0.6187 | 0.0372 | |||
| PWR / Quanta Services, Inc. | 0.03 | 72.83 | 10.24 | 128.06 | 0.5906 | 0.3391 | |||
| FIX / Comfort Systems USA, Inc. | 0.02 | -25.64 | 9.71 | -2.12 | 0.5598 | 0.0043 | |||
| MRP / Millrose Properties, Inc. | 0.35 | 25.70 | 9.69 | 53.25 | 0.5588 | 0.2047 | |||
| OWL / Blue Owl Capital Inc. | 0.52 | -4.94 | 9.67 | -17.53 | 0.5574 | -0.0989 | |||
| STZ / Constellation Brands, Inc. | 0.05 | 381.82 | 9.45 | 389.59 | 0.5449 | 0.4368 | |||
| US31635A1051 / Fidelity Cash Central Fund | 9.29 | -71.13 | 9.29 | -71.13 | 0.5357 | -1.2661 | |||
| AJG / Arthur J. Gallagher & Co. | 0.03 | -9.86 | 8.89 | -7.27 | 0.5129 | -0.0243 | |||
| QSR / Restaurant Brands International Inc. | 0.12 | 8.33 | 0.4806 | 0.4806 | |||||
| WPM / Wheaton Precious Metals Corp. | 0.10 | -1.85 | 8.29 | 23.19 | 0.4782 | 0.1012 | |||
| HUM / Humana Inc. | 0.03 | 45.15 | 8.02 | 14.17 | 0.4625 | 0.0667 | |||
| TRV / The Travelers Companies, Inc. | 0.03 | 32.11 | 7.94 | 36.92 | 0.4579 | 0.1311 | |||
| MRK / Merck & Co., Inc. | 0.10 | -7.34 | 7.76 | -22.82 | 0.4475 | -0.1156 | |||
| TMO / Thermo Fisher Scientific Inc. | 0.02 | 444.12 | 7.45 | 314.46 | 0.4297 | 0.3290 | |||
| REYN / Reynolds Consumer Products Inc. | 0.33 | 249.42 | 7.26 | 161.51 | 0.4185 | 0.2104 | |||
| PCAR / PACCAR Inc | 0.08 | 7.06 | 0.4070 | 0.4070 | |||||
| RGLD / Royal Gold, Inc. | 0.04 | 96.02 | 7.02 | 137.54 | 0.4047 | 0.2392 | |||
| BCO / The Brink's Company | 0.08 | -12.94 | 6.74 | -24.02 | 0.3885 | -0.1081 | |||
| MMC / Marsh & McLennan Companies, Inc. | 0.03 | 87.50 | 6.66 | 84.20 | 0.3840 | 0.1816 | |||
| FCFS / FirstCash Holdings, Inc. | 0.05 | 6.60 | 0.3806 | 0.3806 | |||||
| NYT / The New York Times Company | 0.12 | 6.18 | 6.57 | 26.13 | 0.3791 | 0.0872 | |||
| KKR / KKR & Co. Inc. | 0.05 | 8.88 | 6.40 | -2.47 | 0.3691 | 0.0016 | |||
| GE / General Electric Company | 0.03 | -64.55 | 6.29 | -57.89 | 0.3628 | -0.4739 | |||
| NVO / Novo Nordisk A/S - Depositary Receipt (Common Stock) | 0.09 | -16.31 | 6.09 | -33.99 | 0.3513 | -0.1655 | |||
| JOE / The St. Joe Company | 0.13 | -6.39 | 6.03 | -12.76 | 0.3475 | -0.0393 | |||
| FQVLF / First Quantum Minerals Ltd. | 0.41 | -49.83 | 6.01 | -40.09 | 0.3464 | -0.2152 | |||
| PKIUF / Parkland Corporation | 0.21 | -34.79 | 6.00 | -25.24 | 0.3459 | -0.1034 | |||
| BRKR / Bruker Corporation | 0.15 | 14.29 | 5.40 | -11.17 | 0.3115 | -0.0291 | |||
| AROC / Archrock, Inc. | 0.22 | 11.75 | 5.40 | 2.60 | 0.3114 | 0.0166 | |||
| SN6 / Stolt-Nielsen Limited | 0.21 | 0.00 | 5.32 | 6.60 | 0.3066 | 0.0273 | |||
| BVHMF / Vistry Group PLC | 0.62 | -18.70 | 5.25 | -10.61 | 0.3028 | -0.0261 | |||
| HWM / Howmet Aerospace Inc. | 0.03 | 0.00 | 5.15 | 24.38 | 0.2968 | 0.0651 | |||
| MO / Altria Group, Inc. | 0.08 | 5.12 | 0.2953 | 0.2953 | |||||
| ACI / Albertsons Companies, Inc. | 0.23 | -3.85 | 5.06 | 1.59 | 0.2916 | 0.0129 | |||
| BESI / BE Semiconductor Industries N.V. | 0.04 | 12.36 | 4.84 | 23.16 | 0.2791 | 0.0590 | |||
| RJF / Raymond James Financial, Inc. | 0.03 | 4.67 | 0.2695 | 0.2695 | |||||
| AMRK / A-Mark Precious Metals, Inc. | 0.22 | -6.46 | 4.34 | -32.10 | 0.2505 | -0.1078 | |||
| CNR / Core Natural Resources, Inc. | 0.06 | -46.15 | 4.33 | -49.74 | 0.2500 | -0.2330 | |||
| KGS / Kodiak Gas Services, Inc. | 0.12 | 22.13 | 4.17 | 0.29 | 0.2405 | 0.0076 | |||
| DHR / Danaher Corporation | 0.02 | -46.84 | 4.16 | -51.42 | 0.2398 | -0.2395 | |||
| LPLA / LPL Financial Holdings Inc. | 0.01 | 3.99 | 0.2300 | 0.2300 | |||||
| HII / Huntington Ingalls Industries, Inc. | 0.02 | -48.69 | 3.93 | -59.53 | 0.2264 | -0.3684 | |||
| DHT / DHT Holdings, Inc. | 0.33 | -0.48 | 3.82 | 11.45 | 0.2202 | 0.0283 | |||
| HO / Thales S.A. | 0.01 | -57.88 | 3.77 | -35.92 | 0.2172 | -0.1120 | |||
| HLT / Hilton Worldwide Holdings Inc. | 0.01 | -27.37 | 3.43 | -31.90 | 0.1977 | -0.0842 | |||
| IMO / Imperial Oil Limited | 0.05 | 3.29 | 0.1898 | 0.1898 | |||||
| ELV / Elevance Health, Inc. | 0.01 | -5.56 | 3.26 | -8.65 | 0.1881 | -0.0119 | |||
| EXC / Exelon Corporation | 0.07 | -4.63 | 3.25 | -5.44 | 0.1875 | -0.0051 | |||
| AIT / Applied Industrial Technologies, Inc. | 0.01 | 77.22 | 3.17 | 95.74 | 0.1829 | 0.0835 | |||
| NEM / Newmont Corporation | 0.06 | -18.50 | 3.09 | 2.45 | 0.1781 | 0.0083 | |||
| EIX / Edison International | 0.05 | -16.72 | 2.88 | -14.88 | 0.1662 | -0.0234 | |||
| BA. / BAE Systems plc | 0.10 | -61.31 | 2.63 | -44.54 | 0.1517 | -0.1139 | |||
| 0FF / 2020 Bulkers Ltd. | 0.22 | 0.00 | 2.56 | -2.63 | 0.1475 | 0.0004 | |||
| UWMC / UWM Holdings Corporation | 0.59 | 205.97 | 2.54 | 109.56 | 0.1466 | 0.0787 | |||
| TXT / Textron Inc. | 0.03 | 0.00 | 2.47 | -0.92 | 0.1426 | 0.0028 | |||
| MRVL / Marvell Technology, Inc. | 0.04 | -85.98 | 2.38 | -90.81 | 0.1373 | -1.3135 | |||
| LLY / Eli Lilly and Company | 0.00 | -66.67 | 2.21 | -73.29 | 0.1276 | -0.3364 | |||
| AEM / Agnico Eagle Mines Limited | 0.02 | -68.10 | 2.02 | -21.60 | 0.1162 | -0.0766 | |||
| RRX / Regal Rexnord Corporation | 0.01 | 1.95 | 0.1123 | 0.1123 | |||||
| PRGO / Perrigo Company plc | 0.06 | 1.65 | 0.0954 | 0.0954 | |||||
| MAR / Marriott International, Inc. | 0.01 | -72.85 | 1.58 | -58.27 | 0.0913 | -0.2510 | |||
| AMKR / Amkor Technology, Inc. | 0.08 | -59.64 | 1.41 | -65.55 | 0.0814 | -0.1479 | |||
| G / Genpact Limited | 0.03 | -33.55 | 1.34 | -46.27 | 0.0772 | -0.0623 | |||
| WDC / Western Digital Corporation | 0.03 | -42.21 | 1.32 | -39.13 | 0.0761 | -0.0453 | |||
| HSHP / Himalaya Shipping Ltd. | 0.21 | 169.88 | 1.24 | 171.27 | 0.0714 | 0.0450 | |||
| HQ3 / Cool Company Ltd. | 0.20 | -17.73 | 1.23 | -21.83 | 0.0711 | -0.0172 | |||
| REXR / Rexford Industrial Realty, Inc. | 0.03 | 0.00 | 1.21 | -14.75 | 0.0697 | -0.0097 | |||
| GD / General Dynamics Corporation | 0.00 | -39.39 | 1.11 | -33.23 | 0.0642 | -0.0291 | |||
| MCHP / Microchip Technology Incorporated | 0.02 | 37.31 | 1.07 | 5.85 | 0.0616 | -0.0336 | |||
| INE066F01020 / Hindustan Aeronautics Ltd. | 0.02 | 0.90 | 0.0516 | 0.0516 | |||||
| ASML / ASML Holding N.V. | 0.00 | -70.27 | 0.81 | -69.21 | 0.0467 | -0.1006 | |||
| BORR / Borr Drilling Limited | 0.42 | -65.71 | 0.73 | -76.39 | 0.0424 | -0.1318 | |||
| HSHP / Himalaya Shipping Ltd. | 0.08 | -62.95 | 0.46 | -59.57 | 0.0263 | -0.0368 | |||
| SBUX / Starbucks Corporation | 0.00 | 0.00 | 0.01 | -27.27 | 0.0005 | -0.0002 | |||
| CAT / Caterpillar Inc. | 0.00 | -100.00 | 0.00 | -100.00 | -0.3255 | ||||
| 000660 / SK hynix Inc. | 0.00 | -100.00 | 0.00 | -100.00 | -0.4019 | ||||
| ETN / Eaton Corporation plc | 0.00 | -100.00 | 0.00 | -100.00 | -0.1166 | ||||
| JD / JD.com, Inc. - Depositary Receipt (Common Stock) | 0.00 | -100.00 | 0.00 | -100.00 | -0.3787 |