Basic Stats
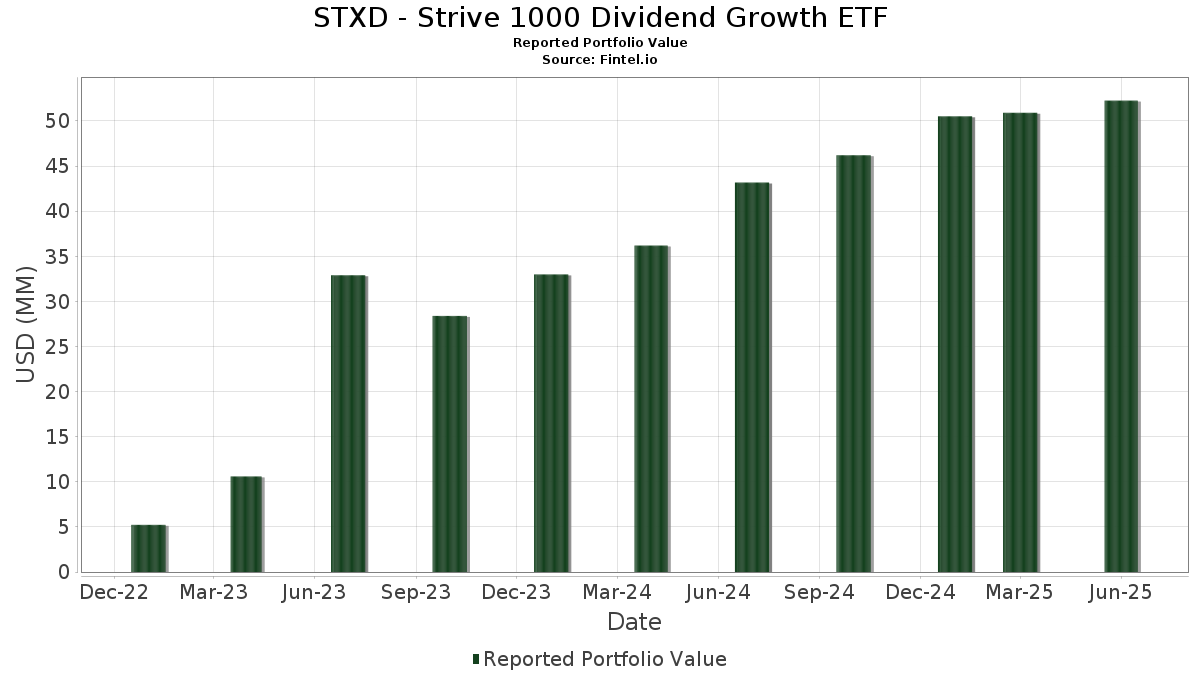
| Portfolio Value | $ 52,263,280 |
| Current Positions | 202 |
Latest Holdings, Performance, AUM (from 13F, 13D)
STXD - Strive 1000 Dividend Growth ETF has disclosed 202 total holdings in their latest SEC filings. Most recent portfolio value is calculated to be $ 52,263,280 USD. Actual Assets Under Management (AUM) is this value plus cash (which is not disclosed). STXD - Strive 1000 Dividend Growth ETF’s top holdings are Broadcom Inc. (US:AVGO) , Microsoft Corporation (US:MSFT) , JPMorgan Chase & Co. (US:JPM) , Eli Lilly and Company (US:LLY) , and Visa Inc. (US:V) . STXD - Strive 1000 Dividend Growth ETF’s new positions include JPMorgan Chase & Co. (US:JPM) , Bank of America Corporation (US:BAC) , RTX Corporation (US:RTX) , Accenture plc (US:ACN) , and QUALCOMM Incorporated (US:QCOM) .
Top Increases This Quarter
We use the change in the portfolio allocation because this is the most meaningful metric. Changes can be due to trades or changes in share prices.
| Security | Shares (MM) |
Value (MM$) |
Portfolio % | ΔPortfolio % |
|---|---|---|---|---|
| 0.01 | 2.51 | 4.8200 | 4.8200 | |
| 0.01 | 3.57 | 6.8600 | 3.1700 | |
| 0.02 | 1.01 | 1.9300 | 1.9300 | |
| 0.01 | 3.14 | 6.0300 | 1.6100 | |
| 0.00 | 0.60 | 1.1500 | 1.1500 | |
| 0.00 | 0.58 | 1.1100 | 1.1100 | |
| 0.00 | 0.54 | 1.0400 | 1.0400 | |
| 0.00 | 0.53 | 1.0200 | 1.0200 | |
| 0.01 | 1.11 | 2.1300 | 0.6500 | |
| 0.00 | 0.28 | 0.5300 | 0.5300 |
Top Decreases This Quarter
We use the change in the portfolio allocation because this is the most meaningful metric. Changes can be due to trades or changes in share prices.
| Security | Shares (MM) |
Value (MM$) |
Portfolio % | ΔPortfolio % |
|---|---|---|---|---|
| 0.00 | 0.89 | 1.7000 | -1.4700 | |
| 0.00 | 2.06 | 3.9600 | -0.6600 | |
| 0.01 | 1.01 | 1.9400 | -0.4800 | |
| 0.01 | 1.15 | 2.2100 | -0.3900 | |
| 0.00 | 0.47 | 0.9100 | -0.3100 | |
| 0.01 | 0.62 | 1.1800 | -0.2800 | |
| 0.00 | 0.56 | 1.0700 | -0.2700 | |
| 0.00 | 1.41 | 2.7200 | -0.2400 | |
| 0.00 | 1.13 | 2.1600 | -0.2200 | |
| 0.00 | 0.65 | 1.2400 | -0.2200 |
13F and Fund Filings
This form was filed on 2025-08-29 for the reporting period 2025-06-30. Click the link icon to see the full transaction history.
Upgrade to unlock premium data and export to Excel ![]() .
.
| Security | Type | Avg Share Price | Shares (MM) |
ΔShares (%) |
ΔShares (%) |
Value ($MM) |
Portfolio (%) |
ΔPortfolio (%) |
|
|---|---|---|---|---|---|---|---|---|---|
| AVGO / Broadcom Inc. | 0.01 | 15.78 | 3.57 | 90.61 | 6.8600 | 3.1700 | |||
| MSFT / Microsoft Corporation | 0.01 | 5.69 | 3.14 | 40.06 | 6.0300 | 1.6100 | |||
| JPM / JPMorgan Chase & Co. | 0.01 | 2.51 | 4.8200 | 4.8200 | |||||
| LLY / Eli Lilly and Company | 0.00 | -6.90 | 2.06 | -12.14 | 3.9600 | -0.6600 | |||
| V / Visa Inc. | 0.01 | -3.21 | 1.91 | -1.95 | 3.6600 | -0.1700 | |||
| MA / Mastercard Incorporated | 0.00 | -8.27 | 1.41 | -5.98 | 2.7200 | -0.2400 | |||
| COST / Costco Wholesale Corporation | 0.00 | -6.71 | 1.36 | -2.29 | 2.6200 | -0.1300 | |||
| PG / The Procter & Gamble Company | 0.01 | -6.67 | 1.15 | -12.79 | 2.2100 | -0.3900 | |||
| HD / The Home Depot, Inc. | 0.00 | -6.94 | 1.13 | -6.87 | 2.1600 | -0.2200 | |||
| ORCL / Oracle Corporation | 0.01 | -5.50 | 1.11 | 47.94 | 2.1300 | 0.6500 | |||
| ABBV / AbbVie Inc. | 0.01 | -6.99 | 1.01 | -17.59 | 1.9400 | -0.4800 | |||
| BAC / Bank of America Corporation | 0.02 | 1.01 | 1.9300 | 1.9300 | |||||
| UNH / UnitedHealth Group Incorporated | 0.00 | -7.83 | 0.89 | -45.10 | 1.7000 | -1.4700 | |||
| ABT / Abbott Laboratories | 0.01 | -7.32 | 0.72 | -4.91 | 1.3800 | -0.1000 | |||
| LIN / Linde plc | 0.00 | -7.13 | 0.69 | -6.38 | 1.3300 | -0.1200 | |||
| GS / The Goldman Sachs Group, Inc. | 0.00 | -9.38 | 0.68 | 17.36 | 1.3000 | 0.1700 | |||
| INTU / Intuit Inc. | 0.00 | -7.85 | 0.67 | 18.12 | 1.2800 | 0.1700 | |||
| MCD / McDonald's Corporation | 0.00 | -7.01 | 0.65 | -13.04 | 1.2400 | -0.2200 | |||
| MRK / Merck & Co., Inc. | 0.01 | -5.63 | 0.62 | -16.76 | 1.1800 | -0.2800 | |||
| RTX / RTX Corporation | 0.00 | 0.60 | 1.1500 | 1.1500 | |||||
| TXN / Texas Instruments Incorporated | 0.00 | -6.94 | 0.58 | 7.55 | 1.1200 | 0.0500 | |||
| CAT / Caterpillar Inc. | 0.00 | -6.98 | 0.58 | 9.66 | 1.1100 | 0.0700 | |||
| ACN / Accenture plc | 0.00 | 0.58 | 1.1100 | 1.1100 | |||||
| PEP / PepsiCo, Inc. | 0.00 | -7.09 | 0.56 | -18.18 | 1.0700 | -0.2700 | |||
| QCOM / QUALCOMM Incorporated | 0.00 | 0.54 | 1.0400 | 1.0400 | |||||
| MS / Morgan Stanley | 0.00 | 0.53 | 1.0200 | 1.0200 | |||||
| SPGI / S&P Global Inc. | 0.00 | -6.83 | 0.52 | -3.36 | 0.9900 | -0.0600 | |||
| TMO / Thermo Fisher Scientific Inc. | 0.00 | -6.42 | 0.47 | -23.71 | 0.9100 | -0.3100 | |||
| BLK / BlackRock, Inc. | 0.00 | -3.04 | 0.47 | 7.57 | 0.9000 | 0.0400 | |||
| AMGN / Amgen Inc. | 0.00 | -6.86 | 0.46 | -16.61 | 0.8900 | -0.2000 | |||
| AMAT / Applied Materials, Inc. | 0.00 | -8.25 | 0.46 | 15.95 | 0.8800 | 0.1000 | |||
| NEE / NextEra Energy, Inc. | 0.01 | -7.03 | 0.44 | -8.90 | 0.8500 | -0.1000 | |||
| ETN / Eaton Corporation plc | 0.00 | 48.36 | 0.43 | 114.85 | 0.8300 | 0.2200 | |||
| UNP / Union Pacific Corporation | 0.00 | -6.78 | 0.42 | -9.23 | 0.8100 | -0.1100 | |||
| SYK / Stryker Corporation | 0.00 | -6.57 | 0.42 | -0.71 | 0.8100 | -0.0300 | |||
| DHR / Danaher Corporation | 0.00 | -6.74 | 0.40 | -10.09 | 0.7700 | -0.1100 | |||
| LOW / Lowe's Companies, Inc. | 0.00 | -7.38 | 0.39 | -11.85 | 0.7400 | -0.1200 | |||
| ADP / Automatic Data Processing, Inc. | 0.00 | -6.77 | 0.39 | -5.85 | 0.7400 | -0.0700 | |||
| LRCX / Lam Research Corporation | 0.00 | -7.45 | 0.39 | 23.79 | 0.7400 | 0.1300 | |||
| KLAC / KLA Corporation | 0.00 | -5.25 | 0.37 | 24.92 | 0.7100 | 0.1200 | |||
| APH / Amphenol Corporation | 0.00 | -8.65 | 0.37 | 37.22 | 0.7000 | 0.1800 | |||
| ADI / Analog Devices, Inc. | 0.00 | -6.95 | 0.36 | 10.00 | 0.7000 | 0.0500 | |||
| LMT / Lockheed Martin Corporation | 0.00 | -7.36 | 0.34 | -3.98 | 0.6500 | -0.0400 | |||
| MMC / Marsh & McLennan Companies, Inc. | 0.00 | -6.88 | 0.33 | -16.62 | 0.6400 | -0.1400 | |||
| ICE / Intercontinental Exchange, Inc. | 0.00 | -8.65 | 0.32 | -3.00 | 0.6200 | -0.0400 | |||
| AMT / American Tower Corporation | 0.00 | -8.68 | 0.32 | -7.29 | 0.6100 | -0.0700 | |||
| SBUX / Starbucks Corporation | 0.00 | -6.71 | 0.31 | -13.02 | 0.6000 | -0.1100 | |||
| CME / CME Group Inc. | 0.00 | -5.85 | 0.31 | -2.24 | 0.5900 | -0.0300 | |||
| TT / Trane Technologies PLC | 0.00 | -6.71 | 0.30 | 20.72 | 0.5800 | 0.0900 | |||
| PLD / Prologis, Inc. | 0.00 | -6.94 | 0.30 | -12.28 | 0.5800 | -0.0900 | |||
| WM / Waste Management, Inc. | 0.00 | -5.86 | 0.28 | -6.91 | 0.5400 | -0.0600 | |||
| PH / Parker-Hannifin Corporation | 0.00 | -7.66 | 0.28 | 6.13 | 0.5300 | 0.0100 | |||
| MDLZ / Mondelez International, Inc. | 0.00 | -8.91 | 0.28 | -9.48 | 0.5300 | -0.0700 | |||
| KKR / KKR & Co. Inc. | 0.00 | 0.28 | 0.5300 | 0.5300 | |||||
| NKE / NIKE, Inc. | 0.00 | -7.80 | 0.25 | 3.25 | 0.4900 | 0.0000 | |||
| AJG / Arthur J. Gallagher & Co. | 0.00 | 7.46 | 0.25 | 0.00 | 0.4800 | -0.0100 | |||
| SHW / The Sherwin-Williams Company | 0.00 | -6.01 | 0.25 | -7.87 | 0.4700 | -0.0600 | |||
| FGXXX / First American Funds Inc - First American Government Obligations Fund Class X | 0.24 | 91.27 | 0.4600 | 0.2100 | |||||
| EQIX / Equinix, Inc. | 0.00 | -5.94 | 0.24 | -8.08 | 0.4600 | -0.0500 | |||
| MCO / Moody's Corporation | 0.00 | -7.07 | 0.24 | 0.00 | 0.4600 | -0.0100 | |||
| AON / Aon plc | 0.00 | -8.23 | 0.23 | -18.15 | 0.4400 | -0.1100 | |||
| NOC / Northrop Grumman Corporation | 0.00 | -6.02 | 0.23 | -8.13 | 0.4300 | -0.0600 | |||
| GD / General Dynamics Corporation | 0.00 | -7.54 | 0.22 | -0.91 | 0.4200 | -0.0100 | |||
| MSI / Motorola Solutions, Inc. | 0.00 | -6.69 | 0.22 | -10.74 | 0.4200 | -0.0600 | |||
| ITW / Illinois Tool Works Inc. | 0.00 | -8.79 | 0.22 | -9.28 | 0.4100 | -0.0600 | |||
| BK / The Bank of New York Mellon Corporation | 0.00 | 0.20 | 0.3900 | 0.3900 | |||||
| VST / Vistra Corp. | 0.00 | 0.20 | 0.3900 | 0.3900 | |||||
| ZTS / Zoetis Inc. | 0.00 | -6.45 | 0.20 | -11.61 | 0.3800 | -0.0600 | |||
| CSX / CSX Corporation | 0.01 | -7.21 | 0.19 | 3.19 | 0.3700 | 0.0000 | |||
| APD / Air Products and Chemicals, Inc. | 0.00 | -8.29 | 0.19 | -12.27 | 0.3700 | -0.0600 | |||
| ROP / Roper Technologies, Inc. | 0.00 | -10.50 | 0.18 | -14.08 | 0.3500 | -0.0700 | |||
| AFL / Aflac Incorporated | 0.00 | 0.18 | 0.3500 | 0.3500 | |||||
| PWR / Quanta Services, Inc. | 0.00 | -9.63 | 0.17 | 33.87 | 0.3200 | 0.0800 | |||
| ALL / The Allstate Corporation | 0.00 | -4.12 | 0.16 | -6.82 | 0.3200 | -0.0300 | |||
| AMP / Ameriprise Financial, Inc. | 0.00 | -6.77 | 0.16 | 2.55 | 0.3100 | 0.0000 | |||
| TE Connectivity PLC / EC (N/A) | 0.00 | 0.16 | 0.3100 | 0.3100 | |||||
| RSG / Republic Services, Inc. | 0.00 | -10.16 | 0.15 | -8.88 | 0.3000 | -0.0300 | |||
| FAST / Fastenal Company | 0.00 | 91.47 | 0.15 | 3.45 | 0.2900 | 0.0000 | |||
| PAYX / Paychex, Inc. | 0.00 | -4.00 | 0.15 | -9.32 | 0.2800 | -0.0400 | |||
| LHX / L3Harris Technologies, Inc. | 0.00 | -3.47 | 0.15 | 15.87 | 0.2800 | 0.0300 | |||
| CMI / Cummins Inc. | 0.00 | -3.08 | 0.14 | 1.41 | 0.2800 | 0.0000 | |||
| GWW / W.W. Grainger, Inc. | 0.00 | -13.16 | 0.14 | -8.67 | 0.2600 | -0.0400 | |||
| VRSK / Verisk Analytics, Inc. | 0.00 | 0.14 | 0.2600 | 0.2600 | |||||
| NDAQ / Nasdaq, Inc. | 0.00 | -4.11 | 0.13 | 12.93 | 0.2500 | 0.0200 | |||
| MSCI / MSCI Inc. | 0.00 | -9.16 | 0.13 | -7.09 | 0.2500 | -0.0300 | |||
| YUM / Yum! Brands, Inc. | 0.00 | -3.84 | 0.13 | -9.79 | 0.2500 | -0.0300 | |||
| AME / AMETEK, Inc. | 0.00 | 0.13 | 0.2500 | 0.2500 | |||||
| CTSH / Cognizant Technology Solutions Corporation | 0.00 | 0.12 | 0.2300 | 0.2300 | |||||
| RMD / ResMed Inc. | 0.00 | 0.12 | 0.2200 | 0.2200 | |||||
| MCHP / Microchip Technology Incorporated | 0.00 | -4.09 | 0.12 | 40.24 | 0.2200 | 0.0600 | |||
| EBAY / eBay Inc. | 0.00 | 0.11 | 0.2100 | 0.2100 | |||||
| MPWR / Monolithic Power Systems, Inc. | 0.00 | -8.59 | 0.11 | 14.89 | 0.2100 | 0.0200 | |||
| A / Agilent Technologies, Inc. | 0.00 | -4.46 | 0.11 | -3.64 | 0.2000 | -0.0200 | |||
| VMC / Vulcan Materials Company | 0.00 | -8.74 | 0.11 | 1.92 | 0.2000 | 0.0000 | |||
| MLM / Martin Marietta Materials, Inc. | 0.00 | -3.57 | 0.10 | 10.75 | 0.2000 | 0.0200 | |||
| ARES / Ares Management Corporation | 0.00 | 0.10 | 0.2000 | 0.2000 | |||||
| GRMN / Garmin Ltd. | 0.00 | -4.20 | 0.10 | -8.33 | 0.1900 | -0.0200 | |||
| W1LT34 / Willis Towers Watson Public Limited Company - Depositary Receipt (Common Stock) | 0.00 | 0.10 | 0.1900 | 0.1900 | |||||
| XYL / Xylem Inc. | 0.00 | -10.69 | 0.10 | -3.00 | 0.1900 | -0.0100 | |||
| ODFL / Old Dominion Freight Line, Inc. | 0.00 | -11.42 | 0.09 | -13.08 | 0.1800 | -0.0300 | |||
| BR / Broadridge Financial Solutions, Inc. | 0.00 | -9.77 | 0.09 | -9.37 | 0.1700 | -0.0200 | |||
| RJF / Raymond James Financial, Inc. | 0.00 | -11.78 | 0.09 | -2.25 | 0.1700 | -0.0100 | |||
| TSCO / Tractor Supply Company | 0.00 | -13.03 | 0.09 | -17.31 | 0.1700 | -0.0400 | |||
| AWK / American Water Works Company, Inc. | 0.00 | -4.33 | 0.09 | -10.53 | 0.1700 | -0.0200 | |||
| PPG / PPG Industries, Inc. | 0.00 | -3.77 | 0.08 | 0.00 | 0.1600 | 0.0000 | |||
| BRO / Brown & Brown, Inc. | 0.00 | -3.68 | 0.08 | -13.83 | 0.1600 | -0.0300 | |||
| STZ / Constellation Brands, Inc. | 0.00 | 0.08 | 0.1500 | 0.1500 | |||||
| SBAC / SBA Communications Corporation | 0.00 | 0.08 | 0.1500 | 0.1500 | |||||
| CBOE / Cboe Global Markets, Inc. | 0.00 | -4.12 | 0.08 | 0.00 | 0.1500 | 0.0000 | |||
| HSY / The Hershey Company | 0.00 | -11.37 | 0.08 | -13.79 | 0.1400 | -0.0300 | |||
| STE / STERIS plc | 0.00 | -4.32 | 0.07 | 1.37 | 0.1400 | 0.0000 | |||
| ATO / Atmos Energy Corporation | 0.00 | 0.07 | 0.1400 | 0.1400 | |||||
| CDW / CDW Corporation | 0.00 | -3.30 | 0.07 | 8.96 | 0.1400 | 0.0100 | |||
| CINF / Cincinnati Financial Corporation | 0.00 | -4.20 | 0.07 | -2.74 | 0.1400 | -0.0100 | |||
| HUBB / Hubbell Incorporated | 0.00 | -4.07 | 0.07 | 19.64 | 0.1300 | 0.0200 | |||
| WRB / W. R. Berkley Corporation | 0.00 | -3.87 | 0.06 | -1.56 | 0.1200 | -0.0100 | |||
| TPL / Texas Pacific Land Corporation | 0.00 | -7.69 | 0.06 | -26.74 | 0.1200 | -0.0500 | |||
| CASY / Casey's General Stores, Inc. | 0.00 | 0.00 | 0.06 | 18.87 | 0.1200 | 0.0100 | |||
| FCNCA / First Citizens BancShares, Inc. | 0.00 | -11.11 | 0.06 | -6.06 | 0.1200 | -0.0100 | |||
| WSM / Williams-Sonoma, Inc. | 0.00 | -11.89 | 0.06 | -8.96 | 0.1200 | -0.0100 | |||
| HEIA / Heico Corp. - Class A | 0.00 | -13.75 | 0.06 | 7.14 | 0.1200 | 0.0100 | |||
| FIX / Comfort Systems USA, Inc. | 0.00 | 0.00 | 0.06 | 68.57 | 0.1100 | 0.0400 | |||
| MKC / McCormick & Company, Incorporated | 0.00 | -4.31 | 0.06 | -12.12 | 0.1100 | -0.0200 | |||
| FDS / FactSet Research Systems Inc. | 0.00 | 0.00 | 0.06 | -1.79 | 0.1100 | 0.0000 | |||
| SSNC / SS&C Technologies Holdings, Inc. | 0.00 | -4.05 | 0.05 | -5.26 | 0.1100 | 0.0000 | |||
| MAA / Mid-America Apartment Communities, Inc. | 0.00 | -3.75 | 0.05 | -14.52 | 0.1000 | -0.0200 | |||
| CSL / Carlisle Companies Incorporated | 0.00 | -11.80 | 0.05 | -1.85 | 0.1000 | -0.0100 | |||
| LII / Lennox International Inc. | 0.00 | -20.18 | 0.05 | -17.46 | 0.1000 | -0.0300 | |||
| WST / West Pharmaceutical Services, Inc. | 0.00 | -2.88 | 0.05 | -5.56 | 0.1000 | -0.0100 | |||
| DPZ / Domino's Pizza, Inc. | 0.00 | 0.00 | 0.05 | -1.96 | 0.1000 | 0.0000 | |||
| WSO / Watsco, Inc. | 0.00 | 0.00 | 0.05 | -12.28 | 0.1000 | -0.0100 | |||
| SNA / Snap-on Incorporated | 0.00 | -4.17 | 0.05 | -10.71 | 0.1000 | -0.0100 | |||
| J / Jacobs Solutions Inc. | 0.00 | -3.60 | 0.05 | 4.26 | 0.0900 | 0.0000 | |||
| EXPD / Expeditors International of Washington, Inc. | 0.00 | -3.17 | 0.05 | -9.43 | 0.0900 | -0.0100 | |||
| MAS / Masco Corporation | 0.00 | -3.92 | 0.04 | -10.20 | 0.0800 | -0.0200 | |||
| GGG / Graco Inc. | 0.00 | -3.94 | 0.04 | 0.00 | 0.0800 | -0.0100 | |||
| EWBC / East West Bancorp, Inc. | 0.00 | 0.04 | 0.0800 | 0.0800 | |||||
| HEI / HEICO Corporation | 0.00 | -20.25 | 0.04 | -2.33 | 0.0800 | -0.0100 | |||
| AVY / Avery Dennison Corporation | 0.00 | -2.82 | 0.04 | -4.55 | 0.0800 | -0.0100 | |||
| RPM / RPM International Inc. | 0.00 | -3.54 | 0.04 | -8.89 | 0.0800 | -0.0100 | |||
| JKHY / Jack Henry & Associates, Inc. | 0.00 | -3.06 | 0.04 | -4.88 | 0.0800 | 0.0000 | |||
| BAH / Booz Allen Hamilton Holding Corporation | 0.00 | -3.54 | 0.04 | -4.88 | 0.0800 | 0.0000 | |||
| ITT / ITT Inc. | 0.00 | -2.73 | 0.04 | 18.18 | 0.0700 | 0.0000 | |||
| ALLE / Allegion plc | 0.00 | -17.18 | 0.04 | -9.52 | 0.0700 | -0.0100 | |||
| IEX / IDEX Corporation | 0.00 | -19.26 | 0.04 | -20.83 | 0.0700 | -0.0300 | |||
| BWXT / BWX Technologies, Inc. | 0.00 | -21.13 | 0.04 | 15.15 | 0.0700 | 0.0000 | |||
| POOL / Pool Corporation | 0.00 | 0.00 | 0.04 | -10.00 | 0.0700 | -0.0100 | |||
| LECO / Lincoln Electric Holdings, Inc. | 0.00 | -3.87 | 0.04 | 5.88 | 0.0700 | 0.0000 | |||
| RGLD / Royal Gold, Inc. | 0.00 | -3.37 | 0.04 | 2.94 | 0.0700 | 0.0000 | |||
| SCI / Service Corporation International | 0.00 | -3.10 | 0.04 | -2.78 | 0.0700 | 0.0000 | |||
| OC / Owens Corning | 0.00 | -2.71 | 0.03 | -5.56 | 0.0700 | 0.0000 | |||
| JBHT / J.B. Hunt Transport Services, Inc. | 0.00 | -2.89 | 0.03 | -5.71 | 0.0600 | -0.0100 | |||
| DKS / DICK'S Sporting Goods, Inc. | 0.00 | -4.00 | 0.03 | -5.71 | 0.0600 | -0.0100 | |||
| SEIC / SEI Investments Company | 0.00 | -3.66 | 0.03 | 13.79 | 0.0600 | 0.0000 | |||
| EVR / Evercore Inc. | 0.00 | 0.00 | 0.03 | 33.33 | 0.0600 | 0.0100 | |||
| WING / Wingstop Inc. | 0.00 | -20.34 | 0.03 | 19.23 | 0.0600 | 0.0100 | |||
| SF / Stifel Financial Corp. | 0.00 | 0.03 | 0.0600 | 0.0600 | |||||
| ELS / Equity LifeStyle Properties, Inc. | 0.00 | -3.96 | 0.03 | -11.43 | 0.0600 | -0.0100 | |||
| D2OX34 / Amdocs Limited - Depositary Receipt (Common Stock) | 0.00 | 0.03 | 0.0600 | 0.0600 | |||||
| CUBE / CubeSmart | 0.00 | -3.86 | 0.03 | -3.33 | 0.0600 | 0.0000 | |||
| KNSL / Kinsale Capital Group, Inc. | 0.00 | 0.00 | 0.03 | 0.00 | 0.0600 | 0.0000 | |||
| TTEK / Tetra Tech, Inc. | 0.00 | -4.09 | 0.03 | 16.00 | 0.0600 | 0.0100 | |||
| WTRG / Essential Utilities, Inc. | 0.00 | -4.26 | 0.03 | -9.37 | 0.0600 | 0.0000 | |||
| HLI / Houlihan Lokey, Inc. | 0.00 | -4.17 | 0.03 | 3.70 | 0.0600 | 0.0100 | |||
| PRI / Primerica, Inc. | 0.00 | -17.97 | 0.03 | -22.22 | 0.0600 | -0.0100 | |||
| OLED / Universal Display Corporation | 0.00 | -3.83 | 0.03 | 8.00 | 0.0500 | 0.0000 | |||
| NYT / The New York Times Company | 0.00 | -4.17 | 0.03 | 12.50 | 0.0500 | 0.0000 | |||
| WMS / Advanced Drainage Systems, Inc. | 0.00 | -2.90 | 0.03 | 0.00 | 0.0500 | 0.0000 | |||
| ENSG / The Ensign Group, Inc. | 0.00 | 0.03 | 0.0500 | 0.0500 | |||||
| AWI / Armstrong World Industries, Inc. | 0.00 | -4.17 | 0.03 | 13.04 | 0.0500 | 0.0000 | |||
| ALSN / Allison Transmission Holdings, Inc. | 0.00 | 0.03 | 0.0500 | 0.0500 | |||||
| WTFC / Wintrust Financial Corporation | 0.00 | 0.03 | 0.0500 | 0.0500 | |||||
| JEF / Jefferies Financial Group Inc. | 0.00 | 0.02 | 0.0500 | 0.0500 | |||||
| MORN / Morningstar, Inc. | 0.00 | -23.53 | 0.02 | -20.00 | 0.0500 | -0.0100 | |||
| ERIE / Erie Indemnity Company | 0.00 | 0.00 | 0.02 | -17.24 | 0.0500 | -0.0100 | |||
| BFB / Brown-Forman Corp. - Class B | 0.00 | 0.02 | 0.0500 | 0.0500 | |||||
| AOS / A. O. Smith Corporation | 0.00 | -3.66 | 0.02 | 0.00 | 0.0500 | 0.0000 | |||
| MKTX / MarketAxess Holdings Inc. | 0.00 | -18.80 | 0.02 | -14.29 | 0.0500 | -0.0100 | |||
| CFR / Cullen/Frost Bankers, Inc. | 0.00 | -3.66 | 0.02 | 0.00 | 0.0500 | 0.0000 | |||
| REXR / Rexford Industrial Realty, Inc. | 0.00 | -4.12 | 0.02 | -11.54 | 0.0400 | -0.0100 | |||
| EGP / EastGroup Properties, Inc. | 0.00 | 0.00 | 0.02 | -4.17 | 0.0400 | -0.0100 | |||
| CHE / Chemed Corporation | 0.00 | -17.54 | 0.02 | -37.14 | 0.0400 | -0.0300 | |||
| TTC / The Toro Company | 0.00 | -4.18 | 0.02 | -8.33 | 0.0400 | -0.0100 | |||
| G / Genpact Limited | 0.00 | -3.96 | 0.02 | -15.38 | 0.0400 | -0.0100 | |||
| CBSH / Commerce Bancshares, Inc. | 0.00 | -24.21 | 0.02 | -24.14 | 0.0400 | -0.0200 | |||
| LW / Lamb Weston Holdings, Inc. | 0.00 | -3.22 | 0.02 | -8.70 | 0.0400 | -0.0100 | |||
| KNX / Knight-Swift Transportation Holdings Inc. | 0.00 | 0.02 | 0.0400 | 0.0400 | |||||
| ADC / Agree Realty Corporation | 0.00 | -26.17 | 0.02 | -31.03 | 0.0400 | -0.0200 | |||
| CHDN / Churchill Downs Incorporated | 0.00 | -3.38 | 0.02 | -9.09 | 0.0400 | -0.0100 | |||
| KBR / KBR, Inc. | 0.00 | 0.02 | 0.0400 | 0.0400 | |||||
| FR / First Industrial Realty Trust, Inc. | 0.00 | -3.69 | 0.02 | -15.00 | 0.0300 | -0.0100 | |||
| HLNE / Hamilton Lane Incorporated | 0.00 | 0.02 | 0.0300 | 0.0300 | |||||
| WTS / Watts Water Technologies, Inc. | 0.00 | 0.00 | 0.02 | 23.08 | 0.0300 | 0.0000 | |||
| CGNX / Cognex Corporation | 0.00 | -4.09 | 0.02 | 0.00 | 0.0300 | 0.0000 | |||
| LSTR / Landstar System, Inc. | 0.00 | 0.00 | 0.01 | -13.33 | 0.0300 | 0.0000 | |||
| LFUS / Littelfuse, Inc. | 0.00 | 0.00 | 0.01 | 8.33 | 0.0300 | 0.0100 | |||
| FFIN / First Financial Bankshares, Inc. | 0.00 | -3.59 | 0.01 | -7.14 | 0.0300 | 0.0000 | |||
| RHI / Robert Half Inc. | 0.00 | -4.17 | 0.01 | -27.78 | 0.0300 | -0.0100 | |||
| DLB / Dolby Laboratories, Inc. | 0.00 | -4.05 | 0.01 | -7.69 | 0.0200 | -0.0100 | |||
| MZTI / The Marzetti Company | 0.00 | 0.00 | 0.01 | 0.00 | 0.0200 | 0.0000 | |||
| NSA / National Storage Affiliates Trust | 0.00 | -3.11 | 0.01 | -25.00 | 0.0100 | -0.0100 | |||
| AMTM / Amentum Holdings, Inc. | 0.00 | 0.00 | 0.0000 | 0.0000 | |||||
| INVH / Invitation Homes Inc. | 0.00 | -100.00 | 0.00 | -100.00 | -0.1300 |