Basic Stats
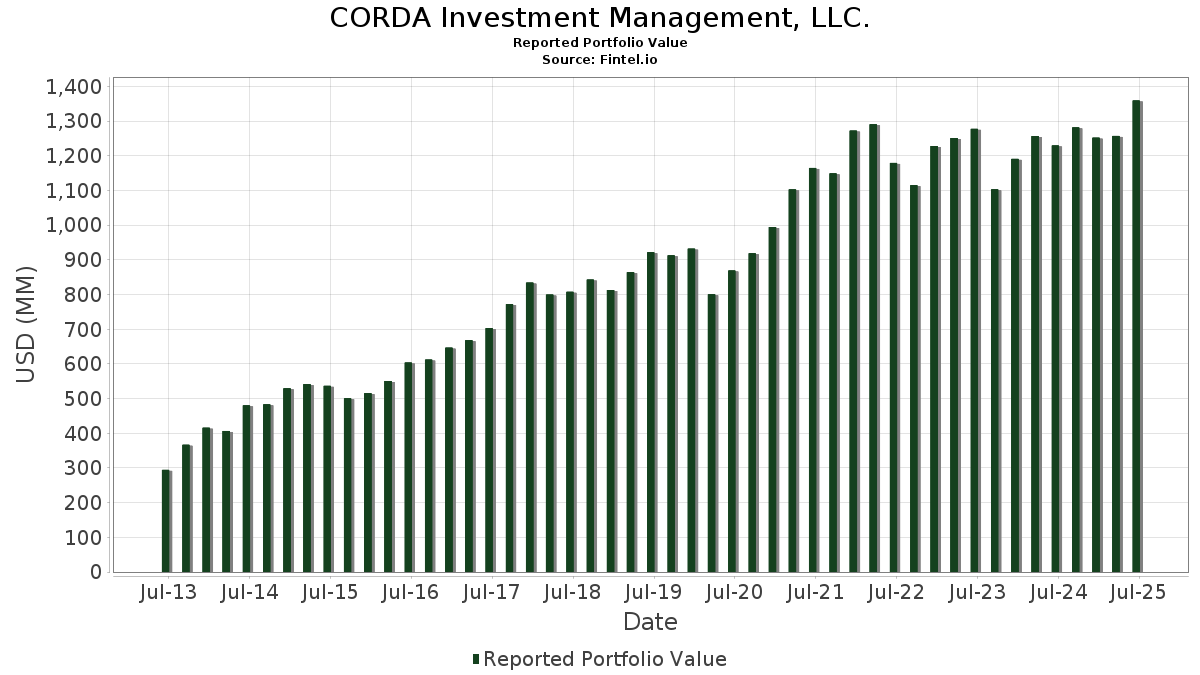
| Portfolio Value | $ 1,359,353,912 |
| Current Positions | 78 |
Latest Holdings, Performance, AUM (from 13F, 13D)
CORDA Investment Management, LLC. has disclosed 78 total holdings in their latest SEC filings. Most recent portfolio value is calculated to be $ 1,359,353,912 USD. Actual Assets Under Management (AUM) is this value plus cash (which is not disclosed). CORDA Investment Management, LLC.’s top holdings are CME Group Inc. (US:CME) , The Bank of New York Mellon Corporation (US:BK) , Apple Inc. (US:AAPL) , The Charles Schwab Corporation (US:SCHW) , and Deere & Company (US:DE) . CORDA Investment Management, LLC.’s new positions include ASML Holding N.V. - Depositary Receipt (Common Stock) (US:ASML) , iShares Bitcoin Trust ETF (US:IBIT) , Broadcom Inc. (US:AVGO) , International Business Machines Corporation (US:IBM) , and Galaxy Digital Inc. (US:GLXY) .
Top Increases This Quarter
We use the change in the portfolio allocation because this is the most meaningful metric. Changes can be due to trades or changes in share prices.
| Security | Shares (MM) |
Value (MM$) |
Portfolio % | ΔPortfolio % |
|---|---|---|---|---|
| 0.11 | 19.92 | 1.4656 | 1.4656 | |
| 0.02 | 15.18 | 1.1169 | 1.1169 | |
| 0.29 | 58.96 | 4.3371 | 0.9897 | |
| 0.08 | 12.29 | 0.9042 | 0.6344 | |
| 0.21 | 46.25 | 3.4021 | 0.4002 | |
| 0.54 | 31.27 | 2.3002 | 0.2158 | |
| 0.60 | 54.44 | 4.0048 | 0.2156 | |
| 0.22 | 39.07 | 2.8741 | 0.2132 | |
| 0.02 | 12.41 | 0.9132 | 0.1783 | |
| 0.20 | 24.25 | 1.7839 | 0.1345 |
Top Decreases This Quarter
We use the change in the portfolio allocation because this is the most meaningful metric. Changes can be due to trades or changes in share prices.
| Security | Shares (MM) |
Value (MM$) |
Portfolio % | ΔPortfolio % |
|---|---|---|---|---|
| 0.23 | 36.12 | 2.6574 | -0.4833 | |
| 1.25 | 26.17 | 1.9254 | -0.4435 | |
| 0.43 | 34.20 | 2.5159 | -0.4137 | |
| 0.30 | 39.22 | 2.8851 | -0.3802 | |
| 0.29 | 44.84 | 3.2986 | -0.3563 | |
| 0.68 | 31.87 | 2.3442 | -0.3461 | |
| 0.81 | 34.93 | 2.5696 | -0.3320 | |
| 0.09 | 25.78 | 1.8966 | -0.3312 | |
| 0.21 | 32.79 | 2.4122 | -0.3281 | |
| 0.78 | 20.03 | 1.4735 | -0.3202 |
13F and Fund Filings
This form was filed on 2025-07-30 for the reporting period 2025-06-30. Click the link icon to see the full transaction history.
Upgrade to unlock premium data and export to Excel ![]() .
.
| Security | Type | Avg Share Price | Shares (MM) |
ΔShares (%) |
ΔShares (%) |
Value ($MM) |
Portfolio (%) |
ΔPortfolio (%) |
|
|---|---|---|---|---|---|---|---|---|---|
| CME / CME Group Inc. | 0.22 | -2.05 | 61.17 | 1.77 | 4.4999 | -0.2807 | |||
| BK / The Bank of New York Mellon Corporation | 0.66 | -3.16 | 60.17 | 5.21 | 4.4262 | -0.1226 | |||
| AAPL / Apple Inc. | 0.29 | 51.66 | 58.96 | 40.08 | 4.3371 | 0.9897 | |||
| SCHW / The Charles Schwab Corporation | 0.60 | -1.96 | 54.44 | 14.27 | 4.0048 | 0.2156 | |||
| DE / Deere & Company | 0.10 | -1.98 | 49.38 | 6.19 | 3.6325 | -0.0659 | |||
| UL / Unilever PLC - Depositary Receipt (Common Stock) | 0.80 | -1.67 | 49.13 | 1.00 | 3.6139 | -0.2546 | |||
| AMZN / Amazon.com, Inc. | 0.21 | 6.26 | 46.25 | 22.53 | 3.4021 | 0.4002 | |||
| WELL / Welltower Inc. | 0.29 | -2.75 | 44.84 | -2.42 | 3.2986 | -0.3563 | |||
| USB / U.S. Bancorp | 0.95 | 1.93 | 42.98 | 9.25 | 3.1618 | 0.0327 | |||
| PEP / PepsiCo, Inc. | 0.30 | 8.48 | 39.22 | -4.47 | 2.8851 | -0.3802 | |||
| GOOGL / Alphabet Inc. | 0.22 | 2.47 | 39.07 | 16.78 | 2.8741 | 0.2132 | |||
| MDLZ / Mondelez International, Inc. | 0.57 | -0.62 | 38.44 | -1.22 | 2.8281 | -0.2674 | |||
| GJR / Strats Trust For Procter & Gambel Security - Preferred Security | 0.23 | -2.15 | 36.12 | -8.52 | 2.6574 | -0.4833 | |||
| VZ / Verizon Communications Inc. | 0.81 | 0.37 | 34.93 | -4.25 | 2.5696 | -0.3320 | |||
| MRK / Merck & Co., Inc. | 0.43 | 5.28 | 34.20 | -7.15 | 2.5159 | -0.4137 | |||
| SPG / Simon Property Group, Inc. | 0.21 | -0.53 | 34.00 | -3.71 | 2.5014 | -0.3073 | |||
| JNJ / Johnson & Johnson | 0.21 | 3.33 | 32.79 | -4.83 | 2.4122 | -0.3281 | |||
| HIW / Highwoods Properties, Inc. | 1.03 | 0.79 | 31.94 | 5.72 | 2.3494 | -0.0532 | |||
| CNA / CNA Financial Corporation | 0.68 | 2.83 | 31.87 | -5.79 | 2.3442 | -0.3461 | |||
| NTR / Nutrien Ltd. | 0.54 | 1.76 | 31.27 | 19.31 | 2.3002 | 0.2158 | |||
| KO / The Coca-Cola Company | 0.43 | -2.02 | 30.71 | -3.21 | 2.2589 | -0.2644 | |||
| CUZ / Cousins Properties Incorporated | 0.99 | 1.77 | 29.86 | 3.60 | 2.1969 | -0.0958 | |||
| GLW / Corning Incorporated | 0.56 | -0.04 | 29.67 | 14.83 | 2.1825 | 0.1276 | |||
| PFE / Pfizer Inc. | 1.14 | 6.37 | 27.72 | 1.75 | 2.0391 | -0.1276 | |||
| KVUE / Kenvue Inc. | 1.25 | 0.68 | 26.17 | -12.12 | 1.9254 | -0.4435 | |||
| MCD / McDonald's Corporation | 0.09 | -1.59 | 25.78 | -7.96 | 1.8966 | -0.3312 | |||
| DIS / The Walt Disney Company | 0.20 | -6.93 | 24.25 | 16.94 | 1.7839 | 0.1345 | |||
| CPT / Camden Property Trust | 0.21 | 0.87 | 23.54 | -7.05 | 1.7320 | -0.2827 | |||
| HON / Honeywell International Inc. | 0.10 | 1.83 | 22.87 | 11.99 | 1.6822 | 0.0581 | |||
| MDT / Medtronic plc | 0.26 | 3.80 | 22.76 | 0.69 | 1.6741 | -0.1235 | |||
| STZ / Constellation Brands, Inc. | 0.13 | 3.18 | 20.87 | -8.54 | 1.5354 | -0.2796 | |||
| KHC / The Kraft Heinz Company | 0.78 | 4.68 | 20.03 | -11.18 | 1.4735 | -0.3202 | |||
| AMAT / Applied Materials, Inc. | 0.11 | 19.92 | 1.4656 | 1.4656 | |||||
| HSY / The Hershey Company | 0.11 | 11.84 | 17.70 | 8.51 | 1.3024 | 0.0048 | |||
| VOO / Vanguard Index Funds - Vanguard S&P 500 ETF | 0.03 | 4.46 | 15.26 | 15.46 | 1.1226 | 0.0714 | |||
| ASML / ASML Holding N.V. - Depositary Receipt (Common Stock) | 0.02 | 15.18 | 1.1169 | 1.1169 | |||||
| LEVI / Levi Strauss & Co. | 0.69 | -2.36 | 12.73 | 15.80 | 0.9364 | 0.0621 | |||
| MSFT / Microsoft Corporation | 0.02 | 1.39 | 12.41 | 34.35 | 0.9132 | 0.1783 | |||
| NVDA / NVIDIA Corporation | 0.08 | 148.57 | 12.29 | 262.35 | 0.9042 | 0.6344 | |||
| NKE / NIKE, Inc. | 0.17 | 9.18 | 12.11 | 22.18 | 0.8912 | 0.1026 | |||
| BRK.B / Berkshire Hathaway Inc. | 0.02 | 0.46 | 10.79 | -8.37 | 0.7939 | -0.1429 | |||
| XOM / Exxon Mobil Corporation | 0.05 | 2.76 | 5.79 | -6.85 | 0.4262 | -0.0685 | |||
| VYM / Vanguard Whitehall Funds - Vanguard High Dividend Yield ETF | 0.03 | -3.53 | 4.59 | -0.28 | 0.3378 | -0.0284 | |||
| VIG / Vanguard Specialized Funds - Vanguard Dividend Appreciation ETF | 0.02 | -1.74 | 4.16 | 3.69 | 0.3060 | -0.0131 | |||
| CSCO / Cisco Systems, Inc. | 0.05 | -2.34 | 3.81 | 9.78 | 0.2800 | 0.0043 | |||
| QCOM / QUALCOMM Incorporated | 0.02 | 18.60 | 3.58 | 22.99 | 0.2633 | 0.0318 | |||
| BRK.A / Berkshire Hathaway Inc. | 0.00 | 0.00 | 2.92 | -8.71 | 0.2145 | -0.0396 | |||
| SPYV / SPDR Series Trust - SPDR Portfolio S&P 500 Value ETF | 0.05 | 0.06 | 2.73 | 2.55 | 0.2008 | -0.0109 | |||
| META / Meta Platforms, Inc. | 0.00 | 4.72 | 2.61 | 34.12 | 0.1917 | 0.0372 | |||
| CVX / Chevron Corporation | 0.02 | 17.19 | 2.60 | 0.35 | 0.1910 | -0.0149 | |||
| GOOG / Alphabet Inc. | 0.01 | 16.82 | 2.44 | 32.65 | 0.1797 | 0.0332 | |||
| SHW / The Sherwin-Williams Company | 0.01 | 0.00 | 2.22 | -1.68 | 0.1633 | -0.0163 | |||
| V / Visa Inc. | 0.01 | 0.71 | 2.06 | 2.03 | 0.1516 | -0.0090 | |||
| ABT / Abbott Laboratories | 0.01 | -0.58 | 2.04 | 1.90 | 0.1500 | -0.0091 | |||
| VEU / Vanguard International Equity Index Funds - Vanguard FTSE All-World ex-US ETF | 0.03 | 0.73 | 2.03 | 11.63 | 0.1491 | 0.0047 | |||
| TSLA / Tesla, Inc. | 0.01 | -11.14 | 1.89 | 8.88 | 0.1390 | 0.0010 | |||
| SCHD / Schwab Strategic Trust - Schwab U.S. Dividend Equity ETF | 0.07 | 20.79 | 1.88 | 14.47 | 0.1386 | 0.0077 | |||
| JPM / JPMorgan Chase & Co. | 0.01 | -11.77 | 1.75 | 4.23 | 0.1289 | -0.0048 | |||
| ORCL / Oracle Corporation | 0.01 | -7.23 | 1.67 | 45.13 | 0.1228 | 0.0313 | |||
| TDG / TransDigm Group Incorporated | 0.00 | 0.10 | 1.58 | 10.00 | 0.1166 | 0.0020 | |||
| MTDR / Matador Resources Company | 0.03 | 0.00 | 1.56 | -6.63 | 0.1150 | -0.0181 | |||
| SPY / SPDR S&P 500 ETF | 0.00 | -1.45 | 1.56 | 8.88 | 0.1146 | 0.0008 | |||
| HD / The Home Depot, Inc. | 0.00 | -0.24 | 1.50 | -0.27 | 0.1107 | -0.0092 | |||
| RTX / RTX Corporation | 0.01 | -2.12 | 1.48 | 7.96 | 0.1087 | -0.0002 | |||
| IBIT / iShares Bitcoin Trust ETF | 0.02 | 1.40 | 0.1029 | 0.1029 | |||||
| CAT / Caterpillar Inc. | 0.00 | 10.15 | 1.36 | 29.66 | 0.1004 | 0.0167 | |||
| AVGO / Broadcom Inc. | 0.00 | 1.36 | 0.1003 | 0.1003 | |||||
| WMT / Walmart Inc. | 0.01 | -8.20 | 1.35 | 2.28 | 0.0992 | -0.0057 | |||
| ETR / Entergy Corporation | 0.01 | 0.00 | 1.24 | -2.74 | 0.0913 | -0.0102 | |||
| LLY / Eli Lilly and Company | 0.00 | -3.37 | 1.21 | -8.76 | 0.0889 | -0.0165 | |||
| VTV / Vanguard Index Funds - Vanguard Value ETF | 0.01 | -7.72 | 1.19 | -5.55 | 0.0876 | -0.0127 | |||
| EPD / Enterprise Products Partners L.P. - Limited Partnership | 0.04 | 6.55 | 1.18 | -3.20 | 0.0868 | -0.0102 | |||
| IBM / International Business Machines Corporation | 0.00 | 1.18 | 0.0866 | 0.0866 | |||||
| EMR / Emerson Electric Co. | 0.01 | 1.17 | 0.0863 | 0.0863 | |||||
| GLXY / Galaxy Digital Inc. | 0.05 | 1.16 | 0.0852 | 0.0852 | |||||
| VTI / Vanguard Index Funds - Vanguard Total Stock Market ETF | 0.00 | -8.72 | 1.11 | 0.91 | 0.0819 | -0.0058 | |||
| ABBV / AbbVie Inc. | 0.01 | -11.08 | 1.09 | -21.24 | 0.0805 | -0.0300 | |||
| SPDW / SPDR Index Shares Funds - SPDR Portfolio Developed World ex-US ETF | 0.03 | 1.09 | 0.0805 | 0.0805 |