Basic Stats
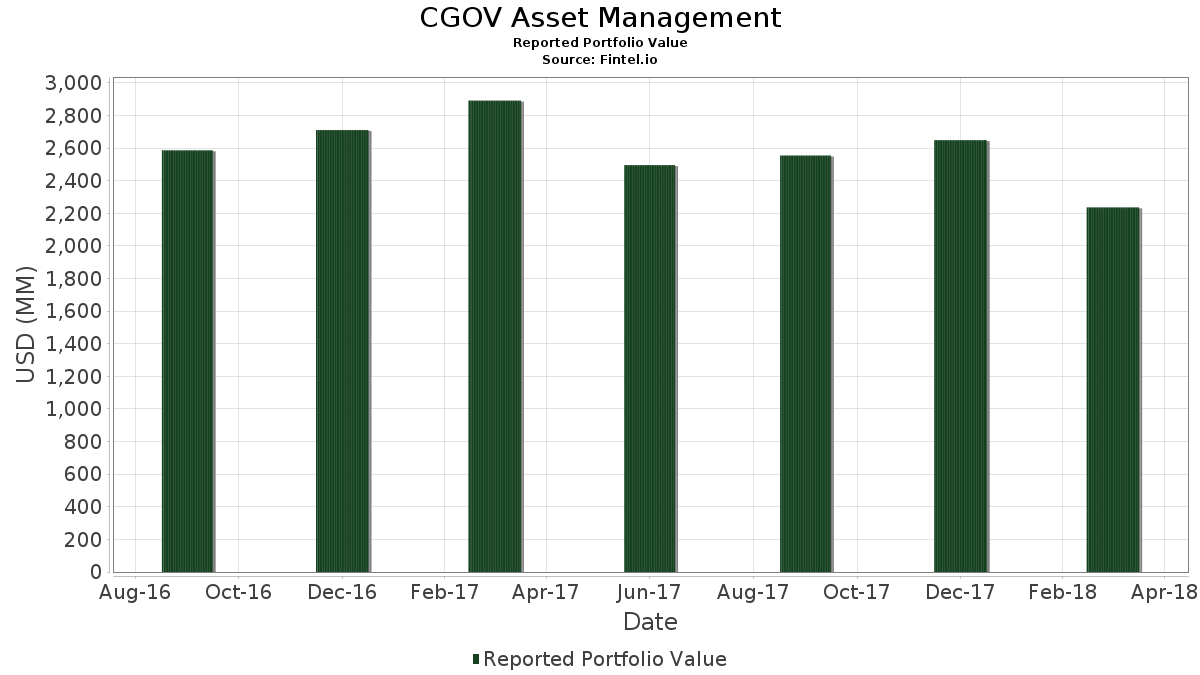
| Portfolio Value | $ 1,734,007,000 |
| Current Positions | 49 |
Latest Holdings, Performance, AUM (from 13F, 13D)
CGOV Asset Management has disclosed 49 total holdings in their latest SEC filings. Most recent portfolio value is calculated to be $ 1,734,007,000 USD. Actual Assets Under Management (AUM) is this value plus cash (which is not disclosed). CGOV Asset Management’s top holdings are The Toronto-Dominion Bank (US:TD) , Nutrien Ltd. (US:NTR) , Suncor Energy Inc. (US:SU) , Magna International Inc. (US:MGA) , and Enbridge Inc. (US:ENB) . CGOV Asset Management’s new positions include Nutrien Ltd. (US:NTR) , Johnson & Johnson (US:JNJ) , .
Top Increases This Quarter
We use the change in the portfolio allocation because this is the most meaningful metric. Changes can be due to trades or changes in share prices.
| Security | Shares (MM) |
Value (MM$) |
Portfolio % | ΔPortfolio % |
|---|---|---|---|---|
| 3.11 | 176.25 | 10.1643 | 10.1643 | |
| 3.04 | 143.44 | 8.2722 | 8.2722 | |
| 2.20 | 123.75 | 7.1366 | 7.1366 | |
| 1.44 | 105.02 | 6.0563 | 6.0563 | |
| 1.63 | 100.32 | 5.7854 | 5.7854 | |
| 3.07 | 96.48 | 5.5642 | 5.5642 | |
| 4.48 | 83.41 | 4.8100 | 4.8100 | |
| 0.66 | 75.81 | 4.3720 | 4.3720 | |
| 0.62 | 74.45 | 4.2935 | 4.2935 | |
| 1.20 | 69.60 | 4.0136 | 4.0136 |
Top Decreases This Quarter
We use the change in the portfolio allocation because this is the most meaningful metric. Changes can be due to trades or changes in share prices.
| Security | Shares (MM) |
Value (MM$) |
Portfolio % | ΔPortfolio % |
|---|---|---|---|---|
| 0.00 | 0.00 | -7.8593 | ||
| 3.36 | 105.60 | 6.0900 | -0.4476 | |
| 0.28 | 49.34 | 2.8457 | -0.3361 | |
| 3.99 | 137.53 | 7.9315 | -0.2288 |
13F and Fund Filings
This form was filed on 2018-04-10 for the reporting period 2018-03-31. Click the link icon to see the full transaction history.
Upgrade to unlock premium data and export to Excel ![]() .
.
| Security | Type | Avg Share Price | Shares (MM) |
ΔShares (%) |
ΔShares (%) |
Value ($MM) |
Portfolio (%) |
ΔPortfolio (%) |
|
|---|---|---|---|---|---|---|---|---|---|
| TD / The Toronto-Dominion Bank | 3.11 | -5.79 | 176.25 | -27.47 | 10.1643 | 10.1643 | |||
| NTR / Nutrien Ltd. | 3.04 | 143.44 | 8.2722 | 8.2722 | |||||
| SU / Suncor Energy Inc. | 3.99 | -14.91 | 137.53 | -36.38 | 7.9315 | -0.2288 | |||
| MGA / Magna International Inc. | 2.20 | -10.27 | 123.75 | -29.11 | 7.1366 | 7.1366 | |||
| ENB / Enbridge Inc. | 3.36 | -4.62 | 105.60 | -39.03 | 6.0900 | -0.4476 | |||
| CNI / Canadian National Railway Company | 1.44 | 7.73 | 105.02 | -24.10 | 6.0563 | 6.0563 | |||
| BNS / The Bank of Nova Scotia | 1.63 | -1.28 | 100.32 | -25.10 | 5.7854 | 5.7854 | |||
| RBA / RB Global, Inc. | 3.07 | -38.66 | 96.48 | -48.80 | 5.5642 | 5.5642 | |||
| CAE / CAE Inc. | 4.48 | -4.20 | 83.41 | -23.70 | 4.8100 | 4.8100 | |||
| CBOE / Cboe Global Markets, Inc. | 0.66 | -7.86 | 75.81 | -32.58 | 4.3720 | 4.3720 | |||
| V / Visa Inc. | 0.62 | -12.33 | 74.45 | -26.52 | 4.2935 | 4.2935 | |||
| NVS / Novartis AG - Depositary Receipt (Common Stock) | 0.87 | -2.54 | 70.74 | -25.03 | 4.0798 | 0.5182 | |||
| SBUX / Starbucks Corporation | 1.20 | 5.08 | 69.60 | -15.38 | 4.0136 | 4.0136 | |||
| CVS / CVS Health Corporation | 1.07 | -1.12 | 66.28 | -32.22 | 3.8226 | 0.1313 | |||
| FMX / Fomento Económico Mexicano, S.A.B. de C.V. - Depositary Receipt (Common Stock) | 0.67 | -0.18 | 61.68 | -22.35 | 3.5573 | 0.5587 | |||
| ECL / Ecolab Inc. | 0.37 | -7.13 | 50.23 | -24.21 | 2.8970 | 0.3952 | |||
| CP / Canadian Pacific Kansas City Limited | 0.28 | -23.70 | 49.34 | -41.46 | 2.8457 | -0.3361 | |||
| TU / TELUS Corporation | 1.29 | -10.18 | 45.29 | -33.82 | 2.6116 | 2.6116 | |||
| UL / Unilever PLC - Depositary Receipt (Common Stock) | 0.76 | 0.70 | 42.16 | -19.23 | 2.4317 | 2.4317 | |||
| CSCO / Cisco Systems, Inc. | 0.40 | -42.35 | 17.00 | -48.42 | 0.9802 | 0.9802 | |||
| ZTS / Zoetis Inc. | 0.06 | -52.68 | 5.31 | -56.18 | 0.3062 | 0.3062 | |||
| FNV / Franco-Nevada Corporation | 0.05 | 20.18 | 3.73 | -17.89 | 0.2149 | 0.2149 | |||
| RY / Royal Bank of Canada | 0.04 | 8.79 | 3.46 | -18.20 | 0.1993 | 0.0398 | |||
| UNP / Union Pacific Corporation | 0.02 | -3.02 | 2.80 | -22.33 | 0.1616 | 0.1616 | |||
| SLB / Schlumberger Limited | 0.04 | -7.56 | 2.58 | -29.00 | 0.1485 | 0.0116 | |||
| BG / Bunge Global SA | 0.03 | 10.46 | 2.56 | -2.74 | 0.1474 | 0.1474 | |||
| LECO / Lincoln Electric Holdings, Inc. | 0.02 | -50.31 | 1.99 | -61.02 | 0.1148 | 0.1148 | |||
| DEO / Diageo plc - Depositary Receipt (Common Stock) | 0.01 | 10.33 | 1.91 | -18.29 | 0.1103 | 0.0219 | |||
| GOOG / Alphabet Inc. | 0.00 | 8.39 | 1.33 | -14.61 | 0.0769 | 0.0769 | |||
| CME / CME Group Inc. | 0.01 | 7.69 | 1.13 | -4.71 | 0.0653 | 0.0204 | |||
| DIS / The Walt Disney Company | 0.01 | 16.88 | 1.11 | -12.78 | 0.0641 | 0.0641 | |||
| CM / Canadian Imperial Bank of Commerce | 0.01 | -3.83 | 1.11 | -30.79 | 0.0639 | 0.0639 | |||
| THRM / Gentherm Incorporated | 0.03 | -16.65 | 1.00 | -28.76 | 0.0578 | 0.0578 | |||
| AAPL / Apple Inc. | 0.01 | 31.96 | 0.98 | 4.48 | 0.0565 | 0.0211 | |||
| WST / West Pharmaceutical Services, Inc. | 0.01 | 27.35 | 0.96 | -8.95 | 0.0551 | 0.0551 | |||
| MSGS / Madison Square Garden Sports Corp. | 0.00 | -12.79 | 0.92 | -18.77 | 0.0532 | 0.0532 | |||
| MPC / Marathon Petroleum Corporation | 0.01 | -8.33 | 0.80 | -18.87 | 0.0464 | 0.0464 | |||
| RSG / Republic Services, Inc. | 0.01 | 15.00 | 0.76 | -9.93 | 0.0439 | 0.0439 | |||
| MDLZ / Mondelez International, Inc. | 0.01 | -5.66 | 0.63 | -26.53 | 0.0361 | 0.0361 | |||
| BRK.B / Berkshire Hathaway Inc. | 0.00 | -9.23 | 0.59 | -27.05 | 0.0339 | 0.0339 | |||
| VT / Vanguard International Equity Index Funds - Vanguard Total World Stock ETF | 0.01 | -99.44 | 0.58 | -99.56 | 0.0332 | 0.0332 | |||
| ABT / Abbott Laboratories | 0.01 | -86.02 | 0.53 | -88.28 | 0.0307 | 0.0307 | |||
| SJRWF / Shaw Communications Inc. - Class A | 0.03 | 0.00 | 0.48 | -32.91 | 0.0277 | 0.0277 | |||
| CMP / Compass Minerals International, Inc. | 0.01 | 7.14 | 0.45 | -28.59 | 0.0261 | 0.0261 | |||
| BMO / Bank of Montreal | 0.01 | 0.00 | 0.44 | -24.91 | 0.0254 | 0.0254 | |||
| ORCL / Oracle Corporation | 0.01 | -53.20 | 0.43 | -63.78 | 0.0251 | 0.0251 | |||
| FCFS / FirstCash Holdings, Inc. | 0.01 | 0.00 | 0.41 | -3.99 | 0.0236 | 0.0236 | |||
| TRP / TC Energy Corporation | 0.01 | 50.15 | 0.34 | 1.50 | 0.0195 | 0.0195 | |||
| JNJ / Johnson & Johnson | 0.00 | 0.29 | 0.0170 | 0.0170 | |||||
| AGU / Agrium Inc. | 0.00 | -100.00 | 0.00 | -100.00 | -7.8593 | ||||
| PPL / Pembina Pipeline Corporation | 0.00 | -100.00 | 0.00 | -100.00 | 0.0000 | ||||
| BCE / BCE Inc. | 0.00 | -100.00 | 0.00 | -100.00 | 0.0000 |