Basic Stats
| Portfolio Value | $ 364,168,000 |
| Current Positions | 183 |
Latest Holdings, Performance, AUM (from 13F, 13D)
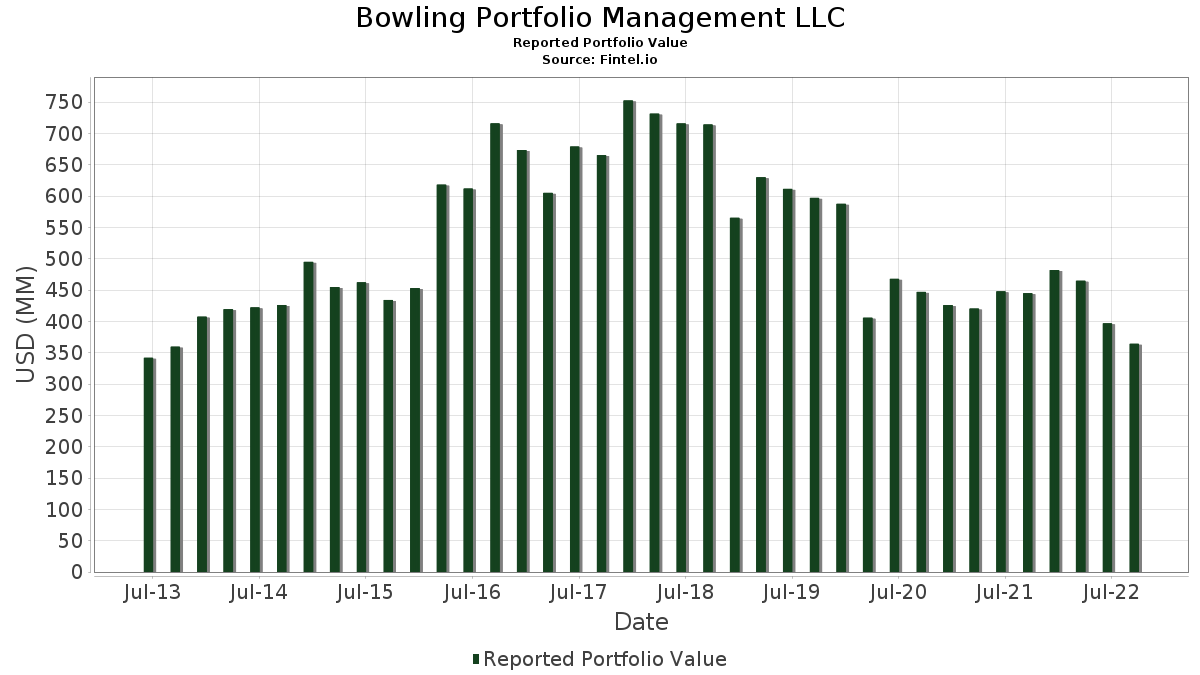
Bowling Portfolio Management LLC has disclosed 183 total holdings in their latest SEC filings. Most recent portfolio value is calculated to be $ 364,168,000 USD. Actual Assets Under Management (AUM) is this value plus cash (which is not disclosed). Bowling Portfolio Management LLC’s top holdings are Apple Inc. (US:AAPL) , Microsoft Corporation (US:MSFT) , Alphabet Inc. (US:GOOGL) , Amazon.com, Inc. (US:AMZN) , and Schwab Strategic Trust - Schwab U.S. Large-Cap ETF (US:SCHX) . Bowling Portfolio Management LLC’s new positions include Synopsys, Inc. (US:SNPS) , Microchip Technology Incorporated (US:MCHP) , Crane Company (US:CR) , East West Bancorp, Inc. (US:EWBC) , and GoDaddy Inc. (US:GDDY) .
Top Increases This Quarter
We use the change in the portfolio allocation because this is the most meaningful metric. Changes can be due to trades or changes in share prices.
| Security | Shares (MM) |
Value (MM$) |
Portfolio % | ΔPortfolio % |
|---|---|---|---|---|
| 0.01 | 1.81 | 0.4967 | 0.4967 | |
| 0.01 | 1.80 | 0.4954 | 0.4954 | |
| 0.01 | 1.76 | 0.4825 | 0.4825 | |
| 0.04 | 3.19 | 0.8746 | 0.4411 | |
| 0.00 | 1.60 | 0.4405 | 0.4405 | |
| 0.00 | 1.48 | 0.4050 | 0.4050 | |
| 0.01 | 1.47 | 0.4045 | 0.4045 | |
| 0.02 | 1.45 | 0.3979 | 0.3979 | |
| 0.02 | 1.44 | 0.3940 | 0.3940 | |
| 0.07 | 1.40 | 0.3855 | 0.3855 |
Top Decreases This Quarter
We use the change in the portfolio allocation because this is the most meaningful metric. Changes can be due to trades or changes in share prices.
| Security | Shares (MM) |
Value (MM$) |
Portfolio % | ΔPortfolio % |
|---|---|---|---|---|
| 0.09 | 20.78 | 5.7064 | -0.6515 | |
| 0.00 | 0.00 | -0.5449 | ||
| 0.00 | 0.22 | 0.0601 | -0.5364 | |
| 0.00 | 0.00 | -0.5139 | ||
| 0.02 | 2.07 | 0.5695 | -0.4540 | |
| 0.00 | 0.00 | -0.4118 | ||
| 0.00 | 0.00 | -0.3891 | ||
| 0.00 | 0.00 | -0.3733 | ||
| 0.00 | 0.00 | -0.3642 | ||
| 0.01 | 1.99 | 0.5454 | -0.3559 |
13F and Fund Filings
This form was filed on 2022-10-04 for the reporting period 2022-09-30. Click the link icon to see the full transaction history.
Upgrade to unlock premium data and export to Excel ![]() .
.
| Security | Type | Avg Share Price | Shares (MM) |
ΔShares (%) |
ΔShares (%) |
Value ($MM) |
Portfolio (%) |
ΔPortfolio (%) |
|
|---|---|---|---|---|---|---|---|---|---|
| AAPL / Apple Inc. | 0.22 | -5.35 | 31.07 | -4.32 | 8.5321 | 0.3471 | |||
| MSFT / Microsoft Corporation | 0.09 | -9.16 | 20.78 | -17.62 | 5.7064 | -0.6515 | |||
| GOOGL / Alphabet Inc. | 0.13 | 1,832.28 | 12.20 | -15.19 | 3.3487 | -0.2753 | |||
| AMZN / Amazon.com, Inc. | 0.10 | -1.30 | 10.75 | 5.01 | 2.9517 | 0.3718 | |||
| SCHX / Schwab Strategic Trust - Schwab U.S. Large-Cap ETF | 0.13 | -0.93 | 5.47 | -6.04 | 1.5026 | 0.0347 | |||
| BRK.B / Berkshire Hathaway Inc. | 0.02 | -12.79 | 5.43 | -14.71 | 1.4908 | -0.1134 | |||
| PG / The Procter & Gamble Company | 0.04 | -8.44 | 5.30 | -19.61 | 1.4545 | -0.2061 | |||
| UNH / UnitedHealth Group Incorporated | 0.01 | -3.71 | 5.20 | -5.32 | 1.4279 | 0.0437 | |||
| ELV / Elevance Health, Inc. | 0.01 | 2.87 | 4.99 | -3.16 | 1.3702 | 0.0715 | |||
| META / Meta Platforms, Inc. | 0.04 | 2.20 | 4.98 | -14.00 | 1.3683 | -0.0920 | |||
| KLAC / KLA Corporation | 0.02 | -2.26 | 4.58 | -7.29 | 1.2566 | 0.0125 | |||
| XOM / Exxon Mobil Corporation | 0.05 | -1.75 | 4.54 | 0.18 | 1.2475 | 0.1045 | |||
| CVS / CVS Health Corporation | 0.05 | -6.10 | 4.54 | -3.36 | 1.2467 | 0.0626 | |||
| JNJ / Johnson & Johnson | 0.03 | -4.86 | 4.54 | -12.43 | 1.2453 | -0.0600 | |||
| LPLA / LPL Financial Holdings Inc. | 0.02 | -1.17 | 4.45 | 17.06 | 1.2231 | 0.2641 | |||
| AVGO / Broadcom Inc. | 0.01 | 2.24 | 4.31 | -6.55 | 1.1832 | 0.0211 | |||
| CVX / Chevron Corporation | 0.03 | 0.69 | 4.10 | -0.10 | 1.1248 | 0.0914 | |||
| KR / The Kroger Co. | 0.08 | -3.54 | 3.67 | -10.83 | 1.0081 | -0.0296 | |||
| MRK / Merck & Co., Inc. | 0.04 | -1.68 | 3.62 | -7.12 | 0.9951 | 0.0117 | |||
| GOOG / Alphabet Inc. | 0.04 | 1,837.55 | 3.56 | -14.83 | 0.9781 | -0.0759 | |||
| AMJ / JPMorgan Alerian MLP Index ETN - Corporate Bond/Note | 0.03 | -18.31 | 3.54 | -24.19 | 0.9707 | -0.2046 | |||
| AMGN / Amgen Inc. | 0.01 | 40.63 | 3.31 | 30.28 | 0.9097 | 0.2688 | |||
| LMT / Lockheed Martin Corporation | 0.01 | -14.03 | 3.20 | -22.77 | 0.8782 | -0.1655 | |||
| PCAR / PACCAR Inc | 0.04 | 82.14 | 3.19 | 85.17 | 0.8746 | 0.4411 | |||
| XLU / The Select Sector SPDR Trust - The Utilities Select Sector SPDR Fund | 0.05 | -4.00 | 3.19 | -10.31 | 0.8746 | -0.0204 | |||
| COP / ConocoPhillips | 0.03 | -1.48 | 3.12 | 12.26 | 0.8576 | 0.1564 | |||
| HD / The Home Depot, Inc. | 0.01 | -5.16 | 3.07 | -4.57 | 0.8425 | 0.0322 | |||
| CDNS / Cadence Design Systems, Inc. | 0.02 | -2.45 | 2.94 | 6.26 | 0.8068 | 0.1099 | |||
| PHM / PulteGroup, Inc. | 0.08 | -1.11 | 2.84 | -6.43 | 0.7799 | 0.0149 | |||
| NOC / Northrop Grumman Corporation | 0.01 | -4.25 | 2.83 | -5.92 | 0.7771 | 0.0190 | |||
| MCK / McKesson Corporation | 0.01 | -9.36 | 2.66 | -5.54 | 0.7304 | 0.0207 | |||
| RE / Everest Re Group Ltd | 0.01 | 35.16 | 2.60 | 26.59 | 0.7126 | 0.1959 | |||
| HCA / HCA Healthcare, Inc. | 0.01 | -3.33 | 2.59 | 5.72 | 0.7101 | 0.0936 | |||
| ADM / Archer-Daniels-Midland Company | 0.03 | -1.69 | 2.57 | 1.94 | 0.7060 | 0.0704 | |||
| RTX / RTX Corporation | 0.03 | 63.95 | 2.53 | 39.68 | 0.6950 | 0.2383 | |||
| PFE / Pfizer Inc. | 0.06 | -5.30 | 2.52 | -20.96 | 0.6906 | -0.1114 | |||
| BAC.PRB / Bank of America Corporation - Preferred Stock | 0.08 | -20.70 | 2.51 | -23.07 | 0.6887 | -0.1330 | |||
| AZO / AutoZone, Inc. | 0.00 | -11.99 | 2.34 | -12.28 | 0.6434 | -0.0298 | |||
| NUE / Nucor Corporation | 0.02 | -1.08 | 2.33 | 1.35 | 0.6406 | 0.0604 | |||
| HIG / The Hartford Insurance Group, Inc. | 0.04 | 43.32 | 2.32 | 35.69 | 0.6379 | 0.2064 | |||
| MPC / Marathon Petroleum Corporation | 0.02 | -2.88 | 2.22 | 17.36 | 0.6107 | 0.1331 | |||
| V / Visa Inc. | 0.01 | -2.21 | 2.22 | -11.76 | 0.6099 | -0.0245 | |||
| HPQ / HP Inc. | 0.09 | 4.68 | 2.19 | -20.42 | 0.6025 | -0.0924 | |||
| PAG / Penske Automotive Group, Inc. | 0.02 | -3.67 | 2.18 | -9.43 | 0.5986 | -0.0080 | |||
| CDW / CDW Corporation | 0.01 | -1.27 | 2.17 | -2.21 | 0.5953 | 0.0366 | |||
| MET.PRA / MetLife, Inc. - Preferred Stock | 0.04 | 34.11 | 2.14 | 29.81 | 0.5871 | 0.1720 | |||
| CBRE / CBRE Group, Inc. | 0.03 | -1.54 | 2.13 | -9.72 | 0.5841 | -0.0097 | |||
| AN / AutoNation, Inc. | 0.02 | -5.72 | 2.11 | -14.05 | 0.5797 | -0.0393 | |||
| BR / Broadridge Financial Solutions, Inc. | 0.01 | -3.72 | 2.10 | -2.56 | 0.5756 | 0.0334 | |||
| ABBV / AbbVie Inc. | 0.02 | -41.73 | 2.07 | -48.93 | 0.5695 | -0.4540 | |||
| JAZZ / Jazz Pharmaceuticals plc | 0.02 | 55.79 | 2.06 | 33.12 | 0.5662 | 0.1758 | |||
| ABC / Amerisource Bergen Corp. | 0.01 | -41.94 | 1.99 | -44.46 | 0.5454 | -0.3559 | |||
| KO / The Coca-Cola Company | 0.04 | -6.26 | 1.97 | -16.53 | 0.5421 | -0.0540 | |||
| VNQ / Vanguard Specialized Funds - Vanguard Real Estate ETF | 0.02 | -4.16 | 1.95 | -15.66 | 0.5355 | -0.0472 | |||
| USRT / iShares Trust - iShares Core U.S. REIT ETF | 0.04 | -3.92 | 1.91 | -14.55 | 0.5256 | -0.0390 | |||
| PEP / PepsiCo, Inc. | 0.01 | -8.84 | 1.90 | -10.71 | 0.5220 | -0.0146 | |||
| ORCL / Oracle Corporation | 0.03 | -2.51 | 1.87 | -14.76 | 0.5138 | -0.0395 | |||
| PNC / The PNC Financial Services Group, Inc. | 0.01 | -2.82 | 1.83 | -7.92 | 0.5014 | 0.0016 | |||
| CI / The Cigna Group | 0.01 | 1.81 | 0.4967 | 0.4967 | |||||
| NVDA / NVIDIA Corporation | 0.01 | -0.34 | 1.81 | -20.17 | 0.4967 | -0.0744 | |||
| ADP / Automatic Data Processing, Inc. | 0.01 | 1.80 | 0.4954 | 0.4954 | |||||
| VRTX / Vertex Pharmaceuticals Incorporated | 0.01 | 1.76 | 0.4825 | 0.4825 | |||||
| ACGL / Arch Capital Group Ltd. | 0.04 | 76.54 | 1.71 | 76.87 | 0.4682 | 0.2252 | |||
| FITB / Fifth Third Bancorp | 0.05 | -2.87 | 1.67 | -7.64 | 0.4583 | 0.0029 | |||
| MA / Mastercard Incorporated | 0.01 | -2.03 | 1.66 | -11.70 | 0.4561 | -0.0180 | |||
| DOX / Amdocs Limited | 0.02 | -3.44 | 1.65 | -7.94 | 0.4523 | 0.0014 | |||
| JBL / Jabil Inc. | 0.03 | -2.95 | 1.63 | 9.41 | 0.4470 | 0.0720 | |||
| CSCO / Cisco Systems, Inc. | 0.04 | -3.74 | 1.63 | -9.72 | 0.4465 | -0.0074 | |||
| MOH / Molina Healthcare, Inc. | 0.00 | 1.60 | 0.4405 | 0.4405 | |||||
| CNC / Centene Corporation | 0.02 | -12.24 | 1.59 | -19.26 | 0.4374 | -0.0598 | |||
| GPC / Genuine Parts Company | 0.01 | -16.07 | 1.57 | -5.77 | 0.4308 | 0.0112 | |||
| DVN / Devon Energy Corporation | 0.03 | 4.54 | 1.57 | 14.05 | 0.4303 | 0.0840 | |||
| SPY / SPDR S&P 500 ETF | 0.00 | -2.02 | 1.56 | -7.21 | 0.4275 | 0.0046 | |||
| BMY / Bristol-Myers Squibb Company | 0.02 | -6.10 | 1.54 | -13.29 | 0.4229 | -0.0247 | |||
| UNM / Unum Group | 0.04 | 85.43 | 1.54 | 111.42 | 0.4221 | 0.2388 | |||
| LLY / Eli Lilly and Company | 0.00 | -12.22 | 1.52 | -12.41 | 0.4185 | -0.0201 | |||
| NXST / Nexstar Media Group, Inc. | 0.01 | 25.19 | 1.51 | 28.28 | 0.4135 | 0.1177 | |||
| OC / Owens Corning | 0.02 | 6.87 | 1.50 | 12.99 | 0.4108 | 0.0771 | |||
| WFC / Wells Fargo & Company | 0.04 | -2.01 | 1.49 | 0.61 | 0.4094 | 0.0359 | |||
| BLDR / Builders FirstSource, Inc. | 0.03 | 1.56 | 1.48 | 11.45 | 0.4064 | 0.0717 | |||
| SNPS / Synopsys, Inc. | 0.00 | 1.48 | 0.4050 | 0.4050 | |||||
| RGA / Reinsurance Group of America, Incorporated | 0.01 | 1.47 | 0.4045 | 0.4045 | |||||
| MCHP / Microchip Technology Incorporated | 0.02 | 1.45 | 0.3979 | 0.3979 | |||||
| FNF / Fidelity National Financial, Inc. | 0.04 | 96.11 | 1.45 | 92.18 | 0.3979 | 0.2079 | |||
| OSK / Oshkosh Corporation | 0.02 | -4.24 | 1.45 | -18.03 | 0.3971 | -0.0475 | |||
| CMCSA / Comcast Corporation | 0.05 | -1.38 | 1.44 | -26.28 | 0.3951 | -0.0968 | |||
| UNP / Union Pacific Corporation | 0.01 | -2.53 | 1.44 | -10.92 | 0.3940 | -0.0120 | |||
| APH / Amphenol Corporation | 0.02 | 1.44 | 0.3940 | 0.3940 | |||||
| DIS / The Walt Disney Company | 0.02 | 135.66 | 1.43 | 135.53 | 0.3932 | 0.2400 | |||
| SCHW / The Charles Schwab Corporation | 0.02 | -1.28 | 1.43 | 12.24 | 0.3927 | 0.0716 | |||
| AIZ / Assurant, Inc. | 0.01 | -4.23 | 1.42 | -19.52 | 0.3905 | -0.0549 | |||
| WMT / Walmart Inc. | 0.01 | -7.17 | 1.41 | -0.98 | 0.3875 | 0.0283 | |||
| ACI / Albertsons Companies, Inc. | 0.06 | -2.66 | 1.41 | -9.45 | 0.3869 | -0.0053 | |||
| RF / Regions Financial Corporation | 0.07 | 1.40 | 0.3855 | 0.3855 | |||||
| AXS.PRE / AXIS Capital Holdings Limited - Preferred Stock | 0.03 | 111.81 | 1.40 | 82.35 | 0.3831 | 0.1903 | |||
| LEA / Lear Corporation | 0.01 | -3.24 | 1.39 | -7.99 | 0.3825 | 0.0009 | |||
| CR / Crane Company | 0.02 | 1.37 | 0.3773 | 0.3773 | |||||
| HRB / H&R Block, Inc. | 0.03 | 1.37 | 0.3762 | 0.3762 | |||||
| XLB / The Select Sector SPDR Trust - The Materials Select Sector SPDR Fund | 0.02 | -32.65 | 1.35 | -37.76 | 0.3721 | -0.1766 | |||
| URI / United Rentals, Inc. | 0.01 | 40.84 | 1.35 | 56.71 | 0.3718 | 0.1540 | |||
| CACI / CACI International Inc | 0.01 | 1.35 | 0.3715 | 0.3715 | |||||
| MO / Altria Group, Inc. | 0.03 | 3.29 | 1.35 | -0.07 | 0.3713 | 0.0302 | |||
| EWBC / East West Bancorp, Inc. | 0.02 | 1.35 | 0.3696 | 0.3696 | |||||
| L / Loews Corporation | 0.03 | 116.33 | 1.34 | 81.87 | 0.3691 | 0.1828 | |||
| FMAT / Fidelity Covington Trust - Fidelity MSCI Materials Index ETF | 0.04 | -32.02 | 1.34 | -36.96 | 0.3691 | -0.1683 | |||
| VAW / Vanguard World Fund - Vanguard Materials ETF | 0.01 | -32.00 | 1.34 | -37.01 | 0.3688 | -0.1686 | |||
| GDDY / GoDaddy Inc. | 0.02 | 1.34 | 0.3688 | 0.3688 | |||||
| F / Ford Motor Company | 0.12 | 1.31 | 0.3586 | 0.3586 | |||||
| NLOK / NortonLifeLock Inc | 0.06 | 1.30 | 0.3575 | 0.3575 | |||||
| GD / General Dynamics Corporation | 0.01 | -25.72 | 1.30 | -28.77 | 0.3570 | -0.1030 | |||
| TMUS / T-Mobile US, Inc. | 0.01 | 1.30 | 0.3562 | 0.3562 | |||||
| PSX / Phillips 66 | 0.02 | -2.20 | 1.28 | -3.67 | 0.3529 | 0.0166 | |||
| VOYA / Voya Financial, Inc. | 0.02 | -1.03 | 1.27 | 0.55 | 0.3490 | 0.0304 | |||
| SNDR / Schneider National, Inc. | 0.06 | -8.26 | 1.27 | -16.83 | 0.3487 | -0.0361 | |||
| HII / Huntington Ingalls Industries, Inc. | 0.01 | -2.64 | 1.24 | -1.04 | 0.3408 | 0.0247 | |||
| FDX / FedEx Corporation | 0.01 | -4.43 | 1.21 | -37.44 | 0.3331 | -0.1556 | |||
| CRUS / Cirrus Logic, Inc. | 0.02 | 1.18 | 0.3249 | 0.3249 | |||||
| WEX / WEX Inc. | 0.01 | 1.14 | 0.3133 | 0.3133 | |||||
| PPC / Pilgrim's Pride Corporation | 0.05 | 86.20 | 1.13 | 37.33 | 0.3111 | 0.1032 | |||
| TMO / Thermo Fisher Scientific Inc. | 0.00 | -4.66 | 1.13 | -11.02 | 0.3103 | -0.0098 | |||
| GNTX / Gentex Corporation | 0.05 | -3.20 | 1.13 | -17.50 | 0.3095 | -0.0348 | |||
| COST / Costco Wholesale Corporation | 0.00 | -15.21 | 1.11 | -16.50 | 0.3043 | -0.0302 | |||
| MCD / McDonald's Corporation | 0.00 | -10.16 | 1.00 | -16.05 | 0.2757 | -0.0257 | |||
| GILD / Gilead Sciences, Inc. | 0.02 | -4.50 | 0.98 | -4.69 | 0.2680 | 0.0099 | |||
| ON / ON Semiconductor Corporation | 0.02 | -45.94 | 0.97 | -33.06 | 0.2658 | -0.0986 | |||
| LYB / LyondellBasell Industries N.V. | 0.01 | -3.07 | 0.95 | -16.56 | 0.2600 | -0.0260 | |||
| SWKS / Skyworks Solutions, Inc. | 0.01 | -3.64 | 0.91 | -11.30 | 0.2502 | -0.0087 | |||
| DELL / Dell Technologies Inc. | 0.03 | 0.91 | 0.2502 | 0.2502 | |||||
| AEP / American Electric Power Company, Inc. | 0.01 | 1.77 | 0.90 | -8.33 | 0.2477 | -0.0003 | |||
| FYBR / Frontier Communications Parent, Inc. | 0.04 | 0.90 | 0.2474 | 0.2474 | |||||
| LKQ / LKQ Corporation | 0.02 | 66.28 | 0.84 | 59.81 | 0.2304 | 0.0981 | |||
| DAL / Delta Air Lines, Inc. | 0.03 | -6.01 | 0.81 | -8.98 | 0.2227 | -0.0019 | |||
| PEG / Public Service Enterprise Group Incorporated | 0.01 | -2.21 | 0.80 | -13.11 | 0.2202 | -0.0124 | |||
| RS / Reliance, Inc. | 0.00 | -7.53 | 0.80 | -4.99 | 0.2194 | 0.0074 | |||
| WLK / Westlake Corporation | 0.01 | -4.18 | 0.79 | -15.04 | 0.2156 | -0.0173 | |||
| INTC / Intel Corporation | 0.03 | -4.35 | 0.78 | -34.12 | 0.2147 | -0.0844 | |||
| LOW / Lowe's Companies, Inc. | 0.00 | 0.77 | 0.2117 | 0.2117 | |||||
| SCHF / Schwab Strategic Trust - Schwab International Equity ETF | 0.03 | 0.25 | 0.75 | -10.32 | 0.2051 | -0.0048 | |||
| SCHM / Schwab Strategic Trust - Schwab U.S. Mid-Cap ETF | 0.01 | 0.43 | 0.73 | -3.17 | 0.2016 | 0.0105 | |||
| HPE / Hewlett Packard Enterprise Company | 0.06 | -2.80 | 0.73 | -12.17 | 0.2002 | -0.0090 | |||
| CAH / Cardinal Health, Inc. | 0.01 | -3.31 | 0.73 | 23.22 | 0.1996 | 0.0509 | |||
| JLL / Jones Lang LaSalle Incorporated | 0.00 | 0.49 | 0.72 | -13.21 | 0.1966 | -0.0113 | |||
| CB / Chubb Limited | 0.00 | -55.58 | 0.70 | -58.89 | 0.1936 | -0.2387 | |||
| DFS / Discover Financial Services | 0.01 | -54.50 | 0.69 | -56.26 | 0.1900 | -0.2087 | |||
| LHX / L3Harris Technologies, Inc. | 0.00 | -6.95 | 0.61 | -20.00 | 0.1681 | -0.0248 | |||
| SCHB / Schwab Strategic Trust - Schwab U.S. Broad Market ETF | 0.01 | 2.83 | 0.59 | -2.16 | 0.1620 | 0.0100 | |||
| TSN / Tyson Foods, Inc. | 0.01 | -55.37 | 0.55 | -65.80 | 0.1516 | -0.2552 | |||
| WRB / W. R. Berkley Corporation | 0.01 | -3.79 | 0.54 | -9.01 | 0.1469 | -0.0013 | |||
| SCHA / Schwab Strategic Trust - Schwab U.S. Small-Cap ETF | 0.01 | 0.30 | 0.53 | -2.76 | 0.1450 | 0.0081 | |||
| MTG / MGIC Investment Corporation | 0.04 | -27.85 | 0.48 | -26.56 | 0.1329 | -0.0332 | |||
| ROOF / New York Life Investments ETF Trust - NYLI CBRE NextGen Real Estate ETF | 0.03 | -7.91 | 0.47 | -19.83 | 0.1288 | -0.0187 | |||
| SYY / Sysco Corporation | 0.01 | -3.64 | 0.43 | -19.55 | 0.1186 | -0.0167 | |||
| PKG / Packaging Corporation of America | 0.00 | -5.11 | 0.43 | -22.40 | 0.1170 | -0.0214 | |||
| STLD / Steel Dynamics, Inc. | 0.01 | -4.72 | 0.41 | 1.99 | 0.1129 | 0.0113 | |||
| BPOP / Popular, Inc. | 0.01 | -0.52 | 0.40 | -6.93 | 0.1107 | 0.0015 | |||
| BA / The Boeing Company | 0.00 | -11.56 | 0.40 | -21.72 | 0.1098 | -0.0190 | |||
| VSBIX / Vanguard Scottsdale Funds - Vanguard Short-Term Treasury Index Fund Institutional Shares | 0.01 | 0.00 | 0.38 | -1.80 | 0.1046 | 0.0068 | |||
| LRCX / Lam Research Corporation | 0.00 | -1.16 | 0.34 | -15.06 | 0.0945 | -0.0076 | |||
| MS / Morgan Stanley | 0.00 | -78.07 | 0.34 | -77.20 | 0.0925 | -0.2800 | |||
| AES / The AES Corporation | 0.01 | -2.63 | 0.34 | 4.67 | 0.0923 | 0.0114 | |||
| BAH / Booz Allen Hamilton Holding Corporation | 0.00 | -0.52 | 0.34 | 1.82 | 0.0923 | 0.0091 | |||
| OMF / OneMain Holdings, Inc. | 0.01 | -3.18 | 0.32 | -23.63 | 0.0879 | -0.0177 | |||
| C / Citigroup Inc. | 0.01 | -10.53 | 0.30 | -19.09 | 0.0827 | -0.0111 | |||
| US7587501039 / Regal-Beloit Corp. | 0.00 | -5.88 | 0.29 | 16.60 | 0.0791 | 0.0168 | |||
| TGT / Target Corporation | 0.00 | -61.37 | 0.29 | -59.32 | 0.0785 | -0.0986 | |||
| CTAS / Cintas Corporation | 0.00 | 0.00 | 0.28 | 4.14 | 0.0761 | 0.0090 | |||
| ARW / Arrow Electronics, Inc. | 0.00 | -80.08 | 0.28 | -83.63 | 0.0758 | -0.3491 | |||
| BBY / Best Buy Co., Inc. | 0.00 | -0.85 | 0.28 | -3.51 | 0.0755 | 0.0037 | |||
| PBP / Invesco Exchange-Traded Fund Trust - Invesco S&P 500 BuyWrite ETF | 0.01 | 0.00 | 0.27 | -8.08 | 0.0750 | 0.0001 | |||
| VLO / Valero Energy Corporation | 0.00 | -1.94 | 0.27 | -1.49 | 0.0728 | 0.0050 | |||
| BIIB / Biogen Inc. | 0.00 | -27.56 | 0.25 | -4.98 | 0.0681 | 0.0023 | |||
| PH / Parker-Hannifin Corporation | 0.00 | -5.66 | 0.25 | -7.17 | 0.0676 | 0.0008 | |||
| CMI / Cummins Inc. | 0.00 | -3.56 | 0.24 | 1.67 | 0.0667 | 0.0065 | |||
| MNST / Monster Beverage Corporation | 0.00 | 0.00 | 0.24 | -6.23 | 0.0662 | 0.0014 | |||
| WDC / Western Digital Corporation | 0.01 | -78.14 | 0.23 | -84.13 | 0.0645 | -0.3087 | |||
| TRN / Trinity Industries, Inc. | 0.01 | -5.75 | 0.23 | -17.14 | 0.0637 | -0.0069 | |||
| SCHE / Schwab Strategic Trust - Schwab Emerging Markets Equity ETF | 0.01 | 0.36 | 0.23 | -11.49 | 0.0634 | -0.0023 | |||
| IVV / iShares Trust - iShares Core S&P 500 ETF | 0.00 | 0.00 | 0.23 | -5.04 | 0.0621 | 0.0021 | |||
| QCOM / QUALCOMM Incorporated | 0.00 | -89.55 | 0.22 | -90.75 | 0.0601 | -0.5364 | |||
| EBAY / eBay Inc. | 0.01 | -1.45 | 0.21 | -12.96 | 0.0590 | -0.0032 | |||
| XLK / The Select Sector SPDR Trust - The Technology Select Sector SPDR Fund | 0.00 | -17.31 | 0.21 | -22.79 | 0.0577 | -0.0109 | |||
| APTV / Aptiv PLC | 0.00 | -9.53 | 0.21 | -20.61 | 0.0571 | -0.0089 | |||
| WTTR / Select Water Solutions, Inc. | 0.03 | 0.00 | 0.18 | 2.23 | 0.0503 | 0.0051 | |||
| BYD / Boyd Gaming Corporation | 0.00 | -100.00 | 0.00 | -100.00 | -0.3549 | ||||
| T / AT&T Inc. | 0.00 | -100.00 | 0.00 | -100.00 | -0.1880 | ||||
| TNL / Travel + Leisure Co. | 0.00 | -100.00 | 0.00 | -100.00 | -0.3241 | ||||
| ALSN / Allison Transmission Holdings, Inc. | 0.00 | -100.00 | 0.00 | -100.00 | -0.3642 | ||||
| ABT / Abbott Laboratories | 0.00 | -100.00 | 0.00 | -100.00 | -0.5139 | ||||
| PINC / Premier, Inc. | 0.00 | -100.00 | 0.00 | -100.00 | -0.3733 | ||||
| HOLX / Hologic, Inc. | 0.00 | -100.00 | 0.00 | -100.00 | -0.2720 | ||||
| CNXC / Concentrix Corporation | 0.00 | -100.00 | 0.00 | -100.00 | -0.1694 | ||||
| UNVR / Univar Solutions Inc | 0.00 | -100.00 | 0.00 | -100.00 | -0.3314 | ||||
| MU / Micron Technology, Inc. | 0.00 | -100.00 | 0.00 | -100.00 | -0.3241 | ||||
| SCI / Service Corporation International | 0.00 | -100.00 | 0.00 | -100.00 | -0.2289 | ||||
| UPS / United Parcel Service, Inc. | 0.00 | -100.00 | 0.00 | -100.00 | -0.5449 | ||||
| UTHR / United Therapeutics Corporation | 0.00 | -100.00 | 0.00 | -100.00 | -0.3324 | ||||
| IPG / The Interpublic Group of Companies, Inc. | 0.00 | -100.00 | 0.00 | -100.00 | -0.2619 | ||||
| TRV / The Travelers Companies, Inc. | 0.00 | -100.00 | 0.00 | -100.00 | -0.2490 | ||||
| IT / Gartner, Inc. | 0.00 | -100.00 | 0.00 | -100.00 | -0.3891 | ||||
| MDLZ / Mondelez International, Inc. | 0.00 | -100.00 | 0.00 | -100.00 | -0.0560 | ||||
| CTSH / Cognizant Technology Solutions Corporation | 0.00 | -100.00 | 0.00 | -100.00 | -0.4118 | ||||
| VIRT / Virtu Financial, Inc. | 0.00 | -100.00 | 0.00 | -100.00 | -0.1772 | ||||
| VIG / Vanguard Specialized Funds - Vanguard Dividend Appreciation ETF | 0.00 | -100.00 | 0.00 | -100.00 | -0.0577 | ||||
| AIG / American International Group, Inc. | 0.00 | -100.00 | 0.00 | -100.00 | -0.2150 | ||||
| LH / Labcorp Holdings Inc. | 0.00 | -100.00 | 0.00 | -100.00 | -0.0605 | ||||
| GS / The Goldman Sachs Group, Inc. | 0.00 | -100.00 | 0.00 | -100.00 | -0.3201 | ||||
| VZ / Verizon Communications Inc. | 0.00 | -100.00 | 0.00 | -100.00 | -0.3166 | ||||
| THG / The Hanover Insurance Group, Inc. | 0.00 | -100.00 | 0.00 | -100.00 | -0.1979 | ||||
| BHF / Brighthouse Financial, Inc. | 0.00 | -100.00 | 0.00 | -100.00 | -0.1492 |