Basic Stats
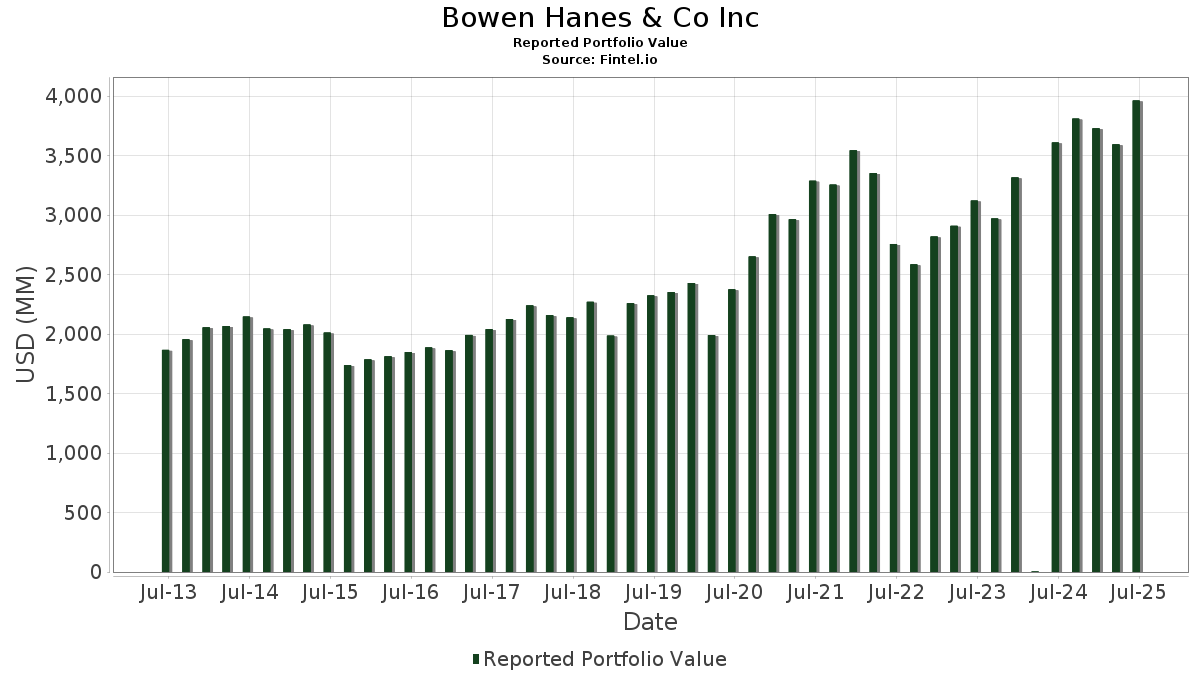
| Portfolio Value | $ 3,963,277,430 |
| Current Positions | 145 |
Latest Holdings, Performance, AUM (from 13F, 13D)
Bowen Hanes & Co Inc has disclosed 145 total holdings in their latest SEC filings. Most recent portfolio value is calculated to be $ 3,963,277,430 USD. Actual Assets Under Management (AUM) is this value plus cash (which is not disclosed). Bowen Hanes & Co Inc’s top holdings are NVIDIA Corporation (US:NVDA) , Netflix, Inc. (US:NFLX) , Costco Wholesale Corporation (US:COST) , Microsoft Corporation (US:MSFT) , and ATI Inc. (US:ATI) . Bowen Hanes & Co Inc’s new positions include Carpenter Technology Corporation (US:CRS) , American International Group, Inc. (US:AIG) , ServiceNow, Inc. (US:NOW) , Brookfield Infrastructure Corporation (US:BIPC) , and .
Top Increases This Quarter
We use the change in the portfolio allocation because this is the most meaningful metric. Changes can be due to trades or changes in share prices.
| Security | Shares (MM) |
Value (MM$) |
Portfolio % | ΔPortfolio % |
|---|---|---|---|---|
| 0.25 | 73.13 | 1.8453 | 1.6470 | |
| 1.38 | 118.77 | 2.9967 | 1.0118 | |
| 0.97 | 154.02 | 3.8861 | 1.0102 | |
| 0.14 | 38.69 | 0.9763 | 0.9763 | |
| 0.18 | 97.74 | 2.4662 | 0.9639 | |
| 0.42 | 36.00 | 0.9083 | 0.9083 | |
| 0.11 | 152.07 | 3.8369 | 0.6565 | |
| 4.04 | 54.10 | 1.3650 | 0.5922 | |
| 0.24 | 120.22 | 3.0333 | 0.5340 | |
| 0.31 | 28.40 | 0.7165 | 0.3885 |
Top Decreases This Quarter
We use the change in the portfolio allocation because this is the most meaningful metric. Changes can be due to trades or changes in share prices.
| Security | Shares (MM) |
Value (MM$) |
Portfolio % | ΔPortfolio % |
|---|---|---|---|---|
| 0.00 | 0.51 | 0.0129 | -1.0943 | |
| 0.08 | 32.77 | 0.8269 | -0.9679 | |
| 0.14 | 29.63 | 0.7475 | -0.6836 | |
| 0.51 | 104.41 | 2.6345 | -0.4679 | |
| 0.13 | 99.97 | 2.5223 | -0.4197 | |
| 0.18 | 80.49 | 2.0309 | -0.3819 | |
| 0.13 | 31.65 | 0.7986 | -0.3740 | |
| 0.48 | 46.10 | 1.1631 | -0.3057 | |
| 0.39 | 62.68 | 1.5816 | -0.2785 | |
| 0.17 | 71.25 | 1.7977 | -0.2646 |
13F and Fund Filings
This form was filed on 2025-08-12 for the reporting period 2025-06-30. Click the link icon to see the full transaction history.
Upgrade to unlock premium data and export to Excel ![]() .
.
| Security | Type | Avg Share Price | Shares (MM) |
ΔShares (%) |
ΔShares (%) |
Value ($MM) |
Portfolio (%) |
ΔPortfolio (%) |
|
|---|---|---|---|---|---|---|---|---|---|
| NVDA / NVIDIA Corporation | 0.97 | 2.20 | 154.02 | 48.97 | 3.8861 | 1.0102 | |||
| NFLX / Netflix, Inc. | 0.11 | -7.38 | 152.07 | 33.01 | 3.8369 | 0.6565 | |||
| COST / Costco Wholesale Corporation | 0.13 | -0.81 | 125.20 | 3.82 | 3.1591 | -0.1956 | |||
| MSFT / Microsoft Corporation | 0.24 | 0.98 | 120.22 | 33.80 | 3.0333 | 0.5340 | |||
| ATI / ATI Inc. | 1.38 | 0.31 | 118.77 | 66.45 | 2.9967 | 1.0118 | |||
| AXP / American Express Company | 0.33 | 0.03 | 105.98 | 18.59 | 2.6739 | 0.1881 | |||
| AAPL / Apple Inc. | 0.51 | 1.36 | 104.41 | -6.38 | 2.6345 | -0.4679 | |||
| PANW / Palo Alto Networks, Inc. | 0.51 | 0.18 | 103.94 | 20.14 | 2.6226 | 0.2159 | |||
| ISRG / Intuitive Surgical, Inc. | 0.18 | -0.16 | 100.00 | 9.54 | 2.5231 | -0.0163 | |||
| LLY / Eli Lilly and Company | 0.13 | 0.14 | 99.97 | -5.48 | 2.5223 | -0.4197 | |||
| GEV / GE Vernova Inc. | 0.18 | 4.42 | 97.74 | 80.99 | 2.4662 | 0.9639 | |||
| TDY / Teledyne Technologies Incorporated | 0.18 | 0.31 | 94.75 | 3.25 | 2.3908 | -0.1621 | |||
| SPGI / S&P Global Inc. | 0.16 | 0.18 | 82.57 | 3.96 | 2.0834 | -0.1261 | |||
| JPM / JPMorgan Chase & Co. | 0.28 | 1.60 | 81.72 | 20.08 | 2.0620 | 0.1688 | |||
| VRTX / Vertex Pharmaceuticals Incorporated | 0.18 | 1.06 | 80.49 | -7.20 | 2.0309 | -0.3819 | |||
| GLW / Corning Incorporated | 1.49 | 2.46 | 78.58 | 17.70 | 1.9828 | 0.1255 | |||
| HD / The Home Depot, Inc. | 0.21 | 1.23 | 77.99 | 1.27 | 1.9678 | -0.1744 | |||
| AMZN / Amazon.com, Inc. | 0.35 | 1.45 | 77.57 | 16.99 | 1.9573 | 0.1127 | |||
| V / Visa Inc. | 0.21 | -0.03 | 76.09 | 1.28 | 1.9199 | -0.1699 | |||
| DE / Deere & Company | 0.15 | -0.24 | 74.58 | 8.08 | 1.8819 | -0.0378 | |||
| IBM / International Business Machines Corporation | 0.25 | 765.35 | 73.13 | 925.85 | 1.8453 | 1.6470 | |||
| MSI / Motorola Solutions, Inc. | 0.17 | 0.07 | 71.25 | -3.90 | 1.7977 | -0.2646 | |||
| ETN / Eaton Corporation plc | 0.20 | 1.69 | 70.60 | 33.55 | 1.7814 | 0.3108 | |||
| UNP / Union Pacific Corporation | 0.30 | 1.14 | 69.70 | -1.50 | 1.7588 | -0.2098 | |||
| TXN / Texas Instruments Incorporated | 0.33 | 0.19 | 67.72 | 15.76 | 1.7087 | 0.0813 | |||
| PH / Parker-Hannifin Corporation | 0.10 | 2.17 | 67.68 | 17.40 | 1.7077 | 0.1041 | |||
| TTEK / Tetra Tech, Inc. | 1.84 | -1.04 | 66.04 | 21.66 | 1.6662 | 0.1563 | |||
| BX / Blackstone Inc. | 0.44 | 0.07 | 65.24 | 7.09 | 1.6460 | -0.0486 | |||
| RSG / Republic Services, Inc. | 0.25 | 7.28 | 62.77 | 9.26 | 1.5838 | -0.0144 | |||
| PG / The Procter & Gamble Company | 0.39 | 0.27 | 62.68 | -6.26 | 1.5816 | -0.2785 | |||
| ADP / Automatic Data Processing, Inc. | 0.20 | -0.02 | 60.33 | 0.92 | 1.5223 | -0.1407 | |||
| BMI / Badger Meter, Inc. | 0.23 | 1.49 | 55.70 | 30.67 | 1.4054 | 0.2196 | |||
| WPM / Wheaton Precious Metals Corp. | 0.62 | 9.23 | 55.52 | 26.35 | 1.4009 | 0.1785 | |||
| FICO / Fair Isaac Corporation | 0.03 | 0.73 | 55.24 | -0.15 | 1.3938 | -0.1452 | |||
| RYCEY / Rolls-Royce Holdings plc - Depositary Receipt (Common Stock) | 4.04 | 42.77 | 54.10 | 94.73 | 1.3650 | 0.5922 | |||
| WELL / Welltower Inc. | 0.35 | 0.00 | 53.23 | 0.34 | 1.3432 | -0.1327 | |||
| GRMN / Garmin Ltd. | 0.23 | 0.27 | 47.09 | -3.62 | 1.1882 | -0.1709 | |||
| CHD / Church & Dwight Co., Inc. | 0.48 | 0.00 | 46.10 | -12.70 | 1.1631 | -0.3057 | |||
| BSX / Boston Scientific Corporation | 0.41 | 2.02 | 44.50 | 8.63 | 1.1228 | -0.0168 | |||
| HWKN / Hawkins, Inc. | 0.31 | 0.00 | 43.65 | 34.16 | 1.1013 | 0.1963 | |||
| TSLA / Tesla, Inc. | 0.13 | -21.98 | 41.64 | -4.37 | 1.0507 | -0.1606 | |||
| ASML / ASML Holding N.V. - Depositary Receipt (Common Stock) | 0.05 | 14.94 | 40.07 | 39.01 | 1.0110 | 0.2092 | |||
| CCJ / Cameco Corporation | 0.52 | -15.66 | 38.86 | 52.11 | 0.9804 | 0.2698 | |||
| CRS / Carpenter Technology Corporation | 0.14 | 38.69 | 0.9763 | 0.9763 | |||||
| AIG / American International Group, Inc. | 0.42 | 36.00 | 0.9083 | 0.9083 | |||||
| TMO / Thermo Fisher Scientific Inc. | 0.08 | -37.66 | 32.77 | -49.21 | 0.8269 | -0.9679 | |||
| SUN / Sunoco LP - Limited Partnership | 0.60 | 0.00 | 32.15 | -7.70 | 0.8113 | -0.1578 | |||
| TMUS / T-Mobile US, Inc. | 0.13 | -15.95 | 31.65 | -24.91 | 0.7986 | -0.3740 | |||
| EPD / Enterprise Products Partners L.P. - Limited Partnership | 1.02 | 0.00 | 31.57 | -9.17 | 0.7965 | -0.1703 | |||
| MMC / Marsh & McLennan Companies, Inc. | 0.14 | -35.73 | 29.63 | -42.42 | 0.7475 | -0.6836 | |||
| SCHW / The Charles Schwab Corporation | 0.31 | 106.64 | 28.40 | 140.86 | 0.7165 | 0.3885 | |||
| EQIX / Equinix, Inc. | 0.04 | 16.67 | 27.84 | 13.82 | 0.7025 | 0.0220 | |||
| WY / Weyerhaeuser Company | 1.03 | -0.46 | 26.49 | -12.67 | 0.6683 | -0.1754 | |||
| PLD / Prologis, Inc. | 0.25 | 3.81 | 26.04 | -2.38 | 0.6569 | -0.0850 | |||
| BIP / Brookfield Infrastructure Partners L.P. - Limited Partnership | 0.74 | 0.00 | 24.95 | 12.45 | 0.6295 | 0.0123 | |||
| BEP / Brookfield Renewable Partners L.P. - Limited Partnership | 0.78 | 0.00 | 19.92 | 15.12 | 0.5025 | 0.0212 | |||
| EXR / Extra Space Storage Inc. | 0.11 | 0.00 | 16.48 | -0.71 | 0.4157 | -0.0459 | |||
| SPH / Suburban Propane Partners, L.P. - Limited Partnership | 0.82 | 0.00 | 15.12 | -11.81 | 0.3815 | -0.0954 | |||
| MA / Mastercard Incorporated | 0.03 | 0.74 | 14.92 | 3.28 | 0.3764 | -0.0254 | |||
| MAA / Mid-America Apartment Communities, Inc. | 0.10 | 0.00 | 14.80 | -11.68 | 0.3735 | -0.0927 | |||
| NHI / National Health Investors, Inc. | 0.20 | 42.86 | 14.02 | 35.63 | 0.3538 | 0.0662 | |||
| ET / Energy Transfer LP - Limited Partnership | 0.70 | 0.00 | 12.69 | -2.47 | 0.3202 | -0.0418 | |||
| HON / Honeywell International Inc. | 0.05 | -0.96 | 12.05 | 8.92 | 0.3040 | -0.0037 | |||
| GOOG / Alphabet Inc. | 0.04 | 0.00 | 7.87 | 13.54 | 0.1985 | 0.0058 | |||
| XYL / Xylem Inc. | 0.06 | 0.00 | 7.38 | 8.29 | 0.1862 | -0.0034 | |||
| KKR / KKR & Co. Inc. | 0.05 | -41.49 | 6.61 | -32.67 | 0.1668 | -0.1063 | |||
| AVY / Avery Dennison Corporation | 0.04 | -26.12 | 6.26 | -27.16 | 0.1579 | -0.0811 | |||
| WM / Waste Management, Inc. | 0.03 | 0.00 | 6.05 | -1.16 | 0.1526 | -0.0176 | |||
| JNJ / Johnson & Johnson | 0.04 | -0.80 | 5.84 | -8.63 | 0.1474 | -0.0305 | |||
| MKC / McCormick & Company, Incorporated | 0.07 | -5.19 | 5.56 | -12.66 | 0.1402 | -0.0368 | |||
| WMT / Walmart Inc. | 0.06 | 0.00 | 5.50 | 11.38 | 0.1388 | 0.0014 | |||
| ZTS / Zoetis Inc. | 0.03 | -5.10 | 4.50 | -10.12 | 0.1134 | -0.0257 | |||
| CL / Colgate-Palmolive Company | 0.05 | 0.00 | 4.18 | -3.00 | 0.1054 | -0.0144 | |||
| ORCL / Oracle Corporation | 0.02 | 0.00 | 4.10 | 56.41 | 0.1035 | 0.0305 | |||
| LMT / Lockheed Martin Corporation | 0.01 | -0.51 | 4.06 | 3.15 | 0.1025 | -0.0071 | |||
| PEP / PepsiCo, Inc. | 0.03 | 1.05 | 4.03 | -11.02 | 0.1017 | -0.0243 | |||
| NOW / ServiceNow, Inc. | 0.00 | 3.88 | 0.0978 | 0.0978 | |||||
| LHX / L3Harris Technologies, Inc. | 0.02 | 0.00 | 3.77 | 19.87 | 0.0951 | 0.0076 | |||
| EMR / Emerson Electric Co. | 0.03 | -6.64 | 3.75 | 13.55 | 0.0945 | 0.0027 | |||
| CNI / Canadian National Railway Company | 0.04 | -9.79 | 3.75 | -3.68 | 0.0945 | -0.0137 | |||
| CNQ / Canadian Natural Resources Limited | 0.12 | -17.58 | 3.64 | -15.98 | 0.0919 | -0.0287 | |||
| CAT / Caterpillar Inc. | 0.01 | -65.43 | 3.41 | -59.30 | 0.0860 | -0.1471 | |||
| CP / Canadian Pacific Kansas City Limited | 0.04 | 17.66 | 3.22 | 32.85 | 0.0812 | 0.0138 | |||
| MAR / Marriott International, Inc. | 0.01 | -8.04 | 3.12 | 5.47 | 0.0788 | -0.0036 | |||
| NEE / NextEra Energy, Inc. | 0.04 | -7.49 | 3.05 | -9.40 | 0.0768 | -0.0167 | |||
| CSCO / Cisco Systems, Inc. | 0.04 | -0.18 | 2.95 | 12.23 | 0.0746 | 0.0013 | |||
| ABBV / AbbVie Inc. | 0.01 | 6.54 | 2.63 | -5.60 | 0.0664 | -0.0112 | |||
| CB / Chubb Limited | 0.01 | 0.83 | 2.46 | -3.26 | 0.0621 | -0.0087 | |||
| MCD / McDonald's Corporation | 0.01 | 0.00 | 2.28 | -6.47 | 0.0576 | -0.0103 | |||
| VMC / Vulcan Materials Company | 0.01 | 0.00 | 2.25 | 11.83 | 0.0568 | 0.0008 | |||
| TT / Trane Technologies plc | 0.01 | 0.00 | 2.25 | 29.83 | 0.0567 | 0.0085 | |||
| ROK / Rockwell Automation, Inc. | 0.01 | 0.00 | 2.24 | 28.56 | 0.0564 | 0.0080 | |||
| AWK / American Water Works Company, Inc. | 0.01 | 11.48 | 2.02 | 5.10 | 0.0510 | -0.0025 | |||
| KO / The Coca-Cola Company | 0.03 | 0.00 | 1.80 | -1.21 | 0.0454 | -0.0053 | |||
| GOOGL / Alphabet Inc. | 0.01 | 0.00 | 1.80 | 13.96 | 0.0453 | 0.0015 | |||
| VRT / Vertiv Holdings Co | 0.01 | 0.00 | 1.54 | 77.83 | 0.0389 | 0.0148 | |||
| GEHC / GE HealthCare Technologies Inc. | 0.02 | 0.00 | 1.36 | -8.24 | 0.0343 | -0.0069 | |||
| VZ / Verizon Communications Inc. | 0.03 | 0.00 | 1.33 | -4.65 | 0.0337 | -0.0052 | |||
| MDT / Medtronic plc | 0.01 | 0.00 | 1.28 | -2.96 | 0.0322 | -0.0044 | |||
| BEPC / Brookfield Renewable Corporation | 0.04 | 0.00 | 1.27 | 17.39 | 0.0320 | 0.0020 | |||
| KMB / Kimberly-Clark Corporation | 0.01 | 0.00 | 1.22 | -9.36 | 0.0308 | -0.0067 | |||
| CHKP / Check Point Software Technologies Ltd. | 0.01 | 0.00 | 1.21 | -2.98 | 0.0304 | -0.0041 | |||
| DIS / The Walt Disney Company | 0.01 | 0.00 | 1.12 | 25.59 | 0.0284 | 0.0035 | |||
| PFE / Pfizer Inc. | 0.05 | 0.00 | 1.12 | -4.36 | 0.0282 | -0.0043 | |||
| CVX / Chevron Corporation | 0.01 | -17.99 | 1.04 | -29.79 | 0.0263 | -0.0150 | |||
| FDX / FedEx Corporation | 0.00 | 0.00 | 0.94 | -6.77 | 0.0236 | -0.0043 | |||
| IP / International Paper Company | 0.02 | 0.00 | 0.91 | -12.20 | 0.0229 | -0.0059 | |||
| UPS / United Parcel Service, Inc. | 0.01 | -33.86 | 0.89 | -39.29 | 0.0224 | -0.0183 | |||
| BNS / The Bank of Nova Scotia | 0.01 | 0.00 | 0.79 | 16.57 | 0.0199 | 0.0011 | |||
| CMI / Cummins Inc. | 0.00 | 0.00 | 0.79 | 4.52 | 0.0198 | -0.0011 | |||
| RTX / RTX Corporation | 0.01 | 0.00 | 0.77 | 10.20 | 0.0194 | -0.0000 | |||
| TSM / Taiwan Semiconductor Manufacturing Company Limited - Depositary Receipt (Common Stock) | 0.00 | 0.00 | 0.75 | 36.45 | 0.0188 | 0.0036 | |||
| BA / The Boeing Company | 0.00 | 16.95 | 0.72 | 43.54 | 0.0182 | 0.0042 | |||
| LOW / Lowe's Companies, Inc. | 0.00 | 0.00 | 0.68 | -4.87 | 0.0173 | -0.0027 | |||
| DUK / Duke Energy Corporation | 0.01 | 0.00 | 0.65 | -3.25 | 0.0165 | -0.0023 | |||
| EFX / Equifax Inc. | 0.00 | 0.00 | 0.64 | 6.45 | 0.0163 | -0.0006 | |||
| STT / State Street Corporation | 0.01 | 0.00 | 0.64 | 18.89 | 0.0162 | 0.0012 | |||
| KMI / Kinder Morgan, Inc. | 0.02 | 21.29 | 0.62 | 25.05 | 0.0156 | 0.0018 | |||
| SNA / Snap-on Incorporated | 0.00 | 0.00 | 0.58 | -7.78 | 0.0147 | -0.0028 | |||
| MCK / McKesson Corporation | 0.00 | 0.52 | 0.0130 | 0.0130 | |||||
| NDSN / Nordson Corporation | 0.00 | -98.79 | 0.51 | -98.72 | 0.0129 | -1.0943 | |||
| COF / Capital One Financial Corporation | 0.00 | 0.00 | 0.46 | 18.77 | 0.0117 | 0.0008 | |||
| NSC / Norfolk Southern Corporation | 0.00 | 0.00 | 0.42 | 8.07 | 0.0105 | -0.0002 | |||
| RHHBY / Roche Holding AG - Depositary Receipt (Common Stock) | 0.01 | 0.00 | 0.39 | -0.77 | 0.0098 | -0.0011 | |||
| MMM / 3M Company | 0.00 | 0.00 | 0.38 | 3.55 | 0.0096 | -0.0006 | |||
| AON / Aon plc | 0.00 | 0.00 | 0.37 | -10.65 | 0.0093 | -0.0022 | |||
| FMC / FMC Corporation | 0.01 | -29.20 | 0.37 | -29.90 | 0.0093 | -0.0053 | |||
| ABT / Abbott Laboratories | 0.00 | 0.00 | 0.37 | 2.51 | 0.0093 | -0.0007 | |||
| GNRC / Generac Holdings Inc. | 0.00 | 0.00 | 0.36 | 12.85 | 0.0091 | 0.0002 | |||
| XOM / Exxon Mobil Corporation | 0.00 | 0.00 | 0.36 | -9.41 | 0.0090 | -0.0019 | |||
| CRM / Salesforce, Inc. | 0.00 | -81.61 | 0.33 | -81.32 | 0.0083 | -0.0405 | |||
| ACN / Accenture plc | 0.00 | -79.99 | 0.32 | -80.86 | 0.0081 | -0.0386 | |||
| ADSK / Autodesk, Inc. | 0.00 | 0.00 | 0.31 | 18.39 | 0.0078 | 0.0005 | |||
| DD / DuPont de Nemours, Inc. | 0.00 | -2.17 | 0.31 | -10.20 | 0.0078 | -0.0018 | |||
| IR / Ingersoll Rand Inc. | 0.00 | 0.00 | 0.31 | 4.05 | 0.0078 | -0.0005 | |||
| MDLZ / Mondelez International, Inc. | 0.00 | 0.00 | 0.30 | -0.66 | 0.0076 | -0.0008 | |||
| MFC / Manulife Financial Corporation | 0.01 | 0.00 | 0.29 | 2.80 | 0.0074 | -0.0006 | |||
| SONY / Sony Group Corporation - Depositary Receipt (Common Stock) | 0.01 | 0.00 | 0.28 | 2.58 | 0.0070 | -0.0005 | |||
| C.WS.B / Citigroup Inc. | 0.00 | 0.00 | 0.27 | 20.18 | 0.0069 | 0.0006 | |||
| NICE / NICE Ltd. - Depositary Receipt (Common Stock) | 0.00 | 0.00 | 0.24 | 9.77 | 0.0060 | -0.0000 | |||
| PNC / The PNC Financial Services Group, Inc. | 0.00 | 0.00 | 0.23 | 6.05 | 0.0058 | -0.0002 | |||
| INTU / Intuit Inc. | 0.00 | 0.23 | 0.0057 | 0.0057 | |||||
| NEM / Newmont Corporation | 0.00 | 0.22 | 0.0054 | 0.0054 | |||||
| WAB / Westinghouse Air Brake Technologies Corporation | 0.00 | 0.21 | 0.0053 | 0.0053 | |||||
| BIPC / Brookfield Infrastructure Corporation | 0.00 | 0.20 | 0.0000 | ||||||
| REGN / Regeneron Pharmaceuticals, Inc. | 0.00 | -100.00 | 0.00 | 0.0000 | |||||
| IRM / Iron Mountain Incorporated | 0.00 | -100.00 | 0.00 | 0.0000 | |||||
| ULS / UL Solutions Inc. | 0.00 | -100.00 | 0.00 | 0.0000 | |||||
| ADBE / Adobe Inc. | 0.00 | -100.00 | 0.00 | -100.00 | -0.0656 | ||||
| FI / Fiserv, Inc. | 0.00 | -100.00 | 0.00 | 0.0000 | |||||
| APD / Air Products and Chemicals, Inc. | 0.00 | -100.00 | 0.00 | 0.0000 | |||||
| OMC / Omnicom Group Inc. | 0.00 | -100.00 | 0.00 | 0.0000 | |||||
| PSTG / Pure Storage, Inc. | 0.00 | -100.00 | 0.00 | 0.0000 | |||||
| BDX / Becton, Dickinson and Company | 0.00 | -100.00 | 0.00 | 0.0000 | |||||
| CCI / Crown Castle Inc. | 0.00 | -100.00 | 0.00 | 0.0000 |