Basic Stats
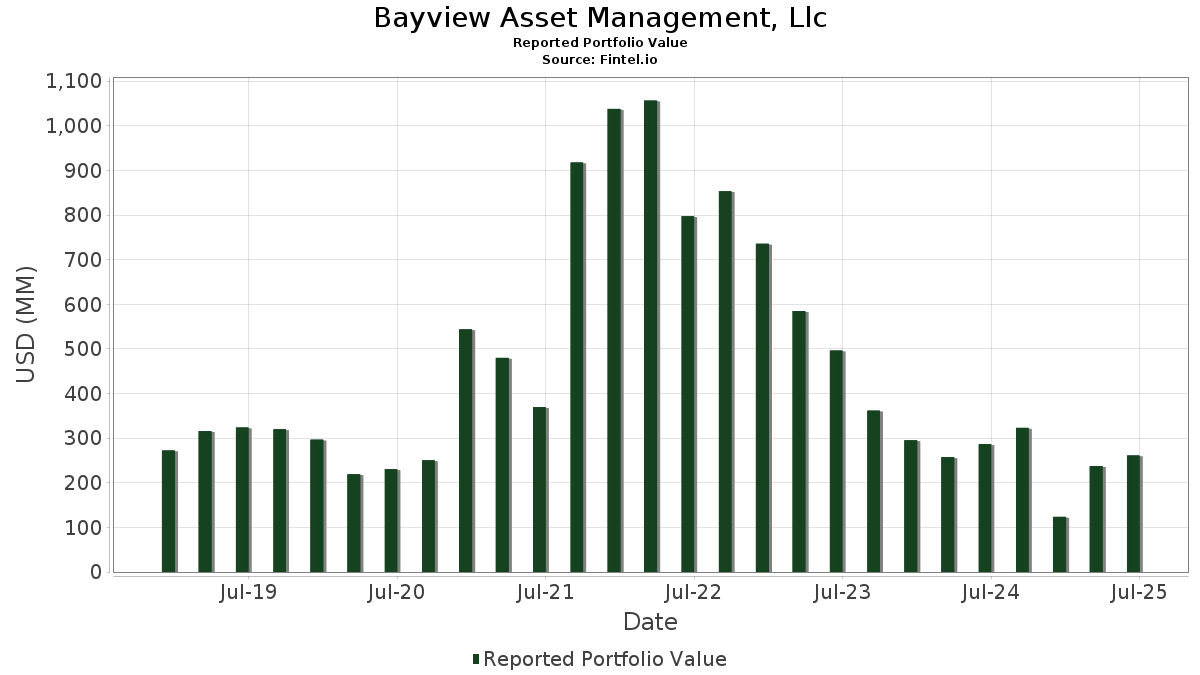
| Portfolio Value | $ 261,190,343 |
| Current Positions | 57 |
Latest Holdings, Performance, AUM (from 13F, 13D)
Bayview Asset Management, Llc has disclosed 57 total holdings in their latest SEC filings. Most recent portfolio value is calculated to be $ 261,190,343 USD. Actual Assets Under Management (AUM) is this value plus cash (which is not disclosed). Bayview Asset Management, Llc’s top holdings are SPDR S&P 500 ETF (US:SPY) , Guild Holdings Company (US:GHLD) , Banc of California, Inc. (US:BANC) , Berkshire Hills Bancorp, Inc. (US:BHLB) , and SPDR Series Trust - SPDR S&P Regional Banking ETF (US:KRE) . Bayview Asset Management, Llc’s new positions include The Travelers Companies, Inc. (US:TRV) , The Hartford Insurance Group, Inc. (US:HIG) , Annaly Capital Management, Inc. (US:NLY) , Zions Bancorporation, National Association (US:ZION) , and The Allstate Corporation (US:ALL) . Bayview Asset Management, Llc’s top industries are "Real Estate" (sic 65) , "Holding And Other Investment Offices" (sic 67) , and "Non-depository Credit Institutions" (sic 61) .
Top Increases This Quarter
We use the change in the portfolio allocation because this is the most meaningful metric. Changes can be due to trades or changes in share prices.
| Security | Shares (MM) |
Value (MM$) |
Portfolio % | ΔPortfolio % |
|---|---|---|---|---|
| 1.60 | 31.55 | 12.0793 | 1.7987 | |
| 0.04 | 4.10 | 1.5697 | 1.5697 | |
| 0.04 | 3.23 | 1.2383 | 1.2383 | |
| 0.02 | 5.80 | 2.2199 | 1.1871 | |
| 0.01 | 2.68 | 1.0243 | 1.0243 | |
| 0.02 | 2.54 | 0.9715 | 0.9715 | |
| 0.12 | 2.35 | 0.9007 | 0.9007 | |
| 0.05 | 2.26 | 0.8662 | 0.8662 | |
| 0.05 | 2.26 | 0.8662 | 0.8662 | |
| 0.05 | 2.15 | 0.8230 | 0.8230 |
Top Decreases This Quarter
We use the change in the portfolio allocation because this is the most meaningful metric. Changes can be due to trades or changes in share prices.
| Security | Shares (MM) |
Value (MM$) |
Portfolio % | ΔPortfolio % |
|---|---|---|---|---|
| 0.16 | 100.22 | 38.3687 | -2.3782 | |
| 0.02 | 1.82 | 0.6956 | -1.3850 | |
| 0.12 | 7.42 | 2.8423 | -1.3466 | |
| 0.00 | 0.00 | -0.6908 | ||
| 0.99 | 13.95 | 5.3423 | -0.5914 | |
| 0.00 | 0.00 | -0.5219 | ||
| 0.34 | 8.63 | 3.3058 | -0.4822 | |
| 0.00 | 0.31 | 0.1201 | -0.4087 | |
| 0.01 | 1.27 | 0.4854 | -0.3578 | |
| 0.00 | 0.63 | 0.2414 | -0.3148 |
13D/G Filings
This is a list of 13D and 13G filings made in the last year (if any). Click the link icon to see the full transaction history. Green rows indicate new positions. Red rows indicate closed positions.
| File Date | Form | Security | Prev Shares |
Current Shares |
ΔShares % | % Ownership |
% ΔOwnership | |
|---|---|---|---|---|---|---|---|---|
| 2025-01-14 | GHLD / Guild Holdings Company | 1,226,873 | 1,500,517 | 22.30 | 7.10 | 20.34 |
13F and Fund Filings
This form was filed on 2025-08-13 for the reporting period 2025-06-30. Click the link icon to see the full transaction history.
Upgrade to unlock premium data and export to Excel ![]() .
.
| Security | Type | Avg Share Price | Shares (MM) |
ΔShares (%) |
ΔShares (%) |
Value ($MM) |
Portfolio (%) |
ΔPortfolio (%) |
|
|---|---|---|---|---|---|---|---|---|---|
| SPY / SPDR S&P 500 ETF | Put | 0.16 | -6.24 | 100.22 | 3.56 | 38.3687 | -2.3782 | ||
| GHLD / Guild Holdings Company | 1.60 | 0.00 | 31.55 | 29.21 | 12.0793 | 1.7987 | |||
| BANC / Banc of California, Inc. | 0.99 | 0.00 | 13.95 | -0.99 | 5.3423 | -0.5914 | |||
| BHLB / Berkshire Hills Bancorp, Inc. | 0.34 | 0.00 | 8.63 | -4.02 | 3.3058 | -0.4822 | |||
| KRE / SPDR Series Trust - SPDR S&P Regional Banking ETF | Put | 0.12 | -28.57 | 7.42 | -25.38 | 2.8423 | -1.3466 | ||
| JPM / JPMorgan Chase & Co. | Put | 0.02 | 100.00 | 5.80 | 136.36 | 2.2199 | 1.1871 | ||
| KRE / SPDR Series Trust - SPDR S&P Regional Banking ETF | Call | 0.07 | 50.00 | 4.45 | 56.72 | 1.7054 | 0.5085 | ||
| BK / The Bank of New York Mellon Corporation | Put | 0.04 | 4.10 | 1.5697 | 1.5697 | ||||
| BAC / Bank of America Corporation | Put | 0.07 | 87.50 | 3.55 | 112.64 | 1.3588 | 0.6560 | ||
| BK / The Bank of New York Mellon Corporation | 0.04 | 3.23 | 1.2383 | 1.2383 | |||||
| PNC / The PNC Financial Services Group, Inc. | Put | 0.01 | 0.00 | 2.80 | 6.07 | 1.0706 | -0.0395 | ||
| TRV / The Travelers Companies, Inc. | Put | 0.01 | 2.68 | 1.0243 | 1.0243 | ||||
| STT / State Street Corporation | Put | 0.03 | 0.00 | 2.66 | 18.77 | 1.0178 | 0.0754 | ||
| JPM / JPMorgan Chase & Co. | 0.01 | -0.63 | 2.61 | 17.47 | 0.9990 | 0.0635 | |||
| C / Citigroup Inc. | Put | 0.03 | 0.00 | 2.55 | 19.92 | 0.9777 | 0.0810 | ||
| HIG / The Hartford Insurance Group, Inc. | Call | 0.02 | 2.54 | 0.9715 | 0.9715 | ||||
| NTRS / Northern Trust Corporation | Put | 0.02 | -33.33 | 2.54 | -14.33 | 0.9709 | -0.2752 | ||
| NLY / Annaly Capital Management, Inc. | Put | 0.12 | 2.35 | 0.9007 | 0.9007 | ||||
| RF / Regions Financial Corporation | Put | 0.10 | 0.00 | 2.35 | 8.24 | 0.9005 | -0.0144 | ||
| SCHW / The Charles Schwab Corporation | Put | 0.03 | 25.00 | 2.28 | 45.75 | 0.8733 | 0.2141 | ||
| USB / U.S. Bancorp | Put | 0.05 | 2.26 | 0.8662 | 0.8662 | ||||
| USB / U.S. Bancorp | 0.05 | 2.26 | 0.8662 | 0.8662 | |||||
| FISI / Financial Institutions, Inc. | 0.09 | 9.36 | 2.25 | 12.56 | 0.8611 | 0.0195 | |||
| PNC / The PNC Financial Services Group, Inc. | 0.01 | -20.00 | 2.24 | -15.14 | 0.8565 | -0.2536 | |||
| TFC / Truist Financial Corporation | Put | 0.05 | 2.15 | 0.8230 | 0.8230 | ||||
| ZION / Zions Bancorporation, National Association | Put | 0.04 | 2.08 | 0.7954 | 0.7954 | ||||
| ALL / The Allstate Corporation | Call | 0.01 | 2.01 | 0.7707 | 0.7707 | ||||
| BAC / Bank of America Corporation | 0.04 | 15.49 | 2.01 | 31.01 | 0.7700 | 0.1234 | |||
| RF / Regions Financial Corporation | 0.08 | -16.00 | 1.98 | -9.11 | 0.7564 | -0.1585 | |||
| STT / State Street Corporation | 0.02 | -8.75 | 1.94 | 8.38 | 0.7430 | -0.0109 | |||
| ITB / iShares Trust - iShares U.S. Home Construction ETF | Call | 0.02 | -62.43 | 1.82 | -63.25 | 0.6956 | -1.3850 | ||
| TRV / The Travelers Companies, Inc. | 0.01 | 1.79 | 0.6863 | 0.6863 | |||||
| NLY / Annaly Capital Management, Inc. | 0.10 | 1.79 | 0.6845 | 0.6845 | |||||
| FLG / Flagstar Financial, Inc. | 0.17 | 0.00 | 1.77 | -8.78 | 0.6764 | -0.1390 | |||
| WSBC / WesBanco, Inc. | 0.05 | 343.02 | 1.71 | 353.05 | 0.6539 | 0.4950 | |||
| IYR / iShares Trust - iShares U.S. Real Estate ETF | Put | 0.02 | 1.71 | 0.6531 | 0.6531 | ||||
| C / Citigroup Inc. | 0.02 | -32.20 | 1.70 | -18.72 | 0.6518 | -0.2300 | |||
| BPOP / Popular, Inc. | 0.01 | 13.23 | 1.58 | 35.05 | 0.6037 | 0.1123 | |||
| SCHW / The Charles Schwab Corporation | 0.02 | 64.19 | 1.57 | 91.36 | 0.6026 | 0.2563 | |||
| REM / iShares Trust - iShares Mortgage Real Estate ETF | Put | 0.07 | 1.53 | 0.5853 | 0.5853 | ||||
| BUSE / First Busey Corporation | 0.06 | 173.87 | 1.47 | 190.53 | 0.5641 | 0.3503 | |||
| BKU / BankUnited, Inc. | 0.04 | 45.45 | 1.42 | 50.26 | 0.5450 | 0.1463 | |||
| NTRS / Northern Trust Corporation | 0.01 | -50.74 | 1.27 | -36.71 | 0.4854 | -0.3578 | |||
| TFC / Truist Financial Corporation | 0.03 | 1.18 | 0.4526 | 0.4526 | |||||
| FAF / First American Financial Corporation | 0.02 | 14.34 | 1.18 | 6.90 | 0.4510 | -0.0127 | |||
| ZION / Zions Bancorporation, National Association | 0.02 | 1.04 | 0.3977 | 0.3977 | |||||
| ONB / Old National Bancorp | 0.05 | 0.00 | 1.00 | 0.71 | 0.3814 | -0.0351 | |||
| TMHC / Taylor Morrison Home Corporation | 0.02 | 0.00 | 0.99 | 2.38 | 0.3783 | -0.0284 | |||
| RITM / Rithm Capital Corp. | 0.09 | 0.00 | 0.99 | -1.40 | 0.3782 | -0.0436 | |||
| PHM / PulteGroup, Inc. | 0.01 | -34.70 | 0.98 | -33.04 | 0.3767 | -0.2417 | |||
| ESNT / Essent Group Ltd. | 0.01 | 0.00 | 0.75 | 5.22 | 0.2860 | -0.0129 | |||
| DHI / D.R. Horton, Inc. | 0.00 | -52.94 | 0.63 | -52.27 | 0.2414 | -0.3148 | |||
| UMBF / UMB Financial Corporation | 0.01 | 0.58 | 0.2214 | 0.2214 | |||||
| GL / Globe Life Inc. | 0.00 | -40.00 | 0.37 | -43.47 | 0.1428 | -0.1345 | |||
| FNB / F.N.B. Corporation | 0.03 | 0.36 | 0.1396 | 0.1396 | |||||
| JLL / Jones Lang LaSalle Incorporated | 0.00 | -75.80 | 0.31 | -75.06 | 0.1201 | -0.4087 | |||
| MTH / Meritage Homes Corporation | 0.00 | 0.00 | 0.26 | -5.80 | 0.0999 | -0.0164 | |||
| FAF / First American Financial Corporation | Put | 0.00 | -100.00 | 0.00 | -100.00 | -0.6908 | |||
| HBAN / Huntington Bancshares Incorporated | 0.00 | -100.00 | 0.00 | 0.0000 | |||||
| WBS / Webster Financial Corporation | 0.00 | -100.00 | 0.00 | 0.0000 | |||||
| JLL / Jones Lang LaSalle Incorporated | Put | 0.00 | -100.00 | 0.00 | -100.00 | -0.5219 | |||
| SPGI / S&P Global Inc. | 0.00 | -100.00 | 0.00 | 0.0000 | |||||
| MA / Mastercard Incorporated | 0.00 | -100.00 | 0.00 | 0.0000 | |||||
| V / Visa Inc. | 0.00 | -100.00 | 0.00 | 0.0000 | |||||
| HBAN / Huntington Bancshares Incorporated | Put | 0.00 | -100.00 | 0.00 | 0.0000 | ||||
| AVB / AvalonBay Communities, Inc. | 0.00 | -100.00 | 0.00 | 0.0000 | |||||
| WBS / Webster Financial Corporation | Put | 0.00 | -100.00 | 0.00 | 0.0000 | ||||
| XLF / The Select Sector SPDR Trust - The Financial Select Sector SPDR Fund | Put | 0.00 | -100.00 | 0.00 | 0.0000 | ||||
| AVB / AvalonBay Communities, Inc. | Put | 0.00 | -100.00 | 0.00 | 0.0000 | ||||
| SPGI / S&P Global Inc. | Put | 0.00 | -100.00 | 0.00 | 0.0000 | ||||
| V / Visa Inc. | Put | 0.00 | -100.00 | 0.00 | 0.0000 | ||||
| MA / Mastercard Incorporated | Put | 0.00 | -100.00 | 0.00 | 0.0000 |