Basic Stats
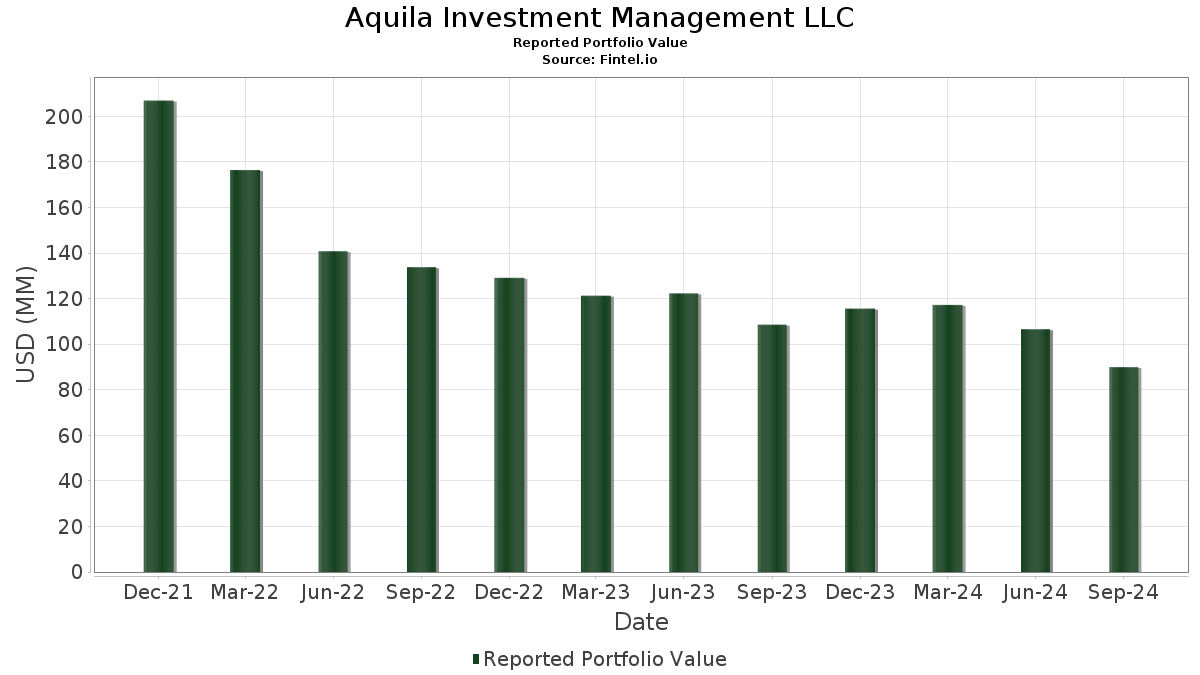
| Portfolio Value | $ 89,911,640 |
| Current Positions | 63 |
Latest Holdings, Performance, AUM (from 13F, 13D)
Aquila Investment Management LLC has disclosed 63 total holdings in their latest SEC filings. Most recent portfolio value is calculated to be $ 89,911,640 USD. Actual Assets Under Management (AUM) is this value plus cash (which is not disclosed). Aquila Investment Management LLC’s top holdings are Micron Technology, Inc. (US:MU) , ZoomInfo Technologies Inc. (US:ZI) , Arista Networks Inc (US:ANET) , Coherent Corp. (US:COHR) , and Arm Holdings plc - Depositary Receipt (Common Stock) (US:ARM) . Aquila Investment Management LLC’s new positions include Extreme Networks, Inc. (US:EXTR) , PACCAR Inc (US:PCAR) , Consolidated Edison, Inc. (US:ED) , Vulcan Materials Company (US:VMC) , and Fifth Third Bancorp (US:FITB) .
Top Increases This Quarter
We use the change in the portfolio allocation because this is the most meaningful metric. Changes can be due to trades or changes in share prices.
| Security | Shares (MM) |
Value (MM$) |
Portfolio % | ΔPortfolio % |
|---|---|---|---|---|
| 0.04 | 3.47 | 3.8566 | 1.2046 | |
| 0.03 | 3.26 | 3.6261 | 1.1772 | |
| 0.04 | 2.99 | 3.3295 | 1.0847 | |
| 0.06 | 0.96 | 1.0699 | 1.0699 | |
| 0.07 | 3.10 | 3.4458 | 1.0015 | |
| 0.01 | 3.84 | 4.2689 | 0.9798 | |
| 0.03 | 2.69 | 2.9952 | 0.9336 | |
| 0.01 | 2.05 | 2.2786 | 0.8423 | |
| 0.02 | 2.37 | 2.6388 | 0.8051 | |
| 0.07 | 2.33 | 2.5933 | 0.7119 |
Top Decreases This Quarter
We use the change in the portfolio allocation because this is the most meaningful metric. Changes can be due to trades or changes in share prices.
| Security | Shares (MM) |
Value (MM$) |
Portfolio % | ΔPortfolio % |
|---|---|---|---|---|
| 0.01 | 1.00 | 1.1150 | -0.9364 | |
| 0.45 | 1.22 | 1.3513 | -0.7864 | |
| 0.03 | 0.36 | 0.3976 | -0.4460 | |
| 0.02 | 1.92 | 2.1370 | -0.3560 | |
| 0.00 | 0.00 | -0.3343 | ||
| 0.04 | 4.15 | 4.6139 | -0.3234 | |
| 0.00 | 0.39 | 0.4312 | -0.2215 | |
| 0.40 | 4.13 | 4.5912 | -0.2024 | |
| 0.05 | 0.53 | 0.5872 | -0.0012 |
13F and Fund Filings
This form was filed on 2024-10-22 for the reporting period 2024-09-30. Click the link icon to see the full transaction history.
Upgrade to unlock premium data and export to Excel ![]() .
.
| Security | Type | Avg Share Price | Shares (MM) |
ΔShares (%) |
ΔShares (%) |
Value ($MM) |
Portfolio (%) |
ΔPortfolio (%) |
|
|---|---|---|---|---|---|---|---|---|---|
| MU / Micron Technology, Inc. | 0.04 | 0.00 | 4.15 | -21.16 | 4.6139 | -0.3234 | |||
| ZI / ZoomInfo Technologies Inc. | 0.40 | 0.00 | 4.13 | -19.19 | 4.5912 | -0.2024 | |||
| ANET / Arista Networks Inc | 0.01 | 0.00 | 3.84 | 9.53 | 4.2689 | 0.9798 | |||
| COHR / Coherent Corp. | 0.04 | 0.00 | 3.47 | 22.73 | 3.8566 | 1.2046 | |||
| ARM / Arm Holdings plc - Depositary Receipt (Common Stock) | 0.02 | 14.29 | 3.43 | -0.12 | 3.8173 | 0.5929 | |||
| ILMN / Illumina, Inc. | 0.03 | 0.00 | 3.26 | 24.95 | 3.6261 | 1.1772 | |||
| RBLX / Roblox Corporation | 0.07 | 0.00 | 3.10 | 18.97 | 3.4458 | 1.0015 | |||
| ESTC / Elastic N.V. | 0.04 | 85.71 | 2.99 | 25.13 | 3.3295 | 1.0847 | |||
| DXCM / DexCom, Inc. | 0.04 | 50.00 | 2.82 | -11.31 | 3.1316 | 0.1524 | |||
| WEC / WEC Energy Group, Inc. | 0.03 | 0.00 | 2.69 | 22.63 | 2.9952 | 0.9336 | |||
| MET / MetLife, Inc. | 0.03 | -25.00 | 2.47 | -11.86 | 2.7520 | 0.1173 | |||
| TTWO / Take-Two Interactive Software, Inc. | 0.02 | 0.00 | 2.46 | -1.13 | 2.7353 | 0.4006 | |||
| CDNS / Cadence Design Systems, Inc. | 0.01 | 0.00 | 2.44 | -11.92 | 2.7130 | 0.1137 | |||
| CCI / Crown Castle Inc. | 0.02 | 0.00 | 2.37 | 21.39 | 2.6388 | 0.8051 | |||
| VICI / VICI Properties Inc. | 0.07 | 0.00 | 2.33 | 16.32 | 2.5933 | 0.7119 | |||
| CBOE / Cboe Global Markets, Inc. | 0.01 | 11.11 | 2.05 | 33.86 | 2.2786 | 0.8423 | |||
| WDAY / Workday, Inc. | 0.01 | 0.00 | 1.96 | 9.34 | 2.1747 | 0.4963 | |||
| ALSN / Allison Transmission Holdings, Inc. | 0.02 | -42.86 | 1.92 | -27.67 | 2.1370 | -0.3560 | |||
| IQV / IQVIA Holdings Inc. | 0.01 | 0.00 | 1.90 | 12.06 | 2.1085 | 0.5211 | |||
| VLO / Valero Energy Corporation | 0.01 | 0.00 | 1.89 | -13.86 | 2.1025 | 0.0430 | |||
| CZR / Caesars Entertainment, Inc. | 0.04 | 0.00 | 1.88 | 5.03 | 2.0891 | 0.4108 | |||
| PWR / Quanta Services, Inc. | 0.01 | 0.00 | 1.79 | 17.32 | 1.9896 | 0.5589 | |||
| GOLD / Barrick Mining Corporation | 0.08 | 0.00 | 1.59 | 19.27 | 1.7697 | 0.5175 | |||
| FANG / Diamondback Energy, Inc. | 0.01 | 0.00 | 1.55 | -13.88 | 1.7257 | 0.0349 | |||
| SNPS / Synopsys, Inc. | 0.00 | 0.00 | 1.52 | -14.90 | 1.6896 | 0.0143 | |||
| FHN / First Horizon Corporation | 0.09 | 28.57 | 1.40 | 26.65 | 1.5545 | 0.5186 | |||
| AMT / American Tower Corporation | 0.01 | 0.00 | 1.40 | 19.64 | 1.5519 | 0.4574 | |||
| ROK / Rockwell Automation, Inc. | 0.01 | 0.00 | 1.34 | -2.47 | 1.4929 | 0.2012 | |||
| CME / CME Group Inc. | 0.01 | 0.00 | 1.32 | 12.21 | 1.4724 | 0.3655 | |||
| PSX / Phillips 66 | 0.01 | 0.00 | 1.31 | -6.87 | 1.4620 | 0.1372 | |||
| KHC / The Kraft Heinz Company | 0.04 | 0.00 | 1.26 | 8.97 | 1.4058 | 0.3173 | |||
| LAC / Lithium Americas Corp. | 0.45 | -47.06 | 1.22 | -46.66 | 1.3513 | -0.7864 | |||
| IRM / Iron Mountain Incorporated | 0.01 | 0.00 | 1.19 | 32.59 | 1.3216 | 0.4806 | |||
| AVAV / AeroVironment, Inc. | 0.01 | -58.33 | 1.00 | -54.14 | 1.1150 | -0.9364 | |||
| EXTR / Extreme Networks, Inc. | 0.06 | 0.96 | 1.0699 | 1.0699 | |||||
| BMRN / BioMarin Pharmaceutical Inc. | 0.01 | 0.00 | 0.91 | -14.67 | 1.0163 | 0.0119 | |||
| XYL / Xylem Inc. | 0.01 | 0.00 | 0.81 | -0.37 | 0.9011 | 0.1374 | |||
| HBAN / Huntington Bancshares Incorporated | 0.05 | 0.00 | 0.78 | 11.60 | 0.8665 | 0.2110 | |||
| ALB / Albemarle Corporation | 0.01 | 0.00 | 0.76 | -0.92 | 0.8427 | 0.1256 | |||
| STLD / Steel Dynamics, Inc. | 0.01 | 0.00 | 0.76 | -2.70 | 0.8414 | 0.1122 | |||
| WMB / The Williams Companies, Inc. | 0.01 | 0.00 | 0.68 | 7.38 | 0.7616 | 0.1633 | |||
| BK / The Bank of New York Mellon Corporation | 0.01 | 0.00 | 0.65 | 19.85 | 0.7193 | 0.2135 | |||
| PCAR / PACCAR Inc | 0.01 | 0.59 | 0.6585 | 0.6585 | |||||
| F / Ford Motor Company | 0.05 | 0.00 | 0.53 | -15.79 | 0.5872 | -0.0012 | |||
| ED / Consolidated Edison, Inc. | 0.01 | 0.52 | 0.5791 | 0.5791 | |||||
| VMC / Vulcan Materials Company | 0.00 | 0.50 | 0.5571 | 0.5571 | |||||
| LYB / LyondellBasell Industries N.V. | 0.01 | 0.00 | 0.48 | 0.21 | 0.5333 | 0.0844 | |||
| EXC / Exelon Corporation | 0.01 | 0.45 | 0.4961 | 0.4961 | |||||
| STT / State Street Corporation | 0.01 | 0.00 | 0.44 | 19.46 | 0.4920 | 0.1448 | |||
| FITB / Fifth Third Bancorp | 0.01 | 0.43 | 0.4765 | 0.4765 | |||||
| BBY / Best Buy Co., Inc. | 0.00 | 0.00 | 0.41 | 22.55 | 0.4596 | 0.1432 | |||
| ETR / Entergy Corporation | 0.00 | 0.39 | 0.4391 | 0.4391 | |||||
| BIIB / Biogen Inc. | 0.00 | -33.33 | 0.39 | -44.32 | 0.4312 | -0.2215 | |||
| DTE / DTE Energy Company | 0.00 | 0.39 | 0.4285 | 0.4285 | |||||
| NTRS / Northern Trust Corporation | 0.00 | 0.36 | 0.4005 | 0.4005 | |||||
| SVCO / Silvaco Group, Inc. | 0.03 | -50.00 | 0.36 | -60.29 | 0.3976 | -0.4460 | |||
| FE / FirstEnergy Corp. | 0.01 | 0.35 | 0.3946 | 0.3946 | |||||
| CMS / CMS Energy Corporation | 0.01 | 0.35 | 0.3928 | 0.3928 | |||||
| D / Dominion Energy, Inc. | 0.01 | 0.35 | 0.3856 | 0.3856 | |||||
| CPB / The Campbell's Company | 0.01 | 0.00 | 0.34 | 8.23 | 0.3809 | 0.0840 | |||
| MRO / Marathon Oil Corporation | 0.01 | 0.00 | 0.27 | -6.99 | 0.2962 | 0.0271 | |||
| ACHR / Archer Aviation Inc. | 0.04 | 0.00 | 0.13 | -13.64 | 0.1483 | 0.0029 | |||
| IONQ / IonQ, Inc. | 0.01 | 0.00 | 0.13 | 24.76 | 0.1458 | 0.0469 | |||
| RSG / Republic Services, Inc. | 0.00 | -100.00 | 0.00 | 0.0000 | |||||
| ZS / Zscaler, Inc. | 0.00 | -100.00 | 0.00 | 0.0000 | |||||
| AMBA / Ambarella, Inc. | 0.00 | -100.00 | 0.00 | 0.0000 | |||||
| OXY / Occidental Petroleum Corporation | 0.00 | -100.00 | 0.00 | 0.0000 | |||||
| MCK / McKesson Corporation | 0.00 | -100.00 | 0.00 | 0.0000 | |||||
| DKS / DICK'S Sporting Goods, Inc. | 0.00 | -100.00 | 0.00 | 0.0000 | |||||
| MRNA / Moderna, Inc. | 0.00 | -100.00 | 0.00 | -100.00 | -0.3343 | ||||
| VRSK / Verisk Analytics, Inc. | 0.00 | -100.00 | 0.00 | 0.0000 | |||||
| K / Kellanova | 0.00 | -100.00 | 0.00 | 0.0000 | |||||
| LPLA / LPL Financial Holdings Inc. | 0.00 | -100.00 | 0.00 | 0.0000 | |||||
| ARE / Alexandria Real Estate Equities, Inc. | 0.00 | -100.00 | 0.00 | 0.0000 | |||||
| MLM / Martin Marietta Materials, Inc. | 0.00 | -100.00 | 0.00 | 0.0000 | |||||
| PEG / Public Service Enterprise Group Incorporated | 0.00 | -100.00 | 0.00 | 0.0000 |