Basic Stats
| Insider Profile | ACR Alpine Capital Research, LLC |
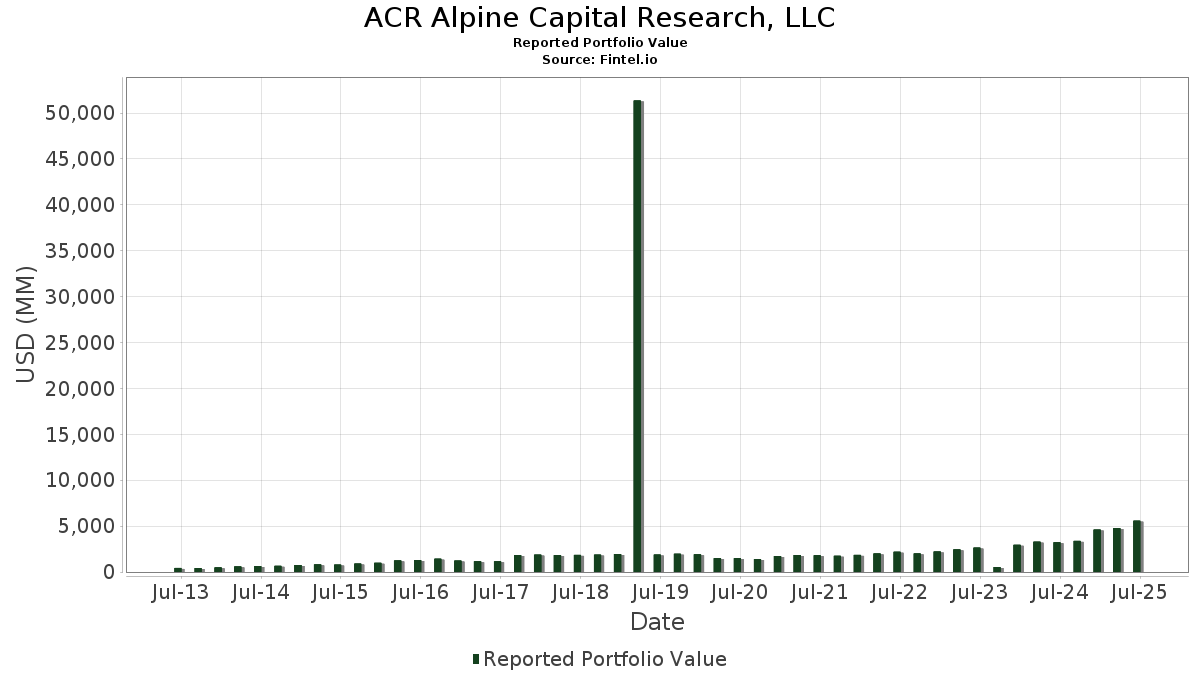
| Portfolio Value | $ 5,585,570,953 |
| Current Positions | 36 |
Latest Holdings, Performance, AUM (from 13F, 13D)
ACR Alpine Capital Research, LLC has disclosed 36 total holdings in their latest SEC filings. Most recent portfolio value is calculated to be $ 5,585,570,953 USD. Actual Assets Under Management (AUM) is this value plus cash (which is not disclosed). ACR Alpine Capital Research, LLC’s top holdings are Goldman Sachs ETF Trust - Goldman Sachs Access Treasury 0-1 Year ETF (US:GBIL) , Citigroup Inc. (US:C) , Dollar General Corporation (US:DG) , THOR Industries, Inc. (US:THO) , and General Motors Company (US:GM) . ACR Alpine Capital Research, LLC’s top industries are "Wholesale Trade-durable Goods" (sic 50) , "General Merchandise Stores" (sic 53) , and "Holding And Other Investment Offices" (sic 67) .
Top Increases This Quarter
We use the change in the portfolio allocation because this is the most meaningful metric. Changes can be due to trades or changes in share prices.
| Security | Shares (MM) |
Value (MM$) |
Portfolio % | ΔPortfolio % |
|---|---|---|---|---|
| 2.16 | 274.79 | 3.2954 | 3.1074 | |
| 0.71 | 354.31 | 6.3434 | 0.8397 | |
| 0.23 | 3.98 | 0.0477 | 0.0162 | |
| 0.02 | 1.97 | 0.0237 | 0.0158 | |
| 0.04 | 2.02 | 0.0242 | 0.0043 | |
| 0.09 | 0.19 | 0.0033 | 0.0015 | |
| 0.18 | 6.02 | 0.1079 | 0.0004 |
Top Decreases This Quarter
We use the change in the portfolio allocation because this is the most meaningful metric. Changes can be due to trades or changes in share prices.
| Security | Shares (MM) |
Value (MM$) |
Portfolio % | ΔPortfolio % |
|---|---|---|---|---|
| 1.59 | 362.50 | 4.3472 | -3.7370 | |
| 7.69 | 378.44 | 4.5384 | -3.0293 | |
| 4.99 | 500.12 | 5.9977 | -2.7591 | |
| 2.96 | 326.94 | 3.9208 | -2.5148 | |
| 20.52 | 205.39 | 2.4631 | -2.3135 | |
| 4.18 | 477.86 | 5.7307 | -1.9911 | |
| 5.70 | 484.84 | 5.8144 | -1.8754 | |
| 1.14 | 330.31 | 3.9613 | -1.8100 | |
| 25.87 | 275.74 | 3.3068 | -1.7308 | |
| 2.23 | 340.47 | 6.0955 | -1.6299 |
13D/G Filings
This is a list of 13D and 13G filings made in the last year (if any). Click the link icon to see the full transaction history. Green rows indicate new positions. Red rows indicate closed positions.
| File Date | Form | Security | Prev Shares |
Current Shares |
ΔShares % | % Ownership |
% ΔOwnership | |
|---|---|---|---|---|---|---|---|---|
| 2025-08-01 | THO / THOR Industries, Inc. | 3,482,917 | 4,265,031 | 22.46 | 8.00 | 21.21 | ||
| 2025-05-09 | LBTYA / Liberty Global Ltd. | 17,292,638 | 19,835,384 | 14.70 | 11.40 | 14.00 |
13F and Fund Filings
This form was filed on 2025-08-01 for the reporting period 2025-06-30. Click the link icon to see the full transaction history.
Upgrade to unlock premium data and export to Excel ![]() .
.
| Security | Type | Avg Share Price | Shares (MM) |
ΔShares (%) |
ΔShares (%) |
Value ($MM) |
Portfolio (%) |
ΔPortfolio (%) |
|
|---|---|---|---|---|---|---|---|---|---|
| GBIL / Goldman Sachs ETF Trust - Goldman Sachs Access Treasury 0-1 Year ETF | 4.99 | 19.53 | 500.12 | 19.49 | 5.9977 | -2.7591 | |||
| C / Citigroup Inc. | 5.70 | 10.01 | 484.84 | 31.91 | 5.8144 | -1.8754 | |||
| DG / Dollar General Corporation | 4.18 | -0.47 | 477.86 | 29.47 | 5.7307 | -1.9911 | |||
| THO / THOR Industries, Inc. | 4.27 | 22.46 | 378.78 | 43.45 | 4.5425 | -0.9817 | |||
| GM / General Motors Company | 7.69 | -0.01 | 378.44 | 4.62 | 4.5384 | -3.0293 | |||
| FDX / FedEx Corporation | 1.59 | 0.61 | 362.50 | -6.19 | 4.3472 | -3.7370 | |||
| MSFT / Microsoft Corporation | 0.71 | 1.65 | 354.31 | 34.69 | 6.3434 | 0.8397 | |||
| CVX / Chevron Corporation | 2.42 | 10.28 | 346.40 | -5.60 | 6.2017 | -1.4758 | |||
| JNJ / Johnson & Johnson | 2.23 | 0.11 | 340.47 | -7.79 | 6.0955 | -1.6299 | |||
| JPM / JPMorgan Chase & Co. | 1.14 | 1.32 | 330.31 | 19.74 | 3.9613 | -1.8100 | |||
| LEN / Lennar Corporation | 2.96 | 10.29 | 326.94 | 6.29 | 3.9208 | -2.5148 | |||
| VOD / Vodafone Group Public Limited Company - Depositary Receipt (Common Stock) | 25.87 | 0.66 | 275.74 | 14.52 | 3.3068 | -1.7308 | |||
| ARW / Arrow Electronics, Inc. | 2.16 | 2,391.74 | 274.79 | 2,958.27 | 3.2954 | 3.1074 | |||
| MGA / Magna International Inc. | 6.02 | 0.61 | 232.38 | 14.28 | 2.7868 | -1.4675 | |||
| LBTYA / Liberty Global Ltd. | 20.52 | 3.44 | 205.39 | -10.04 | 2.4631 | -2.3135 | |||
| BRK.B / Berkshire Hathaway Inc. | 0.23 | -1.29 | 109.94 | -9.97 | 1.3184 | -1.2364 | |||
| LBTYK / Liberty Global Ltd. | 7.19 | -1.58 | 74.11 | -15.23 | 0.8888 | -0.9404 | |||
| BRK.A / Berkshire Hathaway Inc. | 0.00 | 0.00 | 61.95 | -8.72 | 0.7429 | -0.6770 | |||
| DELL / Dell Technologies Inc. | 0.10 | -2.11 | 12.80 | 31.67 | 0.1535 | -0.0499 | |||
| BCS / Barclays PLC - Depositary Receipt (Common Stock) | 0.66 | -17.02 | 12.23 | 0.43 | 0.1467 | -0.1082 | |||
| IAC / IAC Inc. | 0.17 | 2.88 | 6.29 | -16.38 | 0.0754 | -0.0819 | |||
| MGM / MGM Resorts International | 0.18 | 1.14 | 6.02 | 17.34 | 0.1079 | 0.0004 | |||
| FPH / Five Point Holdings, LLC | 1.01 | 1.02 | 5.55 | 4.05 | 0.0993 | -0.0122 | |||
| CORZ / Core Scientific, Inc. | 0.23 | 12.02 | 3.98 | 164.25 | 0.0477 | 0.0162 | |||
| LENB / Lennar Corp. - Class B | 0.04 | 7.24 | 3.76 | 3.46 | 0.0451 | -0.0310 | |||
| LILAK / Liberty Latin America Ltd. | 0.59 | 38.09 | 3.66 | 38.33 | 0.0439 | -0.0115 | |||
| JEF / Jefferies Financial Group Inc. | 0.05 | 47.37 | 2.91 | 50.46 | 0.0349 | -0.0056 | |||
| MRK / Merck & Co., Inc. | 0.03 | 2.10 | 2.68 | -9.96 | 0.0321 | -0.0301 | |||
| SMBC / Southern Missouri Bancorp, Inc. | 0.05 | 0.05 | 2.66 | 5.35 | 0.0319 | -0.0209 | |||
| HES / Hess Corporation | 0.02 | 1.27 | 2.27 | -12.17 | 0.0272 | -0.0268 | |||
| APG / APi Group Corporation | 0.04 | 49.01 | 2.02 | 112.78 | 0.0242 | 0.0043 | |||
| RPV / Invesco Exchange-Traded Fund Trust - Invesco S&P 500 Pure Value ETF | 0.02 | 414.84 | 1.97 | 423.61 | 0.0237 | 0.0158 | |||
| KW / Kennedy-Wilson Holdings, Inc. | 0.18 | 60.26 | 1.24 | 25.48 | 0.0148 | -0.0058 | |||
| SLDP / Solid Power, Inc. | 0.09 | 0.00 | 0.19 | 108.99 | 0.0033 | 0.0015 | |||
| EARN / Ellington Credit Company | 0.01 | 0.00 | 0.07 | 6.25 | 0.0008 | -0.0005 | |||
| NINE / Nine Energy Service, Inc. | 0.01 | 0.00 | 0.01 | -31.25 | 0.0001 | -0.0002 | |||
| TLN / Talen Energy Corporation | 0.00 | -100.00 | 0.00 | 0.0000 | |||||
| FTAI / FTAI Aviation Ltd. | 0.00 | -100.00 | 0.00 | 0.0000 | |||||
| ANGI / Angi Inc. | 0.00 | -100.00 | 0.00 | 0.0000 | |||||
| SNRE / Sunrise Communications AG - Depositary Receipt (Common Stock) | 0.00 | -100.00 | 0.00 | 0.0000 | |||||
| CRK / Comstock Resources, Inc. | 0.00 | -100.00 | 0.00 | 0.0000 |