Basic Stats
| Portfolio Value | $ 579,844,517 |
| Current Positions | 217 |
Latest Holdings, Performance, AUM (from 13F, 13D)
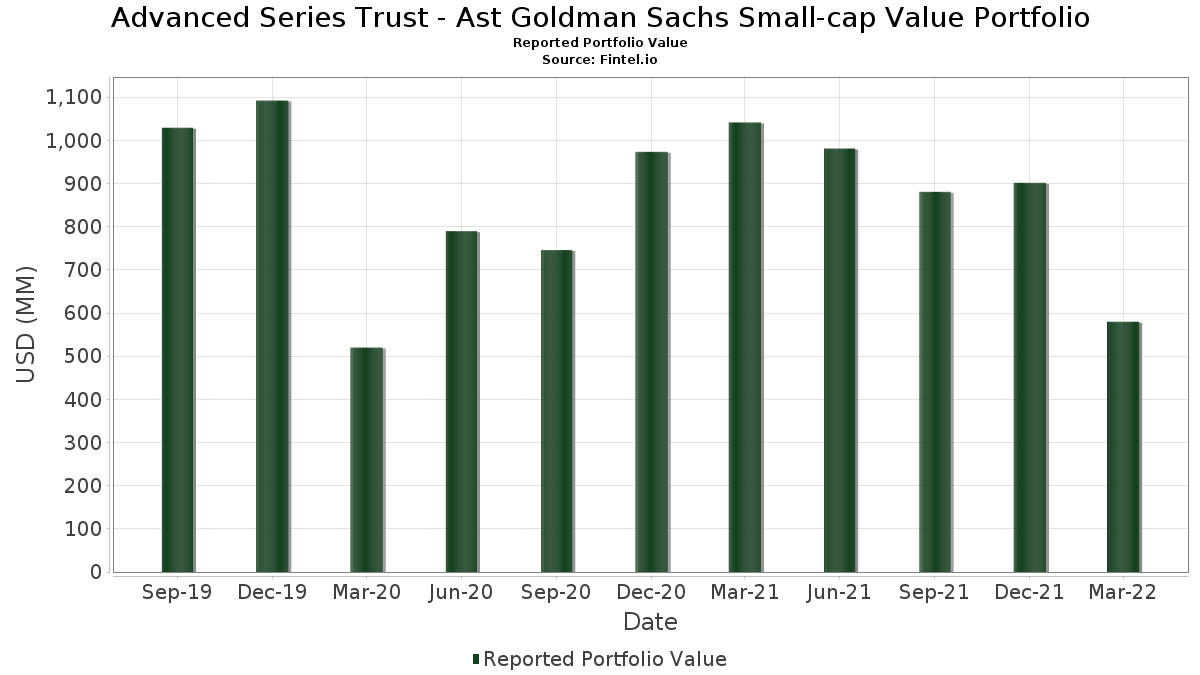
Advanced Series Trust - Ast Goldman Sachs Small-cap Value Portfolio has disclosed 217 total holdings in their latest SEC filings. Most recent portfolio value is calculated to be $ 579,844,517 USD. Actual Assets Under Management (AUM) is this value plus cash (which is not disclosed). Advanced Series Trust - Ast Goldman Sachs Small-cap Value Portfolio’s top holdings are Ovintiv Inc. (US:OVV) , Avient Corporation (US:AVNT) , KBR, Inc. (US:KBR) , Terreno Realty Corporation (US:TRNO) , and Antero Resources Corporation (US:AR) . Advanced Series Trust - Ast Goldman Sachs Small-cap Value Portfolio’s new positions include Dreyfus Government Cash Management Funds - Dreyfus Government Cash Management Fund Institutional Shares (US:DGCXX) , Chesapeake Energy Corporation (US:CHK) , CBIZ, Inc. (US:CBZ) , Hecla Mining Company - Preferred Stock (US:HL.PRB) , and Helmerich & Payne, Inc. (US:HP) .
Top Increases This Quarter
We use the change in the portfolio allocation because this is the most meaningful metric. Changes can be due to trades or changes in share prices.
| Security | Shares (MM) |
Value (MM$) |
Portfolio % | ΔPortfolio % |
|---|---|---|---|---|
| 89.28 | 89.20 | 18.1937 | 17.8334 | |
| 4.43 | 4.43 | 0.9042 | 0.9042 | |
| 0.19 | 5.78 | 1.1794 | 0.6647 | |
| 0.04 | 3.26 | 0.6640 | 0.6640 | |
| 0.06 | 2.65 | 0.5410 | 0.5410 | |
| 0.12 | 6.52 | 1.3289 | 0.5013 | |
| 0.28 | 1.85 | 0.3772 | 0.3772 | |
| 0.04 | 1.82 | 0.3714 | 0.3714 | |
| 0.11 | 4.30 | 0.8761 | 0.3518 | |
| 0.02 | 4.25 | 0.8659 | 0.3220 |
Top Decreases This Quarter
We use the change in the portfolio allocation because this is the most meaningful metric. Changes can be due to trades or changes in share prices.
| Security | Shares (MM) |
Value (MM$) |
Portfolio % | ΔPortfolio % |
|---|---|---|---|---|
| 0.01 | 1.23 | 0.2503 | -0.8195 | |
| 0.03 | 0.44 | 0.0895 | -0.7225 | |
| 0.00 | 0.04 | 0.0086 | -0.4154 | |
| 0.01 | 0.39 | 0.0786 | -0.3994 | |
| 0.01 | 0.39 | 0.0797 | -0.3979 | |
| 0.03 | 1.84 | 0.3749 | -0.3863 | |
| 0.03 | 2.07 | 0.4217 | -0.3283 | |
| 0.01 | 0.80 | 0.1628 | -0.2665 | |
| 0.02 | 1.29 | 0.2624 | -0.2515 | |
| 0.06 | 1.16 | 0.2365 | -0.2507 |
13F and Fund Filings
This form was filed on 2022-05-26 for the reporting period 2022-03-31. Click the link icon to see the full transaction history.
Upgrade to unlock premium data and export to Excel ![]() .
.
| Security | Type | Avg Share Price | Shares (MM) |
ΔShares (%) |
ΔShares (%) |
Value ($MM) |
Portfolio (%) |
ΔPortfolio (%) |
|
|---|---|---|---|---|---|---|---|---|---|
| PGIM Institutional Money Market Fund - D / STIV (000000000) | 89.28 | 46,533.98 | 89.20 | 2,626.19 | 18.1937 | 17.8334 | |||
| OVV / Ovintiv Inc. | 0.12 | -40.60 | 6.52 | -4.70 | 1.3289 | 0.5013 | |||
| AVNT / Avient Corporation | 0.13 | -35.84 | 6.46 | -44.96 | 1.3169 | -0.1031 | |||
| KBR / KBR, Inc. | 0.11 | -37.11 | 6.00 | -27.72 | 1.2240 | 0.2189 | |||
| TRNO / Terreno Realty Corporation | 0.08 | -37.11 | 5.82 | -45.40 | 1.1875 | -0.1034 | |||
| AR / Antero Resources Corporation | 0.19 | -22.05 | 5.78 | 36.02 | 1.1794 | 0.6647 | |||
| THC / Tenet Healthcare Corporation | 0.07 | -33.92 | 5.73 | -30.47 | 1.1695 | 0.1713 | |||
| IWN / iShares Trust - iShares Russell 2000 Value ETF | 0.03 | -32.90 | 5.41 | -34.79 | 1.1025 | 0.0991 | |||
| STAG / STAG Industrial, Inc. | 0.13 | -27.33 | 5.22 | -37.34 | 1.0653 | 0.0561 | |||
| WCC / WESCO International, Inc. | 0.04 | -41.00 | 5.12 | -41.65 | 1.0451 | -0.0179 | |||
| RHP / Ryman Hospitality Properties, Inc. | 0.05 | -25.74 | 4.87 | -25.10 | 0.9925 | 0.2062 | |||
| OGS / ONE Gas, Inc. | 0.06 | -39.76 | 4.86 | -31.50 | 0.9908 | 0.1324 | |||
| HR / Healthcare Realty Trust Incorporated | 0.17 | -37.11 | 4.79 | -45.39 | 0.9767 | -0.0846 | |||
| RLJ / RLJ Lodging Trust | 0.34 | -34.81 | 4.79 | -34.10 | 0.9762 | 0.0969 | |||
| PEB / Pebblebrook Hotel Trust | 0.19 | -41.93 | 4.76 | -36.45 | 0.9704 | 0.0641 | |||
| HWC / Hancock Whitney Corporation | 0.09 | -37.51 | 4.58 | -34.85 | 0.9339 | 0.0831 | |||
| DGCXX / Dreyfus Government Cash Management Funds - Dreyfus Government Cash Management Fund Institutional Shares | 4.43 | 4.43 | 0.9042 | 0.9042 | |||||
| IDA / IDACORP, Inc. | 0.04 | -37.12 | 4.43 | -35.99 | 0.9031 | 0.0658 | |||
| HPP / Hudson Pacific Properties, Inc. | 0.16 | -43.06 | 4.30 | -36.06 | 0.8779 | 0.0630 | |||
| SM / SM Energy Company | 0.11 | -24.94 | 4.30 | -0.83 | 0.8761 | 0.3518 | |||
| GTLS / Chart Industries, Inc. | 0.02 | -12.26 | 4.25 | -5.50 | 0.8659 | 0.3220 | |||
| ALE / ALLETE, Inc. | 0.06 | -32.55 | 4.11 | -31.91 | 0.8384 | 0.1076 | |||
| SBRA / Sabra Health Care REIT, Inc. | 0.26 | -29.58 | 3.86 | -22.55 | 0.7865 | 0.1837 | |||
| M / Macy's, Inc. | 0.16 | -24.31 | 3.85 | -29.57 | 0.7851 | 0.1235 | |||
| WAFD / WaFd, Inc | 0.12 | -38.01 | 3.84 | -39.05 | 0.7842 | 0.0206 | |||
| CVBF / CVB Financial Corp. | 0.16 | -37.11 | 3.81 | -31.82 | 0.7761 | 0.1004 | |||
| SITE / SiteOne Landscape Supply, Inc. | 0.23 | -37.11 | 3.81 | -33.62 | 0.7761 | 0.0822 | |||
| ASGN / ASGN Incorporated | 0.03 | -33.81 | 3.75 | -37.40 | 0.7658 | 0.0397 | |||
| SIGI / Selective Insurance Group, Inc. | 0.04 | -30.67 | 3.71 | -24.39 | 0.7562 | 0.1626 | |||
| PMT / PennyMac Mortgage Investment Trust | 0.21 | -37.11 | 3.63 | -38.70 | 0.7404 | 0.0234 | |||
| CNMD / CONMED Corporation | 0.02 | -39.97 | 3.62 | -37.11 | 0.7379 | 0.0417 | |||
| KW / Kennedy-Wilson Holdings, Inc. | 0.15 | -16.49 | 3.62 | -14.71 | 0.7378 | 0.2244 | |||
| MGEE / MGE Energy, Inc. | 0.05 | -37.11 | 3.62 | -38.99 | 0.7378 | 0.0200 | |||
| BANR / Banner Corporation | 0.06 | -39.01 | 3.59 | -41.16 | 0.7330 | -0.0064 | |||
| DBRG / DigitalBridge Group, Inc. | 0.50 | -37.11 | 3.57 | -45.65 | 0.7283 | -0.0669 | |||
| ONTO / Onto Innovation Inc. | 0.04 | -41.42 | 3.56 | -49.72 | 0.7261 | -0.1311 | |||
| CNO / CNO Financial Group, Inc. | 0.14 | -37.11 | 3.53 | -33.83 | 0.7192 | 0.0742 | |||
| PRMW / Primo Water Corporation | 0.25 | -40.63 | 3.50 | -52.01 | 0.7129 | -0.1688 | |||
| CHX / ChampionX Corporation | 0.14 | -53.66 | 3.46 | -43.88 | 0.7059 | -0.0405 | |||
| UCBI / United Community Banks, Inc. | 0.10 | -43.49 | 3.33 | -45.29 | 0.6797 | -0.0576 | |||
| RXN / Rexnord Corp | 0.09 | -33.89 | 3.32 | -35.71 | 0.6775 | 0.0521 | |||
| VIAV / Viavi Solutions Inc. | 0.21 | -37.11 | 3.31 | -42.62 | 0.6747 | -0.0231 | |||
| CMC / Commercial Metals Company | 0.08 | -8.60 | 3.28 | 4.82 | 0.6694 | 0.2904 | |||
| INDB / Independent Bank Corp. | 0.04 | -37.11 | 3.26 | -36.99 | 0.6644 | 0.0386 | |||
| CHK / Chesapeake Energy Corporation | 0.04 | 3.26 | 0.6640 | 0.6640 | |||||
| JW.A / John Wiley & Sons Inc. - Class A | 0.06 | -37.11 | 3.23 | -41.77 | 0.6597 | -0.0127 | |||
| ACHC / Acadia Healthcare Company, Inc. | 0.05 | -37.11 | 3.22 | -32.10 | 0.6562 | 0.0826 | |||
| EBC / Eastern Bankshares, Inc. | 0.15 | -37.11 | 3.19 | -32.84 | 0.6500 | 0.0756 | |||
| FRME / First Merchants Corporation | 0.08 | -37.11 | 3.17 | -37.54 | 0.6475 | 0.0321 | |||
| WD / Walker & Dunlop, Inc. | 0.02 | -45.69 | 3.16 | -53.42 | 0.6437 | -0.1765 | |||
| REZI / Resideo Technologies, Inc. | 0.13 | -43.15 | 3.15 | -47.95 | 0.6431 | -0.0903 | |||
| SEAS / United Parks & Resorts Inc. | 0.04 | -21.00 | 3.15 | -9.35 | 0.6430 | 0.2221 | |||
| / Cadence Bank | 0.11 | -41.38 | 3.13 | -42.43 | 0.6375 | -0.0197 | |||
| LKFN / Lakeland Financial Corporation | 0.04 | -42.64 | 3.11 | -47.74 | 0.6333 | -0.0861 | |||
| FSS / Federal Signal Corporation | 0.09 | -24.87 | 3.10 | -41.49 | 0.6313 | -0.0091 | |||
| AKR / Acadia Realty Trust | 0.14 | -37.11 | 3.08 | -37.58 | 0.6285 | 0.0310 | |||
| MTSI / MACOM Technology Solutions Holdings, Inc. | 0.05 | -31.34 | 3.05 | -47.51 | 0.6224 | -0.0813 | |||
| AUB / Atlantic Union Bankshares Corporation | 0.08 | -40.08 | 3.01 | -41.05 | 0.6148 | -0.0041 | |||
| MTG / MGIC Investment Corporation | 0.22 | -34.84 | 3.01 | -38.78 | 0.6140 | 0.0188 | |||
| ICFI / ICF International, Inc. | 0.03 | -19.52 | 2.99 | -26.13 | 0.6096 | 0.1198 | |||
| CAR / Avis Budget Group, Inc. | 0.01 | -48.05 | 2.95 | -34.03 | 0.6015 | 0.0603 | |||
| HIW / Highwoods Properties, Inc. | 0.06 | -43.86 | 2.94 | -42.41 | 0.5999 | -0.0183 | |||
| PACW / Pacwest Bancorp | 0.07 | -38.19 | 2.86 | -40.98 | 0.5823 | -0.0033 | |||
| NEP / XPLR Infrastructure, LP - Limited Partnership | 0.03 | -10.29 | 2.84 | -11.41 | 0.5796 | 0.1913 | |||
| BJ / BJ's Wholesale Club Holdings, Inc. | 0.04 | -22.46 | 2.84 | -21.71 | 0.5795 | 0.1401 | |||
| VNOM / Viper Energy, Inc. | 0.10 | -48.10 | 2.82 | -27.97 | 0.5758 | 0.1013 | |||
| ESGR / Enstar Group Limited | 0.01 | -37.13 | 2.81 | -33.70 | 0.5739 | 0.0603 | |||
| SSB / SouthState Corporation | 0.03 | -40.22 | 2.81 | -39.12 | 0.5728 | 0.0144 | |||
| CFX / Colfax Corp | 0.07 | -41.64 | 2.78 | -49.48 | 0.5670 | -0.0992 | |||
| OMI / Owens & Minor, Inc. | 0.06 | -37.11 | 2.76 | -36.37 | 0.5639 | 0.0380 | |||
| TWNK / Hostess Brands Inc - Class A | 0.13 | -55.95 | 2.76 | -52.67 | 0.5631 | -0.1430 | |||
| SMPL / The Simply Good Foods Company | 0.07 | -5.89 | 2.73 | -14.07 | 0.5567 | 0.1721 | |||
| TNL / Travel + Leisure Co. | 0.05 | -5.98 | 2.73 | -1.45 | 0.5563 | 0.2213 | |||
| LIVN / LivaNova PLC | 0.03 | -11.03 | 2.65 | -16.73 | 0.5412 | 0.1555 | |||
| CBZ / CBIZ, Inc. | 0.06 | 2.65 | 0.5410 | 0.5410 | |||||
| CMCO / Columbus McKinnon Corporation | 0.06 | -43.15 | 2.65 | -47.90 | 0.5396 | -0.0751 | |||
| CPK / Chesapeake Utilities Corporation | 0.02 | -39.97 | 2.64 | -43.28 | 0.5392 | -0.0251 | |||
| NXST / Nexstar Media Group, Inc. | 0.01 | -37.13 | 2.64 | -21.51 | 0.5382 | 0.1312 | |||
| CNOB / ConnectOne Bancorp, Inc. | 0.08 | -39.81 | 2.64 | -41.11 | 0.5378 | -0.0041 | |||
| HOMB / Home Bancshares, Inc. (Conway, AR) | 0.11 | -40.29 | 2.58 | -44.58 | 0.5267 | -0.0374 | |||
| AVNS / Avanos Medical, Inc. | 0.08 | -37.11 | 2.58 | -39.25 | 0.5261 | 0.0123 | |||
| BECN / Beacon Roofing Supply, Inc. | 0.04 | -46.97 | 2.57 | -45.19 | 0.5243 | -0.0435 | |||
| MDRX / Veradigm Inc. | 0.11 | -50.36 | 2.57 | -39.40 | 0.5232 | 0.0107 | |||
| GPI / Group 1 Automotive, Inc. | 0.02 | -37.12 | 2.54 | -45.95 | 0.5173 | -0.0507 | |||
| NPO / Enpro Inc. | 0.03 | -37.35 | 2.51 | -44.38 | 0.5129 | -0.0343 | |||
| NUVA / Nuvasive Inc | 0.04 | -38.56 | 2.51 | -33.63 | 0.5113 | 0.0541 | |||
| RNST / Renasant Corporation | 0.07 | -43.82 | 2.50 | -50.50 | 0.5107 | -0.1015 | |||
| PPBI / Pacific Premier Bancorp, Inc. | 0.07 | -41.05 | 2.50 | -47.95 | 0.5091 | -0.0714 | |||
| ADNT / Adient plc | 0.06 | -22.26 | 2.50 | -33.82 | 0.5091 | 0.0526 | |||
| DY / Dycom Industries, Inc. | 0.03 | -47.38 | 2.49 | -46.54 | 0.5088 | -0.0560 | |||
| FBK / FB Financial Corporation | 0.06 | -38.97 | 2.47 | -38.15 | 0.5047 | 0.0205 | |||
| KMT / Kennametal Inc. | 0.09 | -41.79 | 2.46 | -53.63 | 0.5013 | -0.1403 | |||
| ABCB / Ameris Bancorp | 0.06 | -41.48 | 2.44 | -48.32 | 0.4986 | -0.0739 | |||
| CDEV / Centennial Resource Development Inc. - Class A | 0.30 | -50.81 | 2.44 | -33.63 | 0.4984 | 0.0528 | |||
| KREF / KKR Real Estate Finance Trust Inc. | 0.12 | -37.11 | 2.43 | -37.78 | 0.4959 | 0.0229 | |||
| PDCE / PDC Energy Inc | 0.03 | -17.55 | 2.43 | 22.82 | 0.4951 | 0.2559 | |||
| ELY / Topgolf Callaway Brands Corp | 0.10 | -37.11 | 2.39 | -46.32 | 0.4877 | -0.0516 | |||
| DLX / Deluxe Corporation | 0.08 | -33.22 | 2.38 | -37.12 | 0.4860 | 0.0274 | |||
| CSTM / Constellium SE | 0.13 | -37.53 | 2.37 | -37.23 | 0.4844 | 0.0265 | |||
| CBU / Community Financial System, Inc. | 0.03 | -42.95 | 2.37 | -46.28 | 0.4841 | -0.0507 | |||
| TDS / Telephone and Data Systems, Inc. | 0.13 | -37.11 | 2.37 | -41.07 | 0.4824 | -0.0035 | |||
| FA / First Advantage Corporation | 0.12 | -37.11 | 2.35 | -33.31 | 0.4802 | 0.0528 | |||
| CPRI / Capri Holdings Limited | 0.05 | 2.72 | 2.35 | -18.67 | 0.4799 | 0.1297 | |||
| GBCI / Glacier Bancorp, Inc. | 0.05 | -42.09 | 2.32 | -48.64 | 0.4736 | -0.0738 | |||
| ARCB / ArcBest Corporation | 0.03 | -37.11 | 2.31 | -57.76 | 0.4717 | -0.1911 | |||
| MNRL / Brigham Minerals Inc - Class A | 0.09 | -38.42 | 2.31 | -25.40 | 0.4715 | 0.0964 | |||
| FUL / H.B. Fuller Company | 0.03 | -10.61 | 2.30 | -27.10 | 0.4682 | 0.0871 | |||
| ACA / Arcosa, Inc. | 0.04 | -48.58 | 2.25 | -44.15 | 0.4599 | -0.0288 | |||
| GTN / Gray Media, Inc. | 0.10 | -30.86 | 2.22 | -24.31 | 0.4529 | 0.0977 | |||
| SUM / Summit Materials, Inc. | 0.07 | -37.11 | 2.21 | -51.33 | 0.4502 | -0.0989 | |||
| KN / Knowles Corporation | 0.10 | -37.11 | 2.19 | -42.01 | 0.4472 | -0.0105 | |||
| TCBK / TriCo Bancshares | 0.05 | -37.11 | 2.16 | -41.42 | 0.4407 | -0.0057 | |||
| BRKL / Brookline Bancorp, Inc. | 0.14 | -37.11 | 2.14 | -38.56 | 0.4372 | 0.0149 | |||
| MAXR / Maxar Technologies Inc | 0.05 | -36.98 | 2.14 | -37.71 | 0.4360 | 0.0551 | |||
| ASB / Associated Banc-Corp | 0.09 | -37.11 | 2.13 | -36.63 | 0.4347 | 0.0275 | |||
| SAIA / Saia, Inc. | 0.01 | -37.12 | 2.13 | -54.52 | 0.4345 | -0.1324 | |||
| OCFC / OceanFirst Financial Corp. | 0.11 | -42.91 | 2.13 | -48.33 | 0.4344 | -0.0644 | |||
| TTMI / TTM Technologies, Inc. | 0.14 | -37.11 | 2.13 | -37.46 | 0.4340 | 0.0222 | |||
| COHU / Cohu, Inc. | 0.07 | -34.37 | 2.09 | -49.00 | 0.4260 | -0.0697 | |||
| MTH / Meritage Homes Corporation | 0.03 | -48.59 | 2.07 | -66.63 | 0.4217 | -0.3283 | |||
| OPCH / Option Care Health, Inc. | 0.07 | -37.11 | 2.03 | -36.84 | 0.4147 | 0.0250 | |||
| IRDM / Iridium Communications Inc. | 0.05 | -54.15 | 2.02 | -55.23 | 0.4129 | -0.1345 | |||
| MGY / Magnolia Oil & Gas Corporation | 0.08 | -61.20 | 1.98 | -51.38 | 0.4033 | -0.0890 | |||
| AIR / AAR Corp. | 0.04 | -60.79 | 1.96 | -51.34 | 0.4004 | -0.0881 | |||
| TOWN / TowneBank | 0.07 | -37.11 | 1.96 | -40.39 | 0.3998 | 0.0017 | |||
| RAMP / LiveRamp Holdings, Inc. | 0.05 | -48.52 | 1.95 | -59.86 | 0.3974 | -0.1902 | |||
| SJW / SJW Group | 0.03 | -37.11 | 1.88 | -40.22 | 0.3833 | 0.0027 | |||
| TWO / Two Harbors Investment Corp. | 0.34 | -37.11 | 1.87 | -39.74 | 0.3816 | 0.0058 | |||
| ASTE / Astec Industries, Inc. | 0.04 | -37.11 | 1.86 | -60.97 | 0.3800 | -0.1977 | |||
| FFIN / First Financial Bankshares, Inc. | 0.04 | -37.11 | 1.85 | -45.44 | 0.3773 | -0.0330 | |||
| HL.PRB / Hecla Mining Company - Preferred Stock | 0.28 | 1.85 | 0.3772 | 0.3772 | |||||
| CCS / Century Communities, Inc. | 0.03 | -55.37 | 1.84 | -70.78 | 0.3749 | -0.3863 | |||
| OAS / Oasis Petroleum Inc. - New | 0.01 | -37.12 | 1.82 | -26.98 | 0.3722 | 0.0696 | |||
| HP / Helmerich & Payne, Inc. | 0.04 | 1.82 | 0.3714 | 0.3714 | |||||
| ATI / ATI Inc. | 0.07 | -37.25 | 1.80 | 5.75 | 0.3676 | 0.1612 | |||
| COLB / Columbia Banking System, Inc. | 0.06 | -43.54 | 1.78 | -44.32 | 0.3639 | -0.0240 | |||
| ESE / ESCO Technologies Inc. | 0.03 | -35.26 | 1.78 | -49.69 | 0.3633 | -0.0654 | |||
| NOMD / Nomad Foods Limited | 0.08 | 17.13 | 1.72 | 4.18 | 0.3505 | 0.1508 | |||
| CTS / CTS Corporation | 0.05 | -37.11 | 1.71 | -39.47 | 0.3494 | 0.0068 | |||
| PNFP / Pinnacle Financial Partners, Inc. | 0.02 | -51.95 | 1.67 | -53.67 | 0.3399 | -0.0955 | |||
| NMIH / NMI Holdings, Inc. | 0.08 | -37.11 | 1.64 | -40.65 | 0.3339 | -0.0000 | |||
| WHD / Cactus, Inc. | 0.03 | -59.97 | 1.62 | -40.44 | 0.3311 | 0.0012 | |||
| SMTC / Semtech Corporation | 0.02 | -10.17 | 1.59 | -29.94 | 0.3245 | 0.0495 | |||
| FARO / FARO Technologies, Inc. | 0.03 | -37.10 | 1.56 | -53.37 | 0.3188 | -0.0869 | |||
| MYGN / Myriad Genetics, Inc. | 0.06 | -37.11 | 1.55 | -42.58 | 0.3164 | -0.0106 | |||
| TGNA / TEGNA Inc. | 0.07 | -40.64 | 1.53 | -28.40 | 0.3128 | 0.0536 | |||
| ASO / Academy Sports and Outdoors, Inc. | 0.04 | 15.97 | 1.53 | 4.08 | 0.3122 | 0.1342 | |||
| SF / Stifel Financial Corp. | 0.02 | -44.54 | 1.53 | -46.54 | 0.3120 | -0.0343 | |||
| US4039491000 / HF Sinclair Corp. | 0.04 | 1.53 | 0.3111 | 0.3111 | |||||
| HFWA / Heritage Financial Corporation | 0.06 | -37.11 | 1.46 | -35.51 | 0.2983 | 0.0237 | |||
| GABC / German American Bancorp, Inc. | 0.04 | -37.11 | 1.45 | -38.70 | 0.2966 | 0.0094 | |||
| IHRT / iHeartMedia, Inc. | 0.08 | -37.11 | 1.45 | -43.43 | 0.2959 | -0.0145 | |||
| RLI / RLI Corp. | 0.01 | -33.78 | 1.43 | -34.67 | 0.2923 | 0.0268 | |||
| NEX / NexTier Oilfield Solutions Inc | 0.15 | -37.11 | 1.43 | 63.72 | 0.2910 | 0.1855 | |||
| DCO / Ducommun Incorporated | 0.03 | -24.63 | 1.39 | -15.59 | 0.2828 | 0.0840 | |||
| HI / Hillenbrand, Inc. | 0.03 | -37.94 | 1.38 | -47.28 | 0.2806 | -0.0353 | |||
| AMC / AMC Entertainment Holdings, Inc. | 0.06 | -44.94 | 1.38 | -50.13 | 0.2806 | -0.0533 | |||
| UNFI / United Natural Foods, Inc. | 0.03 | -48.76 | 1.37 | -56.84 | 0.2794 | -0.1047 | |||
| TEX / Terex Corporation | 0.04 | -47.27 | 1.37 | -57.22 | 0.2791 | -0.1081 | |||
| IDCC / InterDigital, Inc. | 0.02 | -37.10 | 1.34 | -43.99 | 0.2730 | -0.0162 | |||
| ALKS / Alkermes plc | 0.05 | -37.11 | 1.31 | -28.85 | 0.2666 | 0.0442 | |||
| IBP / Installed Building Products, Inc. | 0.02 | -44.12 | 1.30 | -66.22 | 0.2653 | -0.2007 | |||
| MMSI / Merit Medical Systems, Inc. | 0.02 | -71.62 | 1.29 | -69.70 | 0.2624 | -0.2515 | |||
| IRWD / Ironwood Pharmaceuticals, Inc. | 0.10 | -44.57 | 1.25 | -40.24 | 0.2543 | 0.0019 | |||
| ALGT / Allegiant Travel Company | 0.01 | -43.68 | 1.24 | -51.09 | 0.2521 | -0.0539 | |||
| MTZ / MasTec, Inc. | 0.01 | -87.45 | 1.23 | -88.33 | 0.2503 | -0.8195 | |||
| TROX / Tronox Holdings plc | 0.06 | -65.02 | 1.16 | -71.20 | 0.2365 | -0.2507 | |||
| / Collier Creek Holdings Units, each consisting of one Class A ordinary share, $0.0001 par value, and | 0.08 | -37.11 | 1.13 | -41.75 | 0.2313 | -0.0043 | |||
| AGIO / Agios Pharmaceuticals, Inc. | 0.04 | -32.69 | 1.12 | -40.41 | 0.2281 | 0.0010 | |||
| PJT / PJT Partners Inc. | 0.02 | -41.72 | 1.11 | -50.34 | 0.2266 | -0.0443 | |||
| LBRT / Liberty Energy Inc. | 0.07 | -15.04 | 1.08 | 29.82 | 0.2212 | 0.1201 | |||
| AMN / AMN Healthcare Services, Inc. | 0.01 | -65.01 | 1.07 | -70.17 | 0.2184 | -0.2159 | |||
| DTM / DT Midstream, Inc. | 0.02 | 1.05 | 0.2138 | 0.2138 | |||||
| AMSF / AMERISAFE, Inc. | 0.02 | -30.92 | 1.02 | -36.22 | 0.2087 | 0.0144 | |||
| EVC / Entravision Communications Corporation | 0.15 | -33.03 | 0.98 | -36.70 | 0.2006 | 0.0125 | |||
| REGI / Renewable Energy Group Inc | 0.02 | -61.04 | 0.95 | -44.34 | 0.1947 | -0.0129 | |||
| EPAY / Bottomline Technologies (Delaware) Inc | 0.02 | -70.87 | 0.94 | -70.77 | 0.1924 | -0.1982 | |||
| PX / P10, Inc. | 0.07 | -37.11 | 0.91 | -45.49 | 0.1851 | -0.0164 | |||
| LC / LendingClub Corporation | 0.06 | 0.90 | 0.1832 | 0.1832 | |||||
| PRI / Primerica, Inc. | 0.01 | -54.35 | 0.87 | -59.23 | 0.1775 | -0.0810 | |||
| HLI / Houlihan Lokey, Inc. | 0.01 | -47.61 | 0.84 | -55.57 | 0.1718 | -0.0577 | |||
| RVMD / Revolution Medicines, Inc. | 0.03 | -37.11 | 0.81 | -36.29 | 0.1659 | 0.0114 | |||
| BHLB / Berkshire Hills Bancorp, Inc. | 0.03 | -37.11 | 0.81 | -35.95 | 0.1648 | 0.0122 | |||
| SIG / Signet Jewelers Limited | 0.01 | -73.06 | 0.80 | -77.49 | 0.1628 | -0.2665 | |||
| BRC / Brady Corporation | 0.02 | -63.21 | 0.73 | -68.44 | 0.1480 | -0.1301 | |||
| HCC / Warrior Met Coal, Inc. | 0.02 | 0.71 | 0.1442 | 0.1442 | |||||
| TRTX / TPG RE Finance Trust, Inc. | 0.06 | 90.66 | 0.70 | 82.89 | 0.1418 | 0.0958 | |||
| BYD / Boyd Gaming Corporation | 0.01 | -71.83 | 0.65 | -71.73 | 0.1320 | -0.1452 | |||
| DECK / Deckers Outdoor Corporation | 0.00 | 930.97 | 0.64 | 676.83 | 0.1301 | 0.1201 | |||
| GFF / Griffon Corporation | 0.03 | -50.35 | 0.64 | -65.11 | 0.1297 | -0.0907 | |||
| TPTX / Turning Point Therapeutics Inc | 0.02 | -30.96 | 0.63 | -61.15 | 0.1280 | -0.0675 | |||
| BRP / The Baldwin Insurance Group, Inc. | 0.02 | -41.95 | 0.62 | -56.90 | 0.1268 | -0.0477 | |||
| AAWW / Atlas Air Worldwide Holdings Inc. | 0.01 | -37.14 | 0.62 | -42.29 | 0.1267 | -0.0037 | |||
| CYTK / Cytokinetics, Incorporated | 0.02 | -23.27 | 0.56 | -38.10 | 0.1142 | 0.0048 | |||
| SOVO / Sovos Brands, Inc. | 0.04 | -37.11 | 0.55 | -40.77 | 0.1127 | -0.0002 | |||
| CRNC / Cerence Inc. | 0.01 | -45.37 | 0.51 | -74.27 | 0.1037 | -0.1354 | |||
| CRTO / Criteo S.A. - Depositary Receipt (Common Stock) | 0.03 | -37.11 | 0.51 | -32.58 | 0.1034 | 0.0123 | |||
| FCFS / FirstCash Holdings, Inc. | 0.01 | -77.76 | 0.50 | -79.09 | 0.1012 | -0.1860 | |||
| GT / The Goodyear Tire & Rubber Company | 0.03 | -90.24 | 0.44 | -93.47 | 0.0895 | -0.7225 | |||
| BPMC / Blueprint Medicines Corporation | 0.01 | -37.11 | 0.43 | -62.48 | 0.0877 | -0.0511 | |||
| PACB / Pacific Biosciences of California, Inc. | 0.05 | -48.34 | 0.43 | -77.03 | 0.0873 | -0.1383 | |||
| ALRS / Alerus Financial Corporation | 0.01 | -37.10 | 0.40 | -40.66 | 0.0811 | 0.0000 | |||
| ARRY / Array Technologies, Inc. | 0.04 | -37.11 | 0.40 | -54.85 | 0.0808 | -0.0254 | |||
| ABM / ABM Industries Incorporated | 0.01 | -90.78 | 0.39 | -91.69 | 0.0797 | -0.3979 | |||
| ANF / Abercrombie & Fitch Co. | 0.01 | -88.35 | 0.39 | -90.10 | 0.0786 | -0.3994 | |||
| CDE / Coeur Mining, Inc. | 0.08 | -65.89 | 0.34 | -69.93 | 0.0691 | -0.0671 | |||
| ALLO / Allogene Therapeutics, Inc. | 0.04 | -37.10 | 0.34 | -61.62 | 0.0688 | -0.0375 | |||
| BBBY / Bed Bath & Beyond, Inc. | 0.01 | 0.31 | 0.0637 | 0.0637 | |||||
| FLIC / The First of Long Island Corporation | 0.02 | -37.10 | 0.30 | -43.39 | 0.0621 | -0.0029 | |||
| / BELLRING BRANDS INC 0.00000000 | 0.01 | 0.30 | 0.0615 | 0.0615 | |||||
| OPRT / Oportun Financial Corporation | 0.02 | -37.11 | 0.29 | -55.52 | 0.0602 | -0.0199 | |||
| PFGC / Performance Food Group Company | 0.01 | -37.10 | 0.28 | -30.39 | 0.0581 | 0.0087 | |||
| NVTA / Invitae Corporation | 0.04 | -49.25 | 0.28 | -73.57 | 0.0575 | -0.0713 | |||
| DDS / Dillard's, Inc. | 0.00 | -37.24 | 0.27 | -31.28 | 0.0548 | 0.0075 | |||
| MRSN / Mersana Therapeutics, Inc. | 0.05 | -8.39 | 0.21 | -41.21 | 0.0437 | -0.0004 | |||
| BLUE / bluebird bio, Inc. | 0.04 | -49.73 | 0.19 | -75.61 | 0.0390 | -0.0559 | |||
| CTRN / Citi Trends, Inc. | 0.00 | -96.26 | 0.04 | -98.80 | 0.0086 | -0.4154 | |||
| INO / Inovio Pharmaceuticals, Inc. | 0.00 | -100.00 | 0.00 | -100.00 | -0.0689 |