Basic Stats
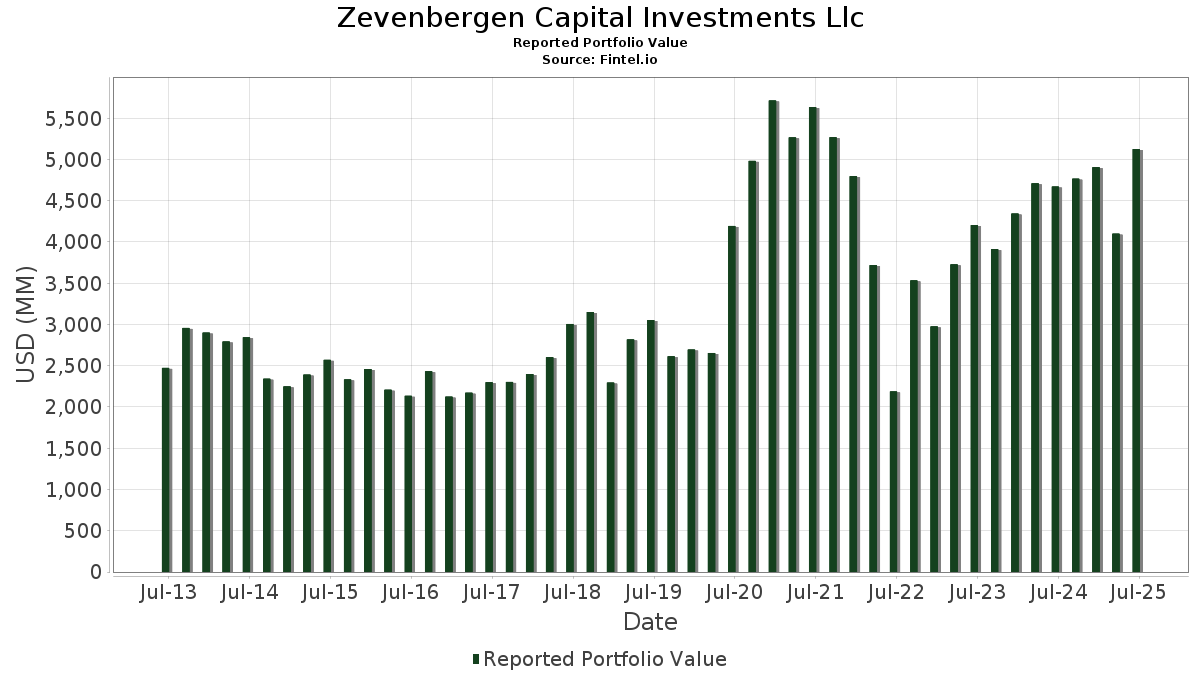
| Portfolio Value | $ 5,125,561,320 |
| Current Positions | 105 |
Latest Holdings, Performance, AUM (from 13F, 13D)
Zevenbergen Capital Investments Llc has disclosed 105 total holdings in their latest SEC filings. Most recent portfolio value is calculated to be $ 5,125,561,320 USD. Actual Assets Under Management (AUM) is this value plus cash (which is not disclosed). Zevenbergen Capital Investments Llc’s top holdings are NVIDIA Corporation (US:NVDA) , Axon Enterprise, Inc. (US:AXON) , Tesla, Inc. (US:TSLA) , Meta Platforms, Inc. (US:META) , and MercadoLibre, Inc. (US:MELI) . Zevenbergen Capital Investments Llc’s new positions include Rocket Lab Corporation (US:RKLB) , TransMedics Group, Inc. (US:TMDX) , Deere & Company (US:DE) , Quest Diagnostics Incorporated (US:DGX) , and Palomar Holdings, Inc. (US:PLMR) .
Top Increases This Quarter
We use the change in the portfolio allocation because this is the most meaningful metric. Changes can be due to trades or changes in share prices.
| Security | Shares (MM) |
Value (MM$) |
Portfolio % | ΔPortfolio % |
|---|---|---|---|---|
| 0.39 | 324.09 | 6.3230 | 0.9960 | |
| 1.08 | 38.72 | 0.7553 | 0.7553 | |
| 0.12 | 16.29 | 0.3177 | 0.3177 | |
| 0.07 | 27.12 | 0.2561 | 0.2169 | |
| 0.30 | 67.31 | 1.3132 | 0.2089 | |
| 0.62 | 54.41 | 1.0616 | 0.1929 | |
| 0.95 | 37.98 | 0.7410 | 0.1915 | |
| 0.26 | 133.73 | 2.6091 | 0.1484 | |
| 0.09 | 8.62 | 0.1682 | 0.0770 | |
| 2.16 | 95.50 | 1.8631 | 0.0636 |
Top Decreases This Quarter
We use the change in the portfolio allocation because this is the most meaningful metric. Changes can be due to trades or changes in share prices.
| Security | Shares (MM) |
Value (MM$) |
Portfolio % | ΔPortfolio % |
|---|---|---|---|---|
| 2.98 | 470.85 | 4.4455 | -3.7700 | |
| 2.31 | 266.57 | 2.5169 | -3.1021 | |
| 0.11 | 291.17 | 2.7491 | -3.0156 | |
| 0.40 | 297.39 | 2.8079 | -2.9545 | |
| 0.32 | 158.89 | 1.5001 | -1.5252 | |
| 1.51 | 140.78 | 1.3292 | -1.4432 | |
| 0.64 | 112.86 | 1.0656 | -1.4281 | |
| 2.17 | 156.12 | 1.4741 | -1.4211 | |
| 0.15 | 117.59 | 1.1102 | -1.0322 | |
| 0.82 | 57.76 | 0.5453 | -0.9098 |
13F and Fund Filings
This form was filed on 2025-07-07 for the reporting period 2025-06-30. Click the link icon to see the full transaction history.
Upgrade to unlock premium data and export to Excel ![]() .
.
| Security | Type | Avg Share Price | Shares (MM) |
ΔShares (%) |
ΔShares (%) |
Value ($MM) |
Portfolio (%) |
ΔPortfolio (%) |
|
|---|---|---|---|---|---|---|---|---|---|
| NVDA / NVIDIA Corporation | 2.98 | -4.11 | 470.85 | 39.78 | 4.4455 | -3.7700 | |||
| AXON / Axon Enterprise, Inc. | 0.39 | -5.74 | 324.09 | 48.39 | 6.3230 | 0.9960 | |||
| TSLA / Tesla, Inc. | 0.96 | -4.94 | 306.09 | 16.52 | 5.9718 | -0.4354 | |||
| META / Meta Platforms, Inc. | 0.40 | -1.71 | 297.39 | 25.88 | 2.8079 | -2.9545 | |||
| MELI / MercadoLibre, Inc. | 0.11 | -8.05 | 291.17 | 23.19 | 2.7491 | -3.0156 | |||
| SHOP / Shopify Inc. | 2.31 | -4.22 | 266.57 | 15.71 | 2.5169 | -3.1021 | |||
| AMZN / Amazon.com, Inc. | 1.12 | -3.67 | 244.76 | 11.08 | 4.7752 | -0.5989 | |||
| NFLX / Netflix, Inc. | 0.12 | -13.29 | 159.00 | 24.52 | 3.1021 | -0.0122 | |||
| MSFT / Microsoft Corporation | 0.32 | -3.33 | 158.89 | 28.09 | 1.5001 | -1.5252 | |||
| TTD / The Trade Desk, Inc. | 2.17 | -0.03 | 156.12 | 31.53 | 1.4741 | -1.4211 | |||
| NOW / ServiceNow, Inc. | 0.15 | -7.74 | 152.37 | 19.14 | 2.9727 | -0.1466 | |||
| UBER / Uber Technologies, Inc. | 1.51 | -3.28 | 140.78 | 23.85 | 1.3292 | -1.4432 | |||
| CRWD / CrowdStrike Holdings, Inc. | 0.26 | -8.24 | 133.73 | 32.55 | 2.6091 | 0.1484 | |||
| SPOT / Spotify Technology S.A. | 0.15 | -4.04 | 117.59 | 33.87 | 1.1102 | -1.0322 | |||
| GOOG / Alphabet Inc. | 0.64 | -2.78 | 112.86 | 10.39 | 1.0656 | -1.4281 | |||
| AAPL / Apple Inc. | 0.48 | -2.38 | 97.64 | -9.84 | 1.9050 | -0.7363 | |||
| TOST / Toast, Inc. | 2.16 | -3.06 | 95.50 | 29.43 | 1.8631 | 0.0636 | |||
| AVGO / Broadcom Inc. | 0.31 | -15.74 | 86.03 | 38.72 | 0.8123 | -0.7003 | |||
| AMD / Advanced Micro Devices, Inc. | 0.60 | -32.41 | 84.57 | -6.65 | 1.6500 | -0.5596 | |||
| PANW / Palo Alto Networks, Inc. | 0.41 | -14.25 | 83.78 | 2.83 | 1.6346 | -0.3526 | |||
| ARM / Arm Holdings plc - Depositary Receipt (Common Stock) | 0.48 | 1.22 | 77.20 | 53.31 | 0.7289 | -0.4993 | |||
| NTRA / Natera, Inc. | 0.41 | -5.51 | 68.59 | 12.88 | 0.6476 | -0.8344 | |||
| SNOW / Snowflake Inc. | 0.30 | -2.90 | 67.31 | 48.66 | 1.3132 | 0.2089 | |||
| ELF / e.l.f. Beauty, Inc. | 0.50 | -26.28 | 62.57 | 46.10 | 0.5907 | -0.4537 | |||
| VEEV / Veeva Systems Inc. | 0.20 | -2.56 | 59.02 | 21.14 | 0.5572 | -0.6310 | |||
| Z / Zillow Group, Inc. | 0.82 | -5.24 | 57.76 | -3.18 | 0.5453 | -0.9098 | |||
| WING / Wingstop Inc. | 0.17 | -2.97 | 55.64 | 44.84 | 0.5254 | -0.4116 | |||
| DXCM / DexCom, Inc. | 0.62 | 19.52 | 54.41 | 52.77 | 1.0616 | 0.1929 | |||
| EXAS / Exact Sciences Corporation | 1.02 | -12.82 | 54.11 | 7.01 | 1.0556 | -0.1776 | |||
| PWR / Quanta Services, Inc. | 0.11 | 2.35 | 42.10 | 52.24 | 0.3975 | -0.2770 | |||
| RKLB / Rocket Lab Corporation | 1.08 | 38.72 | 0.7553 | 0.7553 | |||||
| IOT / Samsara Inc. | 0.95 | 62.43 | 37.98 | 68.58 | 0.7410 | 0.1915 | |||
| MU / Micron Technology, Inc. | 0.30 | -2.46 | 37.36 | 38.36 | 0.3528 | -0.3059 | |||
| ORCL / Oracle Corporation | 0.16 | 0.12 | 35.84 | 56.57 | 0.3383 | -0.2199 | |||
| ABNB / Airbnb, Inc. | 0.26 | -11.10 | 34.88 | -1.52 | 0.3293 | -0.5345 | |||
| ONON / On Holding AG | 0.63 | 7.06 | 32.93 | 26.88 | 0.6425 | 0.0094 | |||
| MPWR / Monolithic Power Systems, Inc. | 0.04 | -0.60 | 31.03 | 25.35 | 0.2930 | -0.3108 | |||
| CWAN / Clearwater Analytics Holdings, Inc. | 1.37 | 50.27 | 29.97 | 22.96 | 0.2830 | -0.3115 | |||
| DDOG / Datadog, Inc. | 0.21 | 0.00 | 28.18 | 35.40 | 0.2661 | -0.2416 | |||
| CYBR / CyberArk Software Ltd. | 0.07 | 1,301.83 | 27.12 | 1,587.68 | 0.2561 | 0.2169 | |||
| ARES / Ares Management Corporation | 0.15 | -0.78 | 25.95 | 17.22 | 0.2450 | -0.2950 | |||
| ANET / Arista Networks Inc | 0.25 | -3.04 | 25.11 | 28.03 | 0.2370 | -0.2412 | |||
| HUBS / HubSpot, Inc. | 0.04 | -3.75 | 22.22 | -6.22 | 0.2097 | -0.3680 | |||
| INTU / Intuit Inc. | 0.03 | -0.37 | 20.25 | 27.81 | 0.1912 | -0.1952 | |||
| BKNG / Booking Holdings Inc. | 0.00 | -0.68 | 17.69 | 24.80 | 0.3452 | -0.0006 | |||
| APH / Amphenol Corporation | 0.18 | -0.12 | 17.36 | 50.37 | 0.3387 | 0.0571 | |||
| QCOM / QUALCOMM Incorporated | 0.11 | -13.80 | 16.74 | -10.63 | 0.1581 | -0.2989 | |||
| TMDX / TransMedics Group, Inc. | 0.12 | 16.29 | 0.3177 | 0.3177 | |||||
| PINS / Pinterest, Inc. | 0.43 | 11.79 | 15.29 | 29.31 | 0.2984 | 0.0099 | |||
| DELL / Dell Technologies Inc. | 0.11 | -29.72 | 13.68 | -5.48 | 0.1292 | -0.2239 | |||
| KLAC / KLA Corporation | 0.01 | 0.00 | 13.44 | 31.76 | 0.1269 | -0.1218 | |||
| AMAT / Applied Materials, Inc. | 0.07 | 0.00 | 12.81 | 26.15 | 0.2500 | 0.0023 | |||
| CDNS / Cadence Design Systems, Inc. | 0.04 | -6.89 | 12.34 | 12.81 | 0.1166 | -0.1503 | |||
| VRT / Vertiv Holdings Co | 0.09 | 0.00 | 11.56 | 77.84 | 0.1091 | -0.0494 | |||
| ASML / ASML Holding N.V. - Depositary Receipt (Common Stock) | 0.01 | -2.75 | 10.80 | 17.62 | 0.2106 | -0.0133 | |||
| RGEN / Repligen Corporation | 0.09 | -1.79 | 10.70 | -4.00 | 0.1010 | -0.1708 | |||
| ADBE / Adobe Inc. | 0.02 | 0.00 | 9.63 | 0.88 | 0.1879 | -0.0450 | |||
| DKNG / DraftKings Inc. | 0.21 | 12.25 | 9.20 | 44.96 | 0.1795 | 0.0247 | |||
| CRDO / Credo Technology Group Holding Ltd | 0.09 | 0.00 | 8.62 | 130.60 | 0.1682 | 0.0770 | |||
| JPM / JPMorgan Chase & Co. | 0.03 | -0.74 | 8.56 | 17.32 | 0.1671 | -0.0110 | |||
| COST / Costco Wholesale Corporation | 0.01 | 0.43 | 8.05 | 5.12 | 0.0760 | -0.1107 | |||
| V / Visa Inc. | 0.02 | 1.41 | 7.28 | 2.74 | 0.0688 | -0.1042 | |||
| SRAD / Sportradar Group AG | 0.23 | 0.00 | 6.42 | 29.89 | 0.0606 | -0.0599 | |||
| MDB / MongoDB, Inc. | 0.03 | -54.40 | 6.30 | -45.41 | 0.1229 | -0.1585 | |||
| BR / Broadridge Financial Solutions, Inc. | 0.02 | -20.01 | 5.60 | -19.83 | 0.0529 | -0.1175 | |||
| SYM / Symbotic Inc. | 0.14 | -74.82 | 5.51 | -51.60 | 0.1074 | -0.1700 | |||
| PGR / The Progressive Corporation | 0.02 | -1.59 | 4.78 | -7.21 | 0.0451 | -0.0805 | |||
| CRM / Salesforce, Inc. | 0.02 | -24.68 | 4.74 | -23.47 | 0.0926 | -0.0586 | |||
| APPF / AppFolio, Inc. | 0.02 | 0.00 | 4.61 | 4.71 | 0.0435 | -0.0638 | |||
| BLK / BlackRock, Inc. | 0.00 | 0.82 | 4.50 | 11.78 | 0.0425 | -0.0557 | |||
| CTAS / Cintas Corporation | 0.02 | 0.35 | 4.45 | 8.82 | 0.0421 | -0.0578 | |||
| HD / The Home Depot, Inc. | 0.01 | 1.05 | 4.04 | 1.10 | 0.0789 | -0.0187 | |||
| NBIS / Nebius Group N.V. | 0.06 | 0.00 | 3.49 | 162.26 | 0.0329 | 0.0005 | |||
| PAYX / Paychex, Inc. | 0.02 | 1.46 | 3.29 | -4.37 | 0.0310 | -0.0528 | |||
| RIVN / Rivian Automotive, Inc. | 0.23 | 0.00 | 3.14 | 10.34 | 0.0612 | -0.0081 | |||
| SPY / SPDR S&P 500 ETF | 0.00 | -1.05 | 2.91 | 9.33 | 0.0274 | -0.0374 | |||
| ABT / Abbott Laboratories | 0.02 | 0.94 | 2.86 | 3.51 | 0.0270 | -0.0404 | |||
| BE / Bloom Energy Corporation | 0.12 | -4.56 | 2.83 | 16.15 | 0.0552 | -0.0042 | |||
| AMGN / Amgen Inc. | 0.01 | 3.03 | 2.75 | -7.65 | 0.0260 | -0.0467 | |||
| ZTS / Zoetis Inc. | 0.02 | 4.79 | 2.52 | -0.75 | 0.0238 | -0.0382 | |||
| BX / Blackstone Inc. | 0.02 | 3.32 | 2.47 | 10.57 | 0.0233 | -0.0312 | |||
| NXPI / NXP Semiconductors N.V. | 0.01 | 0.00 | 2.38 | 14.97 | 0.0225 | -0.0280 | |||
| PCAR / PACCAR Inc | 0.02 | 3.55 | 2.25 | 1.08 | 0.0212 | -0.0330 | |||
| WM / Waste Management, Inc. | 0.01 | 30.43 | 2.16 | 28.93 | 0.0204 | -0.0205 | |||
| JNJ / Johnson & Johnson | 0.01 | 3.37 | 1.64 | -4.76 | 0.0155 | -0.0265 | |||
| DE / Deere & Company | 0.00 | 1.63 | 0.0318 | 0.0318 | |||||
| ECL / Ecolab Inc. | 0.01 | 3.45 | 1.53 | 9.97 | 0.0299 | -0.0041 | |||
| NEE / NextEra Energy, Inc. | 0.02 | -7.08 | 1.38 | -9.03 | 0.0130 | -0.0240 | |||
| CSCO / Cisco Systems, Inc. | 0.02 | 4.64 | 1.08 | 17.69 | 0.0102 | -0.0122 | |||
| SBUX / Starbucks Corporation | 0.01 | 1.45 | 1.03 | -5.26 | 0.0097 | -0.0167 | |||
| TSCO / Tractor Supply Company | 0.02 | 0.94 | 0.99 | -3.33 | 0.0193 | -0.0056 | |||
| DGX / Quest Diagnostics Incorporated | 0.00 | 0.73 | 0.0142 | 0.0142 | |||||
| GOOGL / Alphabet Inc. | 0.00 | 0.00 | 0.73 | 13.97 | 0.0069 | -0.0087 | |||
| DIS / The Walt Disney Company | 0.01 | 9.01 | 0.72 | 37.14 | 0.0068 | -0.0060 | |||
| DSI / iShares Trust - iShares ESG MSCI KLD 400 ETF | 0.01 | -10.00 | 0.71 | 2.03 | 0.0067 | -0.0102 | |||
| ACN / Accenture plc | 0.00 | 5.70 | 0.64 | 1.27 | 0.0060 | -0.0093 | |||
| AXP / American Express Company | 0.00 | 0.00 | 0.54 | 18.60 | 0.0106 | -0.0006 | |||
| ABBV / AbbVie Inc. | 0.00 | 0.00 | 0.36 | -11.44 | 0.0070 | -0.0029 | |||
| CAVA / CAVA Group, Inc. | 0.00 | 0.33 | 0.0032 | 0.0032 | |||||
| DIA / SPDR Dow Jones Industrial Average ETF Trust | 0.00 | 0.00 | 0.29 | 5.15 | 0.0027 | -0.0040 | |||
| ODD / Oddity Tech Ltd. | 0.00 | 0.28 | 0.0055 | 0.0055 | |||||
| XMTR / Xometry, Inc. | 0.01 | -23.41 | 0.27 | 3.92 | 0.0025 | -0.0037 | |||
| PLMR / Palomar Holdings, Inc. | 0.00 | 0.22 | 0.0044 | 0.0044 | |||||
| MIR / Mirion Technologies, Inc. | 0.01 | 0.22 | 0.0043 | 0.0043 | |||||
| DHI / D.R. Horton, Inc. | 0.00 | 0.20 | 0.0019 | 0.0019 | |||||
| STZ / Constellation Brands, Inc. | 0.00 | -100.00 | 0.00 | 0.0000 | |||||
| SEMR / Semrush Holdings, Inc. | 0.00 | -100.00 | 0.00 | -100.00 | -0.0554 | ||||
| RKLB / Rocket Lab Corporation | 0.00 | -100.00 | 0.00 | 0.0000 | |||||
| PCOR / Procore Technologies, Inc. | 0.00 | -100.00 | 0.00 | 0.0000 | |||||
| BDX / Becton, Dickinson and Company | 0.00 | -100.00 | 0.00 | 0.0000 |