Basic Stats
| Portfolio Value | $ 351,353,650 |
| Current Positions | 129 |
Latest Holdings, Performance, AUM (from 13F, 13D)
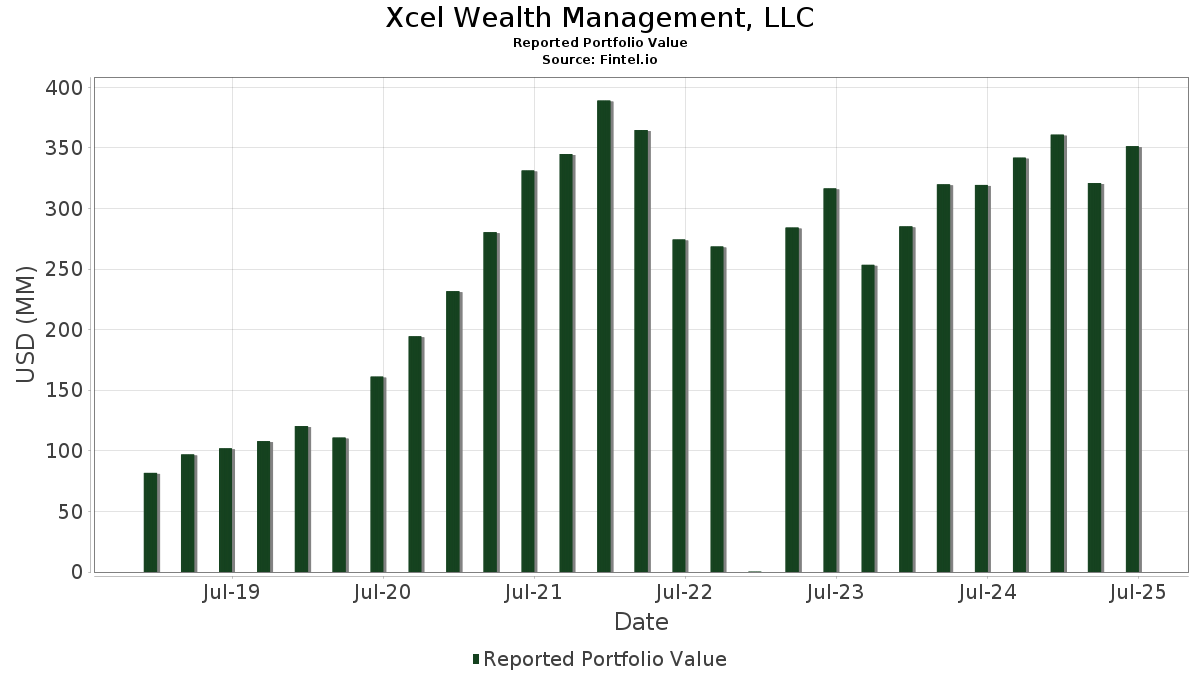
Xcel Wealth Management, LLC has disclosed 129 total holdings in their latest SEC filings. Most recent portfolio value is calculated to be $ 351,353,650 USD. Actual Assets Under Management (AUM) is this value plus cash (which is not disclosed). Xcel Wealth Management, LLC’s top holdings are Amazon.com, Inc. (US:AMZN) , RH (US:RH) , Bank of America Corporation (US:BAC) , NVIDIA Corporation (US:NVDA) , and JPMorgan Chase & Co. (US:JPM) . Xcel Wealth Management, LLC’s new positions include Easterly Government Properties, Inc. (US:DEA) , Tanger Inc. (US:SKT) , Barrick Mining Corporation (US:B) , .
Top Increases This Quarter
We use the change in the portfolio allocation because this is the most meaningful metric. Changes can be due to trades or changes in share prices.
| Security | Shares (MM) |
Value (MM$) |
Portfolio % | ΔPortfolio % |
|---|---|---|---|---|
| 0.04 | 9.28 | 2.6410 | 1.3314 | |
| 0.01 | 6.34 | 1.8037 | 0.9775 | |
| 0.09 | 14.03 | 3.9945 | 0.9502 | |
| 0.13 | 2.99 | 0.8497 | 0.8497 | |
| 0.03 | 7.38 | 2.1009 | 0.7634 | |
| 0.08 | 2.39 | 0.6814 | 0.6814 | |
| 0.14 | 30.00 | 8.5389 | 0.6394 | |
| 0.04 | 3.60 | 1.0248 | 0.4361 | |
| 0.00 | 2.35 | 0.6697 | 0.4021 | |
| 0.01 | 1.20 | 0.3414 | 0.3414 |
Top Decreases This Quarter
We use the change in the portfolio allocation because this is the most meaningful metric. Changes can be due to trades or changes in share prices.
| Security | Shares (MM) |
Value (MM$) |
Portfolio % | ΔPortfolio % |
|---|---|---|---|---|
| 0.11 | 21.53 | 6.1266 | -3.1780 | |
| 0.08 | 0.71 | 0.2025 | -0.8415 | |
| 0.06 | 10.53 | 2.9975 | -0.8280 | |
| 0.09 | 4.03 | 1.1459 | -0.6934 | |
| 0.05 | 10.61 | 3.0196 | -0.6233 | |
| 0.20 | 4.84 | 1.3773 | -0.4331 | |
| 0.01 | 6.25 | 1.7801 | -0.4304 | |
| 0.00 | 0.45 | 0.1271 | -0.3004 | |
| 0.00 | 0.25 | 0.0713 | -0.2002 | |
| 0.06 | 1.88 | 0.5337 | -0.1604 |
13F and Fund Filings
This form was filed on 2025-07-15 for the reporting period 2025-06-30. Click the link icon to see the full transaction history.
Upgrade to unlock premium data and export to Excel ![]() .
.
| Security | Type | Avg Share Price | Shares (MM) |
ΔShares (%) |
ΔShares (%) |
Value ($MM) |
Portfolio (%) |
ΔPortfolio (%) |
|
|---|---|---|---|---|---|---|---|---|---|
| AMZN / Amazon.com, Inc. | 0.14 | 2.63 | 30.00 | 18.34 | 8.5389 | 0.6394 | |||
| RH / RH | 0.11 | -10.60 | 21.53 | -27.91 | 6.1266 | -3.1780 | |||
| BAC / Bank of America Corporation | 0.36 | -0.44 | 16.87 | 12.90 | 4.8007 | 0.1452 | |||
| NVDA / NVIDIA Corporation | 0.09 | -1.45 | 14.03 | 43.66 | 3.9945 | 0.9502 | |||
| JPM / JPMorgan Chase & Co. | 0.04 | -0.48 | 12.50 | 17.62 | 3.5570 | 0.2461 | |||
| HD / The Home Depot, Inc. | 0.03 | 5.20 | 12.12 | 5.25 | 3.4493 | -0.1388 | |||
| F / Ford Motor Company | 1.07 | -0.88 | 11.59 | 7.24 | 3.2987 | -0.0693 | |||
| AAPL / Apple Inc. | 0.05 | -1.75 | 10.61 | -9.25 | 3.0196 | -0.6233 | |||
| GOOGL / Alphabet Inc. | 0.06 | -24.72 | 10.53 | -14.22 | 2.9975 | -0.8280 | |||
| COF / Capital One Financial Corporation | 0.04 | 86.07 | 9.28 | 120.82 | 2.6410 | 1.3314 | |||
| BA / The Boeing Company | 0.04 | -1.31 | 9.20 | 21.23 | 2.6182 | 0.2539 | |||
| AVGO / Broadcom Inc. | 0.03 | 4.45 | 7.38 | 71.97 | 2.1009 | 0.7634 | |||
| MS / Morgan Stanley | 0.05 | -0.81 | 6.98 | 19.76 | 1.9873 | 0.1705 | |||
| BAC.PRL / Bank of America Corporation - Preferred Stock | 0.01 | 143.25 | 6.34 | 139.04 | 1.8037 | 0.9775 | |||
| BRK.B / Berkshire Hathaway Inc. | 0.01 | -3.34 | 6.25 | -11.83 | 1.7801 | -0.4304 | |||
| WHR / Whirlpool Corporation | 0.06 | -3.24 | 5.77 | 8.89 | 1.6426 | -0.0090 | |||
| DIS / The Walt Disney Company | 0.04 | 1.06 | 5.28 | 26.97 | 1.5020 | 0.2069 | |||
| UBER / Uber Technologies, Inc. | 0.05 | -1.84 | 5.07 | 25.69 | 1.4441 | 0.1863 | |||
| NEE / NextEra Energy, Inc. | 0.07 | 13.17 | 5.05 | 10.83 | 1.4362 | 0.0173 | |||
| WMT / Walmart Inc. | 0.05 | -4.38 | 4.93 | 6.52 | 1.4034 | -0.0392 | |||
| PANW / Palo Alto Networks, Inc. | 0.02 | -2.03 | 4.92 | 17.49 | 1.4012 | 0.0955 | |||
| PFE / Pfizer Inc. | 0.20 | -12.93 | 4.84 | -16.70 | 1.3773 | -0.4331 | |||
| GE / General Electric Company | 0.02 | -0.17 | 4.67 | 28.39 | 1.3284 | 0.1955 | |||
| NOW / ServiceNow, Inc. | 0.00 | -3.09 | 4.65 | 25.15 | 1.3229 | 0.1656 | |||
| VOO / Vanguard Index Funds - Vanguard S&P 500 ETF | 0.01 | -2.02 | 4.60 | 8.29 | 1.3089 | -0.0143 | |||
| VZ / Verizon Communications Inc. | 0.09 | -28.50 | 4.03 | -31.79 | 1.1459 | -0.6934 | |||
| CAVA / CAVA Group, Inc. | 0.04 | 95.51 | 3.60 | 90.58 | 1.0248 | 0.4361 | |||
| TSLA / Tesla, Inc. | 0.01 | -1.22 | 3.49 | 21.08 | 0.9942 | 0.0952 | |||
| TOST / Toast, Inc. | 0.08 | 5.50 | 3.47 | 40.91 | 0.9882 | 0.2202 | |||
| FRT / Federal Realty Investment Trust | 0.04 | -0.73 | 3.46 | -3.62 | 0.9842 | -0.1336 | |||
| AXP / American Express Company | 0.01 | 3.07 | 3.21 | 22.21 | 0.9145 | 0.0952 | |||
| META / Meta Platforms, Inc. | 0.00 | 1.89 | 3.18 | 30.50 | 0.9050 | 0.1457 | |||
| DEA / Easterly Government Properties, Inc. | 0.13 | 2.99 | 0.8497 | 0.8497 | |||||
| CRWD / CrowdStrike Holdings, Inc. | 0.01 | 0.45 | 2.93 | 45.10 | 0.8352 | 0.2051 | |||
| PLTR / Palantir Technologies Inc. | 0.02 | 6.41 | 2.83 | 71.91 | 0.8051 | 0.2922 | |||
| SCHW / The Charles Schwab Corporation | 0.03 | -0.09 | 2.57 | 16.45 | 0.7315 | 0.0438 | |||
| TJX / The TJX Companies, Inc. | 0.02 | 3.69 | 2.48 | 5.13 | 0.7063 | -0.0293 | |||
| LEVI / Levi Strauss & Co. | 0.13 | 22.33 | 2.48 | 45.09 | 0.7063 | 0.1733 | |||
| COST / Costco Wholesale Corporation | 0.00 | 0.04 | 2.47 | 4.70 | 0.7044 | -0.0321 | |||
| SKT / Tanger Inc. | 0.08 | 2.39 | 0.6814 | 0.6814 | |||||
| WFC / Wells Fargo & Company | 0.03 | 1.03 | 2.39 | 12.77 | 0.6812 | 0.0198 | |||
| MSFT / Microsoft Corporation | 0.00 | 106.77 | 2.35 | 174.24 | 0.6697 | 0.4021 | |||
| PRU / Prudential Financial, Inc. | 0.02 | -4.10 | 1.99 | -7.76 | 0.5651 | -0.1055 | |||
| V / Visa Inc. | 0.01 | 0.50 | 1.92 | 1.86 | 0.5468 | -0.0412 | |||
| ABT / Abbott Laboratories | 0.01 | -12.84 | 1.91 | -10.63 | 0.5431 | -0.1222 | |||
| YETI / YETI Holdings, Inc. | 0.06 | -11.60 | 1.88 | -15.81 | 0.5337 | -0.1604 | |||
| QQQ / Invesco QQQ Trust, Series 1 | 0.00 | 6.70 | 1.87 | 25.55 | 0.5329 | 0.0681 | |||
| BX / Blackstone Inc. | 0.01 | -1.47 | 1.81 | 5.41 | 0.5156 | -0.0198 | |||
| GS / The Goldman Sachs Group, Inc. | 0.00 | 36.92 | 1.79 | 77.43 | 0.5102 | 0.1953 | |||
| GRMN / Garmin Ltd. | 0.01 | 0.00 | 1.68 | -3.85 | 0.4768 | -0.0662 | |||
| AMD / Advanced Micro Devices, Inc. | 0.01 | -6.97 | 1.66 | 28.51 | 0.4724 | 0.0699 | |||
| T / AT&T Inc. | 0.06 | -17.35 | 1.63 | -15.44 | 0.4633 | -0.1364 | |||
| BLK / BlackRock, Inc. | 0.00 | 2.03 | 1.58 | 13.17 | 0.4500 | 0.0144 | |||
| CAT / Caterpillar Inc. | 0.00 | 12.47 | 1.54 | 32.39 | 0.4375 | 0.0757 | |||
| XLF / The Select Sector SPDR Trust - The Financial Select Sector SPDR Fund | 0.03 | 0.00 | 1.38 | 5.17 | 0.3941 | -0.0163 | |||
| RTX / RTX Corporation | 0.01 | -2.89 | 1.36 | 7.00 | 0.3876 | -0.0088 | |||
| SOFI / SoFi Technologies, Inc. | 0.07 | -3.90 | 1.28 | 50.53 | 0.3656 | 0.0996 | |||
| SGOL / abrdn Gold ETF Trust - abrdn Physical Gold Shares ETF | 0.04 | -0.05 | 1.27 | 5.75 | 0.3609 | -0.0129 | |||
| PPL / PPL Corporation | 0.04 | -3.98 | 1.22 | -9.93 | 0.3486 | -0.0749 | |||
| FDX / FedEx Corporation | 0.01 | 1.20 | 0.3414 | 0.3414 | |||||
| GOOG / Alphabet Inc. | 0.01 | -8.88 | 1.17 | 3.44 | 0.3340 | -0.0195 | |||
| XLK / The Select Sector SPDR Trust - The Technology Select Sector SPDR Fund | 0.00 | 7.27 | 1.16 | 31.59 | 0.3296 | 0.0553 | |||
| NFLX / Netflix, Inc. | 0.00 | 61.99 | 1.07 | 132.97 | 0.3038 | 0.1608 | |||
| GBAB / Guggenheim Taxable Municipal Bond & Investment Grade Debt Trust | 0.07 | -0.58 | 1.03 | -3.82 | 0.2942 | -0.0408 | |||
| BXP / Boston Properties, Inc. | 0.02 | -3.82 | 1.02 | -3.42 | 0.2900 | -0.0387 | |||
| MDB / MongoDB, Inc. | 0.00 | -6.03 | 0.98 | 12.50 | 0.2794 | 0.0075 | |||
| SBUX / Starbucks Corporation | 0.01 | 112.23 | 0.96 | 98.56 | 0.2742 | 0.1228 | |||
| BMY / Bristol-Myers Squibb Company | 0.02 | -4.55 | 0.96 | -27.55 | 0.2733 | -0.1397 | |||
| GEV / GE Vernova Inc. | 0.00 | 0.12 | 0.90 | 73.64 | 0.2551 | 0.0942 | |||
| GLD / SPDR Gold Trust | 0.00 | 0.00 | 0.85 | 5.83 | 0.2429 | -0.0085 | |||
| MDT / Medtronic plc | 0.01 | -12.05 | 0.85 | -14.74 | 0.2421 | -0.0686 | |||
| SO / The Southern Company | 0.01 | 4.93 | 0.85 | 4.81 | 0.2416 | -0.0108 | |||
| GMED / Globus Medical, Inc. | 0.01 | -0.44 | 0.81 | -19.74 | 0.2292 | -0.0834 | |||
| DE / Deere & Company | 0.00 | 0.39 | 0.78 | 8.81 | 0.2216 | -0.0015 | |||
| BRO / Brown & Brown, Inc. | 0.01 | 0.00 | 0.76 | -10.94 | 0.2156 | -0.0493 | |||
| BRK.A / Berkshire Hathaway Inc. | 0.00 | 0.00 | 0.73 | -8.77 | 0.2074 | -0.0414 | |||
| BLMN / Bloomin' Brands, Inc. | 0.08 | -82.31 | 0.71 | -78.78 | 0.2025 | -0.8415 | |||
| JEPQ / J.P. Morgan Exchange-Traded Fund Trust - JPMorgan Nasdaq Equity Premium Income ETF | 0.01 | 18.59 | 0.69 | 24.64 | 0.1960 | 0.0238 | |||
| B / Barrick Mining Corporation | 0.03 | 0.69 | 0.1958 | 0.1958 | |||||
| CELH / Celsius Holdings, Inc. | 0.01 | -37.77 | 0.69 | -18.99 | 0.1958 | -0.0687 | |||
| MAS / Masco Corporation | 0.01 | -4.75 | 0.65 | -11.76 | 0.1836 | -0.0444 | |||
| CRM / Salesforce, Inc. | 0.00 | -1.05 | 0.64 | 0.47 | 0.1824 | -0.0162 | |||
| SPY / SPDR S&P 500 ETF | 0.00 | 0.49 | 0.64 | 10.99 | 0.1811 | 0.0025 | |||
| WM / Waste Management, Inc. | 0.00 | -4.69 | 0.63 | -5.81 | 0.1800 | -0.0292 | |||
| PM / Philip Morris International Inc. | 0.00 | 13.49 | 0.63 | 30.15 | 0.1784 | 0.0284 | |||
| PG / The Procter & Gamble Company | 0.00 | -18.80 | 0.60 | -24.01 | 0.1694 | -0.0749 | |||
| SHOP / Shopify Inc. | 0.01 | -19.37 | 0.59 | -2.64 | 0.1685 | -0.0209 | |||
| XLC / The Select Sector SPDR Trust - The Communication Services Select Sector SPDR Fund | 0.01 | 0.00 | 0.56 | 12.68 | 0.1595 | 0.0043 | |||
| ABBV / AbbVie Inc. | 0.00 | 1.36 | 0.53 | -10.10 | 0.1495 | -0.0328 | |||
| XOM / Exxon Mobil Corporation | 0.00 | -11.02 | 0.52 | -19.34 | 0.1474 | -0.0527 | |||
| ARCC / Ares Capital Corporation | 0.02 | 16.89 | 0.51 | 15.91 | 0.1454 | 0.0080 | |||
| VGK / Vanguard International Equity Index Funds - Vanguard FTSE Europe ETF | 0.01 | 9.10 | 0.50 | 20.38 | 0.1430 | 0.0130 | |||
| LDOS / Leidos Holdings, Inc. | 0.00 | 0.00 | 0.49 | 17.06 | 0.1407 | 0.0089 | |||
| KO / The Coca-Cola Company | 0.01 | -6.00 | 0.46 | -7.26 | 0.1312 | -0.0235 | |||
| UPS / United Parcel Service, Inc. | 0.00 | -64.53 | 0.45 | -67.47 | 0.1271 | -0.3004 | |||
| HYMB / SPDR Series Trust - SPDR Nuveen ICE High Yield Municipal Bond ETF | 0.02 | 0.00 | 0.45 | -1.55 | 0.1269 | -0.0145 | |||
| LNG / Cheniere Energy, Inc. | 0.00 | 0.00 | 0.44 | 5.29 | 0.1248 | -0.0050 | |||
| MO / Altria Group, Inc. | 0.01 | 59.44 | 0.44 | 55.52 | 0.1246 | 0.0370 | |||
| DUK / Duke Energy Corporation | 0.00 | 16.18 | 0.43 | 12.57 | 0.1225 | 0.0032 | |||
| CVX / Chevron Corporation | 0.00 | 1.38 | 0.43 | -13.13 | 0.1224 | -0.0320 | |||
| AMGN / Amgen Inc. | 0.00 | 0.00 | 0.41 | -10.35 | 0.1160 | -0.0257 | |||
| MA / Mastercard Incorporated | 0.00 | 0.98 | 0.40 | 3.59 | 0.1150 | -0.0066 | |||
| PEP / PepsiCo, Inc. | 0.00 | -14.40 | 0.40 | -24.67 | 0.1148 | -0.0520 | |||
| HYD / VanEck ETF Trust - VanEck High Yield Muni ETF | 0.01 | 0.00 | 0.40 | -1.72 | 0.1136 | -0.0132 | |||
| MAGS / Listed Funds Trust - Roundhill Magnificent Seven ETF | 0.01 | 11.70 | 0.40 | 35.49 | 0.1130 | 0.0214 | |||
| TMUS / T-Mobile US, Inc. | 0.00 | 0.00 | 0.36 | -10.75 | 0.1017 | -0.0229 | |||
| FTC / First Trust Exchange-Traded AlphaDEX Fund - First Trust Large Cap Growth AlphaDEX Fund | 0.00 | 0.00 | 0.35 | 14.71 | 0.1002 | 0.0047 | |||
| IWM / iShares Trust - iShares Russell 2000 ETF | 0.00 | -0.74 | 0.35 | 7.45 | 0.0986 | -0.0019 | |||
| ABNB / Airbnb, Inc. | 0.00 | -3.68 | 0.35 | 6.79 | 0.0985 | -0.0026 | |||
| ET / Energy Transfer LP - Limited Partnership | 0.02 | 30.58 | 0.33 | 27.52 | 0.0937 | 0.0131 | |||
| LLY / Eli Lilly and Company | 0.00 | 0.33 | 0.0927 | 0.0927 | |||||
| FERG / Ferguson Enterprises Inc. | 0.00 | -1.13 | 0.33 | 34.30 | 0.0926 | 0.0171 | |||
| FHLC / Fidelity Covington Trust - Fidelity MSCI Health Care Index ETF | 0.01 | 0.00 | 0.32 | -6.45 | 0.0910 | -0.0154 | |||
| ORCL / Oracle Corporation | 0.00 | 0.32 | 0.0902 | 0.0902 | |||||
| RDVY / First Trust Exchange-Traded Fund VI - First Trust Rising Dividend Achievers ETF | 0.00 | 0.00 | 0.30 | 7.07 | 0.0865 | -0.0019 | |||
| IVV / iShares Trust - iShares Core S&P 500 ETF | 0.00 | -4.64 | 0.29 | 5.40 | 0.0837 | -0.0033 | |||
| BP / BP p.l.c. - Depositary Receipt (Common Stock) | 0.01 | -0.83 | 0.29 | -12.05 | 0.0832 | -0.0205 | |||
| NKE / NIKE, Inc. | 0.00 | 0.29 | 0.0820 | 0.0820 | |||||
| FMHI / First Trust Exchange-Traded Fund III - First Trust Municipal High Income ETF | 0.01 | 0.00 | 0.28 | -2.10 | 0.0797 | -0.0096 | |||
| IP / International Paper Company | 0.01 | -0.83 | 0.28 | -13.12 | 0.0793 | -0.0204 | |||
| TWLO / Twilio Inc. | 0.00 | -6.31 | 0.28 | 18.97 | 0.0788 | 0.0063 | |||
| MU / Micron Technology, Inc. | 0.00 | -62.80 | 0.28 | -47.32 | 0.0785 | -0.0843 | |||
| EVT / Eaton Vance Tax-Advantaged Dividend Income Fund | 0.01 | 0.00 | 0.27 | 3.79 | 0.0780 | -0.0045 | |||
| MRVL / Marvell Technology, Inc. | 0.00 | -77.12 | 0.25 | -71.30 | 0.0713 | -0.2002 | |||
| ADP / Automatic Data Processing, Inc. | 0.00 | -26.45 | 0.25 | -25.89 | 0.0710 | -0.0337 | |||
| ETN / Eaton Corporation plc | 0.00 | 0.24 | 0.0682 | 0.0682 | |||||
| ARES / Ares Management Corporation | 0.00 | 0.23 | 0.0641 | 0.0641 | |||||
| LIN / Linde plc | 0.00 | 1.05 | 0.22 | 1.82 | 0.0640 | -0.0048 | |||
| CIK / Credit Suisse Asset Management Income Fund, Inc. | 0.02 | 0.00 | 0.05 | 2.22 | 0.0133 | -0.0010 | |||
| AWK / American Water Works Company, Inc. | 0.00 | -100.00 | 0.00 | 0.0000 | |||||
| UNH / UnitedHealth Group Incorporated | 0.00 | -100.00 | 0.00 | 0.0000 | |||||
| NWL / Newell Brands Inc. | 0.00 | -100.00 | 0.00 | 0.0000 | |||||
| TGT / Target Corporation | 0.00 | -100.00 | 0.00 | 0.0000 | |||||
| SBCF / Seacoast Banking Corporation of Florida | 0.00 | -100.00 | 0.00 | 0.0000 | |||||
| DEA / Easterly Government Properties, Inc. | 0.00 | -100.00 | 0.00 | 0.0000 | |||||
| GOLD / Barrick Mining Corporation | 0.00 | -100.00 | 0.00 | 0.0000 | |||||
| DD / DuPont de Nemours, Inc. | 0.00 | -100.00 | 0.00 | 0.0000 | |||||
| RYN / Rayonier Inc. | 0.00 | -100.00 | 0.00 | 0.0000 |