Basic Stats
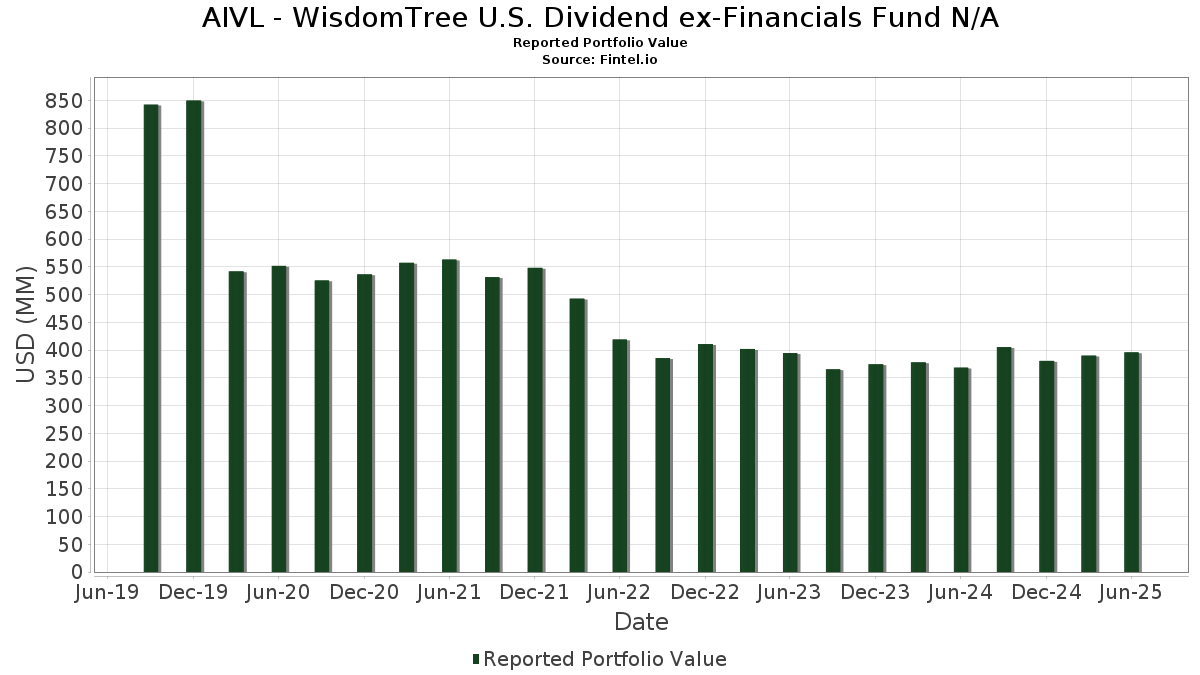
| Portfolio Value | $ 395,833,352 |
| Current Positions | 108 |
Latest Holdings, Performance, AUM (from 13F, 13D)
AIVL - WisdomTree U.S. Dividend ex-Financials Fund N/A has disclosed 108 total holdings in their latest SEC filings. Most recent portfolio value is calculated to be $ 395,833,352 USD. Actual Assets Under Management (AUM) is this value plus cash (which is not disclosed). AIVL - WisdomTree U.S. Dividend ex-Financials Fund N/A’s top holdings are Exxon Mobil Corporation (US:XOM) , U.S. Bancorp (US:USB) , RTX Corporation (US:RTX) , Teledyne Technologies Incorporated (US:TDY) , and Roper Technologies, Inc. (US:ROP) . AIVL - WisdomTree U.S. Dividend ex-Financials Fund N/A’s new positions include S&P Global Inc. (US:SPGI) , Cboe Global Markets, Inc. (US:CBOE) , Ralliant Corporation (US:RAL) , Lowe's Companies, Inc. (US:LOW) , and TransDigm Group Incorporated (US:TDG) .
Top Increases This Quarter
We use the change in the portfolio allocation because this is the most meaningful metric. Changes can be due to trades or changes in share prices.
| Security | Shares (MM) |
Value (MM$) |
Portfolio % | ΔPortfolio % |
|---|---|---|---|---|
| 0.01 | 4.74 | 1.2148 | 1.2148 | |
| 0.05 | 4.51 | 1.1563 | 1.1563 | |
| 0.02 | 4.38 | 1.1234 | 1.1234 | |
| 0.07 | 3.19 | 0.8189 | 0.8189 | |
| 0.07 | 3.19 | 0.8189 | 0.8189 | |
| 0.03 | 4.42 | 1.1317 | 0.8044 | |
| 0.04 | 3.84 | 0.9850 | 0.7462 | |
| 0.28 | 12.79 | 3.2784 | 0.7418 | |
| 0.05 | 2.43 | 0.6236 | 0.6236 | |
| 0.11 | 10.14 | 2.5981 | 0.6073 |
Top Decreases This Quarter
We use the change in the portfolio allocation because this is the most meaningful metric. Changes can be due to trades or changes in share prices.
| Security | Shares (MM) |
Value (MM$) |
Portfolio % | ΔPortfolio % |
|---|---|---|---|---|
| 0.05 | 2.87 | 0.7346 | -1.8362 | |
| 0.04 | 4.01 | 1.0274 | -1.3676 | |
| 0.03 | 5.13 | 1.3151 | -0.8936 | |
| 0.00 | 0.97 | 0.2493 | -0.8732 | |
| 0.00 | 0.99 | 0.2527 | -0.7261 | |
| 0.12 | 12.83 | 3.2881 | -0.7183 | |
| 0.15 | 7.85 | 2.0111 | -0.6607 | |
| 0.05 | 4.36 | 1.1180 | -0.5969 | |
| 0.06 | 11.04 | 2.8304 | -0.5890 | |
| 0.24 | 9.69 | 2.4842 | -0.5814 |
13F and Fund Filings
This form was filed on 2025-08-29 for the reporting period 2025-06-30. Click the link icon to see the full transaction history.
Upgrade to unlock premium data and export to Excel ![]() .
.
| Security | Type | Avg Share Price | Shares (MM) |
ΔShares (%) |
ΔShares (%) |
Value ($MM) |
Portfolio (%) |
ΔPortfolio (%) |
|
|---|---|---|---|---|---|---|---|---|---|
| XOM / Exxon Mobil Corporation | 0.12 | -8.76 | 12.83 | -17.30 | 3.2881 | -0.7183 | |||
| USB / U.S. Bancorp | 0.28 | 21.52 | 12.79 | 30.24 | 3.2784 | 0.7418 | |||
| RTX / RTX Corporation | 0.08 | -1.41 | 12.04 | 8.70 | 3.0851 | 0.2247 | |||
| TDY / Teledyne Technologies Incorporated | 0.02 | -0.38 | 11.93 | 2.54 | 3.0581 | 0.0529 | |||
| ROP / Roper Technologies, Inc. | 0.02 | -3.59 | 11.92 | -7.30 | 3.0541 | -0.2661 | |||
| ICE / Intercontinental Exchange, Inc. | 0.06 | -21.57 | 11.04 | -16.59 | 2.8304 | -0.5890 | |||
| BAC / Bank of America Corporation | 0.21 | 4.20 | 10.14 | 18.17 | 2.5989 | 0.3825 | |||
| NDAQ / Nasdaq, Inc. | 0.11 | 11.57 | 10.14 | 31.52 | 2.5981 | 0.6073 | |||
| NI / NiSource Inc. | 0.24 | -18.85 | 9.69 | -18.34 | 2.4842 | -0.5814 | |||
| MDT / Medtronic plc | 0.11 | 4.94 | 9.59 | 1.79 | 2.4592 | 0.0248 | |||
| CMCSA / Comcast Corporation | 0.27 | 2.81 | 9.54 | -0.56 | 2.4449 | -0.0328 | |||
| CNP / CenterPoint Energy, Inc. | 0.23 | -17.16 | 8.48 | -15.99 | 2.1727 | -0.4336 | |||
| CSX / CSX Corporation | 0.25 | 1.66 | 8.15 | 12.71 | 2.0883 | 0.2213 | |||
| FTV / Fortive Corporation | 0.15 | 6.48 | 7.85 | -24.15 | 2.0111 | -0.6607 | |||
| HON / Honeywell International Inc. | 0.03 | 15.12 | 7.59 | 26.62 | 1.9446 | 0.3968 | |||
| HPE / Hewlett Packard Enterprise Company | 0.36 | 9.92 | 7.29 | 45.69 | 1.8684 | 0.5760 | |||
| DHR / Danaher Corporation | 0.03 | 44.69 | 6.49 | 39.41 | 1.6631 | 0.4610 | |||
| CW / Curtiss-Wright Corporation | 0.01 | -3.28 | 6.16 | 48.94 | 1.5781 | 0.5103 | |||
| SRE / Sempra | 0.07 | 33.99 | 5.64 | 42.28 | 1.4450 | 0.4215 | |||
| OTIS / Otis Worldwide Corporation | 0.06 | 0.08 | 5.45 | -3.96 | 1.3976 | -0.0691 | |||
| HWM / Howmet Aerospace Inc. | 0.03 | -58.18 | 5.13 | -40.00 | 1.3151 | -0.8936 | |||
| AM / Antero Midstream Corporation | 0.27 | -14.15 | 5.12 | -9.61 | 1.3134 | -0.1509 | |||
| MO / Altria Group, Inc. | 0.09 | -22.71 | 5.00 | -24.51 | 1.2825 | -0.4292 | |||
| PPG / PPG Industries, Inc. | 0.04 | -0.29 | 4.76 | 3.72 | 1.2210 | 0.0347 | |||
| SPGI / S&P Global Inc. | 0.01 | 4.74 | 1.2148 | 1.2148 | |||||
| FDS / FactSet Research Systems Inc. | 0.01 | -4.14 | 4.70 | -5.69 | 1.2059 | -0.0826 | |||
| WMT / Walmart Inc. | 0.05 | 4.51 | 1.1563 | 1.1563 | |||||
| PCG / PG&E Corporation | 0.32 | -2.68 | 4.46 | -21.04 | 1.1438 | -0.3159 | |||
| DDOG / Datadog, Inc. | 0.03 | 157.36 | 4.42 | 248.46 | 1.1317 | 0.8044 | |||
| CBOE / Cboe Global Markets, Inc. | 0.02 | 4.38 | 1.1234 | 1.1234 | |||||
| WFC / Wells Fargo & Company | 0.05 | -41.13 | 4.36 | -34.30 | 1.1180 | -0.5969 | |||
| CI / The Cigna Group | 0.01 | -47.62 | 4.35 | -34.29 | 1.1152 | -0.4629 | |||
| A / Agilent Technologies, Inc. | 0.04 | -12.73 | 4.31 | -11.96 | 1.1037 | -0.1596 | |||
| TXT / Textron Inc. | 0.05 | -1.69 | 4.28 | 9.26 | 1.0973 | 0.0852 | |||
| BSX / Boston Scientific Corporation | 0.04 | 0.28 | 4.18 | 6.76 | 1.0722 | 0.0603 | |||
| RBLX / Roblox Corporation | 0.04 | -4.86 | 4.18 | 71.70 | 1.0718 | 0.4428 | |||
| BRO / Brown & Brown, Inc. | 0.04 | -51.50 | 4.01 | -56.77 | 1.0274 | -1.3676 | |||
| RGA / Reinsurance Group of America, Incorporated | 0.02 | -0.12 | 3.94 | 0.61 | 1.0089 | -0.0015 | |||
| SBUX / Starbucks Corporation | 0.04 | 320.56 | 3.84 | 322.31 | 0.9850 | 0.7462 | |||
| CNC / Centene Corporation | 0.07 | -3.47 | 3.84 | -13.68 | 0.9832 | -0.1648 | |||
| WY / Weyerhaeuser Company | 0.15 | 11.05 | 3.79 | -2.57 | 0.9726 | -0.0333 | |||
| KDP / Keurig Dr Pepper Inc. | 0.11 | -4.52 | 3.62 | -7.78 | 0.9273 | -0.0857 | |||
| CSCO / Cisco Systems, Inc. | 0.05 | -35.86 | 3.60 | -13.99 | 0.9220 | -0.1497 | |||
| SBAC / SBA Communications Corporation | 0.02 | -1.43 | 3.58 | 5.23 | 0.9179 | 0.0388 | |||
| BSY / Bentley Systems, Incorporated | 0.06 | -2.28 | 3.23 | 34.05 | 0.8286 | 0.2058 | |||
| QGEN / Qiagen N.V. | 0.07 | 21.47 | 3.19 | 45.38 | 0.8189 | 0.8189 | |||
| QGEN / Qiagen N.V. | 0.07 | 21.47 | 3.19 | 45.38 | 0.8189 | 0.8189 | |||
| HOLX / Hologic, Inc. | 0.05 | -13.29 | 3.19 | -8.54 | 0.8185 | -0.0833 | |||
| ESI / Element Solutions Inc | 0.13 | 5.18 | 3.03 | 5.36 | 0.7763 | 0.0339 | |||
| WMB / The Williams Companies, Inc. | 0.05 | -79.59 | 2.87 | -69.84 | 0.7346 | -1.8362 | |||
| LNC / Lincoln National Corporation | 0.08 | -1.39 | 2.85 | -5.00 | 0.7303 | -0.0443 | |||
| KMB / Kimberly-Clark Corporation | 0.02 | -3.02 | 2.84 | -12.10 | 0.7281 | -0.1065 | |||
| LHX / L3Harris Technologies, Inc. | 0.01 | -2.61 | 2.74 | 16.72 | 0.7034 | 0.0961 | |||
| ABNB / Airbnb, Inc. | 0.02 | 31.74 | 2.71 | 45.96 | 0.6953 | 0.2152 | |||
| UNP / Union Pacific Corporation | 0.01 | -0.60 | 2.68 | -3.18 | 0.6869 | -0.0281 | |||
| BRK.B / Berkshire Hathaway Inc. | 0.01 | 4.49 | 2.55 | -4.67 | 0.6541 | -0.0375 | |||
| BDX / Becton, Dickinson and Company | 0.01 | 121.69 | 2.53 | 66.73 | 0.6475 | 0.2561 | |||
| OXY / Occidental Petroleum Corporation | 0.06 | 18.80 | 2.52 | 1.13 | 0.6446 | 0.0022 | |||
| NSA / National Storage Affiliates Trust | 0.08 | -5.11 | 2.49 | -22.96 | 0.6382 | -0.1966 | |||
| XP / XP Inc. | 0.12 | 6.95 | 2.44 | 57.09 | 0.6251 | 0.2242 | |||
| RAL / Ralliant Corporation | 0.05 | 2.43 | 0.6236 | 0.6236 | |||||
| INTC / Intel Corporation | 0.11 | 114.88 | 2.39 | 111.96 | 0.6135 | 0.3218 | |||
| MMC / Marsh & McLennan Companies, Inc. | 0.01 | -4.15 | 2.36 | -14.13 | 0.6044 | -0.1048 | |||
| DCI / Donaldson Company, Inc. | 0.03 | -1.63 | 2.09 | 1.76 | 0.5350 | 0.0050 | |||
| FR / First Industrial Realty Trust, Inc. | 0.04 | -1.53 | 2.00 | -12.15 | 0.5116 | -0.0754 | |||
| HPQ / HP Inc. | 0.08 | -3.32 | 1.93 | -14.60 | 0.4950 | -0.0891 | |||
| LOW / Lowe's Companies, Inc. | 0.01 | 1.91 | 0.4905 | 0.4905 | |||||
| 37C / CNH Industrial N.V. | 0.15 | -0.68 | 1.88 | 4.85 | 0.4822 | 0.0186 | |||
| TMO / Thermo Fisher Scientific Inc. | 0.00 | 134.27 | 1.87 | 90.89 | 0.4781 | 0.2257 | |||
| TDG / TransDigm Group Incorporated | 0.00 | 1.85 | 0.4747 | 0.4747 | |||||
| DBX / Dropbox, Inc. | 0.06 | -2.35 | 1.84 | 4.61 | 0.4708 | 0.0171 | |||
| IR / Ingersoll Rand Inc. | 0.02 | -2.85 | 1.51 | 0.94 | 0.3875 | 0.0008 | |||
| HXL / Hexcel Corporation | 0.03 | 5.81 | 1.46 | 9.14 | 0.3736 | 0.0287 | |||
| DREYFUS TRSY OBLIG CASH M / STIV (000000000) | 1.39 | 1.39 | 0.3567 | 0.3567 | |||||
| DREYFUS TRSY OBLIG CASH M / STIV (000000000) | 1.39 | 1.39 | 0.3567 | 0.3567 | |||||
| NKE / NIKE, Inc. | 0.02 | 29.94 | 1.38 | 45.38 | 0.3549 | 0.1090 | |||
| MSTR / Strategy Inc | 0.00 | 1.35 | 0.3472 | 0.3472 | |||||
| RPM / RPM International Inc. | 0.01 | 17.28 | 1.34 | 11.37 | 0.3442 | 0.0327 | |||
| AMKR / Amkor Technology, Inc. | 0.06 | -13.56 | 1.33 | 0.45 | 0.3401 | -0.0010 | |||
| GEHC / GE HealthCare Technologies Inc. | 0.02 | 25.90 | 1.32 | 15.57 | 0.3387 | 0.0433 | |||
| IWD / iShares Trust - iShares Russell 1000 Value ETF | 0.01 | 46.65 | 1.27 | 51.37 | 0.3255 | 0.1088 | |||
| RYAN / Ryan Specialty Holdings, Inc. | 0.02 | -2.76 | 1.27 | -10.52 | 0.3248 | -0.0409 | |||
| LKQ / LKQ Corporation | 0.03 | -6.04 | 1.21 | -18.24 | 0.3102 | -0.0722 | |||
| HEI / HEICO Corporation | 0.00 | -28.64 | 1.19 | -12.41 | 0.3041 | -0.0457 | |||
| MDLZ / Mondelez International, Inc. | 0.02 | 1.18 | 0.3026 | 0.3026 | |||||
| DXC / DXC Technology Company | 0.07 | -0.45 | 1.11 | -10.70 | 0.2846 | -0.0367 | |||
| WEN / The Wendy's Company | 0.09 | 0.83 | 1.04 | -21.29 | 0.2654 | -0.0744 | |||
| TECH / Bio-Techne Corporation | 0.02 | 22.21 | 1.00 | 7.30 | 0.2564 | 0.0155 | |||
| FE / FirstEnergy Corp. | 0.02 | -2.57 | 0.99 | -2.93 | 0.2548 | -0.0098 | |||
| GD / General Dynamics Corporation | 0.00 | -86.88 | 0.99 | -81.66 | 0.2527 | -0.7261 | |||
| PEG / Public Service Enterprise Group Incorporated | 0.01 | -5.60 | 0.98 | 7.84 | 0.2506 | 0.0053 | |||
| UPS / United Parcel Service, Inc. | 0.01 | 14.05 | 0.97 | 4.73 | 0.2497 | 0.0093 | |||
| UNH / UnitedHealth Group Incorporated | 0.00 | -66.00 | 0.97 | -79.36 | 0.2493 | -0.8732 | |||
| AMT / American Tower Corporation | 0.00 | -8.24 | 0.97 | -6.74 | 0.2484 | -0.0202 | |||
| LMT / Lockheed Martin Corporation | 0.00 | -79.96 | 0.97 | -73.89 | 0.2479 | -0.4270 | |||
| JKHY / Jack Henry & Associates, Inc. | 0.01 | -5.42 | 0.96 | -6.68 | 0.2473 | -0.0197 | |||
| GNTX / Gentex Corporation | 0.04 | -3.75 | 0.96 | -9.19 | 0.2459 | -0.0269 | |||
| ASH / Ashland Inc. | 0.02 | 17.68 | 0.96 | -0.21 | 0.2450 | -0.0024 | |||
| AMCR / Amcor plc | 0.10 | 3.89 | 0.95 | -1.56 | 0.2434 | -0.0058 | |||
| ZBH / Zimmer Biomet Holdings, Inc. | 0.01 | 8.42 | 0.93 | -12.66 | 0.2387 | -0.0366 | |||
| M / Macy's, Inc. | 0.08 | -40.69 | 0.92 | -44.93 | 0.2366 | -0.1964 | |||
| EG / Everest Group, Ltd. | 0.00 | -2.48 | 0.92 | -8.81 | 0.2362 | -0.0247 | |||
| IEX / IDEX Corporation | 0.01 | 3.22 | 0.92 | 0.11 | 0.2349 | -0.0015 | |||
| REYN / Reynolds Consumer Products Inc. | 0.04 | 6.20 | 0.91 | -4.60 | 0.2340 | -0.0133 | |||
| PINC / Premier, Inc. | 0.04 | -24.22 | 0.90 | -13.82 | 0.2302 | -0.0389 | |||
| MPW / Medical Properties Trust, Inc. | 0.21 | -8.34 | 0.89 | -34.49 | 0.2275 | -0.1224 | |||
| DREY INST PREF GOV MM-M / STIV (000000000) | 0.78 | 0.78 | 0.1994 | 0.1994 | |||||
| DREY INST PREF GOV MM-M / STIV (000000000) | 0.78 | 0.78 | 0.1994 | 0.1994 |