Basic Stats
| Portfolio Value | $ 495,718 |
| Current Positions | 74 |
Latest Holdings, Performance, AUM (from 13F, 13D)
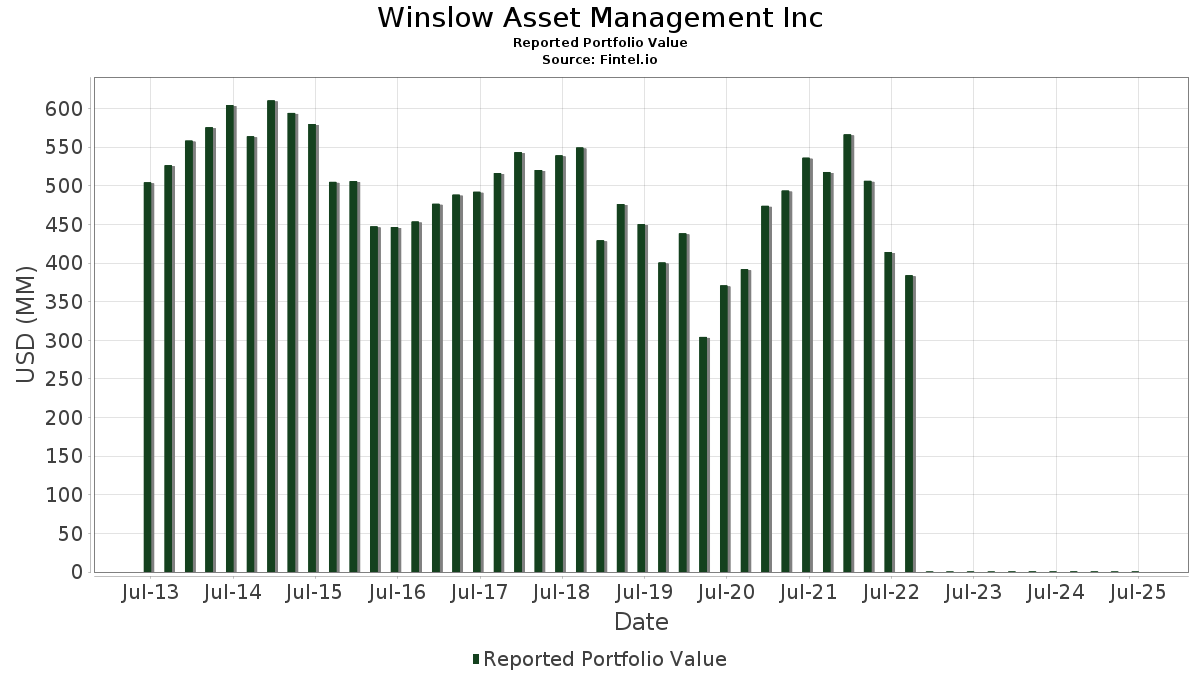
Winslow Asset Management Inc has disclosed 74 total holdings in their latest SEC filings. Most recent portfolio value is calculated to be $ 495,718 USD. Actual Assets Under Management (AUM) is this value plus cash (which is not disclosed). Winslow Asset Management Inc’s top holdings are Apple Inc. (US:AAPL) , Oracle Corporation (US:ORCL) , PulteGroup, Inc. (US:PHM) , Eli Lilly and Company (US:LLY) , and Tenet Healthcare Corporation (US:THC) .
Top Increases This Quarter
We use the change in the portfolio allocation because this is the most meaningful metric. Changes can be due to trades or changes in share prices.
| Security | Shares (MM) |
Value (MM$) |
Portfolio % | ΔPortfolio % |
|---|---|---|---|---|
| 0.12 | 0.03 | 5.4973 | 1.6220 | |
| 0.13 | 0.02 | 4.5155 | 0.7240 | |
| 0.15 | 0.01 | 2.8736 | 0.4468 | |
| 0.45 | 0.02 | 3.2488 | 0.4126 | |
| 0.03 | 0.01 | 2.0298 | 0.3512 | |
| 0.04 | 0.01 | 1.8448 | 0.2724 | |
| 0.07 | 0.01 | 1.8303 | 0.2719 | |
| 0.07 | 0.02 | 3.8526 | 0.2716 | |
| 0.02 | 0.01 | 1.6812 | 0.2517 | |
| 0.14 | 0.01 | 1.4918 | 0.2412 |
Top Decreases This Quarter
We use the change in the portfolio allocation because this is the most meaningful metric. Changes can be due to trades or changes in share prices.
| Security | Shares (MM) |
Value (MM$) |
Portfolio % | ΔPortfolio % |
|---|---|---|---|---|
| 0.17 | 0.03 | 6.9146 | -1.4029 | |
| 0.03 | 0.03 | 5.0676 | -0.7768 | |
| 0.05 | 0.01 | 2.3933 | -0.6521 | |
| 0.17 | 0.01 | 1.1666 | -0.3977 | |
| 0.09 | 0.01 | 1.3701 | -0.3225 | |
| 0.24 | 0.03 | 5.0926 | -0.2995 | |
| 0.07 | 0.01 | 1.7837 | -0.2867 | |
| 0.02 | 0.01 | 1.1886 | -0.2619 | |
| 0.10 | 0.01 | 1.5872 | -0.2383 | |
| 0.15 | 0.00 | 0.7823 | -0.2322 |
13F and Fund Filings
This form was filed on 2025-08-13 for the reporting period 2025-06-30. Click the link icon to see the full transaction history.
Upgrade to unlock premium data and export to Excel ![]() .
.
| Security | Type | Avg Share Price | Shares (MM) |
ΔShares (%) |
ΔShares (%) |
Value ($MM) |
Portfolio (%) |
ΔPortfolio (%) |
|
|---|---|---|---|---|---|---|---|---|---|
| AAPL / Apple Inc. | 0.17 | -1.57 | 0.03 | -8.11 | 6.9146 | -1.4029 | |||
| ORCL / Oracle Corporation | 0.12 | -0.80 | 0.03 | 58.82 | 5.4973 | 1.6220 | |||
| PHM / PulteGroup, Inc. | 0.24 | 0.68 | 0.03 | 4.17 | 5.0926 | -0.2995 | |||
| LLY / Eli Lilly and Company | 0.03 | 0.46 | 0.03 | -3.85 | 5.0676 | -0.7768 | |||
| THC / Tenet Healthcare Corporation | 0.13 | -0.47 | 0.02 | 29.41 | 4.5155 | 0.7240 | |||
| JPM / JPMorgan Chase & Co. | 0.07 | -0.46 | 0.02 | 18.75 | 3.8526 | 0.2716 | |||
| TTEK / Tetra Tech, Inc. | 0.45 | 1.89 | 0.02 | 33.33 | 3.2488 | 0.4126 | |||
| SCHW / The Charles Schwab Corporation | 0.16 | 0.57 | 0.01 | 16.67 | 2.9474 | 0.1976 | |||
| UBER / Uber Technologies, Inc. | 0.15 | 1.12 | 0.01 | 27.27 | 2.8736 | 0.4468 | |||
| TER / Teradyne, Inc. | 0.14 | 1.00 | 0.01 | 18.18 | 2.6277 | 0.0142 | |||
| IBM / International Business Machines Corporation | 0.04 | 0.71 | 0.01 | 20.00 | 2.5502 | 0.2143 | |||
| NDSN / Nordson Corporation | 0.06 | 0.63 | 0.01 | 9.09 | 2.4972 | -0.0565 | |||
| LULU / lululemon athletica inc. | 0.05 | 2.39 | 0.01 | -15.38 | 2.3933 | -0.6521 | |||
| BZH / Beazer Homes USA, Inc. | 0.49 | 2.28 | 0.01 | 11.11 | 2.2041 | 0.0561 | |||
| MC / Moelis & Company | 0.17 | 0.94 | 0.01 | 11.11 | 2.1442 | -0.0312 | |||
| AXP / American Express Company | 0.03 | 1.47 | 0.01 | 25.00 | 2.1264 | 0.1935 | |||
| ETN / Eaton Corporation plc | 0.03 | 0.70 | 0.01 | 42.86 | 2.0298 | 0.3512 | |||
| VRRM / Verra Mobility Corporation | 0.37 | 1.31 | 0.01 | 12.50 | 1.8979 | 0.0816 | |||
| TPR / Tapestry, Inc. | 0.11 | 0.29 | 0.01 | 28.57 | 1.8870 | 0.2371 | |||
| CSCO / Cisco Systems, Inc. | 0.13 | 0.83 | 0.01 | 12.50 | 1.8599 | 0.0658 | |||
| BA / The Boeing Company | 0.04 | 4.42 | 0.01 | 28.57 | 1.8448 | 0.2724 | |||
| DIS / The Walt Disney Company | 0.07 | 2.22 | 0.01 | 28.57 | 1.8303 | 0.2719 | |||
| EOG / EOG Resources, Inc. | 0.07 | 1.01 | 0.01 | -11.11 | 1.7837 | -0.2867 | |||
| ULTA / Ulta Beauty, Inc. | 0.02 | 0.76 | 0.01 | 33.33 | 1.6812 | 0.2517 | |||
| DE / Deere & Company | 0.02 | 0.46 | 0.01 | 14.29 | 1.6675 | -0.0080 | |||
| LIN / Linde plc | 0.02 | 1.03 | 0.01 | 0.00 | 1.6636 | -0.1234 | |||
| CNS / Cohen & Steers, Inc. | 0.10 | 1.26 | 0.01 | -12.50 | 1.5872 | -0.2383 | |||
| STE / STERIS plc | 0.03 | 1.33 | 0.01 | 0.00 | 1.5602 | -0.0284 | |||
| WFC / Wells Fargo & Company | 0.09 | 1.05 | 0.01 | 16.67 | 1.5214 | 0.0463 | |||
| GATX / GATX Corporation | 0.05 | 0.19 | 0.01 | 0.00 | 1.5160 | -0.1571 | |||
| CG / The Carlyle Group Inc. | 0.14 | 10.64 | 0.01 | 40.00 | 1.4918 | 0.2412 | |||
| MRK / Merck & Co., Inc. | 0.09 | 0.38 | 0.01 | -14.29 | 1.3701 | -0.3225 | |||
| SPG / Simon Property Group, Inc. | 0.04 | 0.64 | 0.01 | 0.00 | 1.3213 | -0.1618 | |||
| SWKS / Skyworks Solutions, Inc. | 0.08 | 0.01 | 0.01 | 20.00 | 1.2449 | 0.0642 | |||
| KALU / Kaiser Aluminum Corporation | 0.08 | 1.45 | 0.01 | 50.00 | 1.2207 | 0.2224 | |||
| CMCSA / Comcast Corporation | 0.17 | 0.54 | 0.01 | -16.67 | 1.1960 | -0.1490 | |||
| AMGN / Amgen Inc. | 0.02 | -0.00 | 0.01 | -16.67 | 1.1886 | -0.2619 | |||
| SLB / Schlumberger Limited | 0.17 | 0.85 | 0.01 | -28.57 | 1.1666 | -0.3977 | |||
| BIO / Bio-Rad Laboratories, Inc. | 0.02 | -3.62 | 0.01 | 0.00 | 1.1210 | -0.1627 | |||
| JNJ / Johnson & Johnson | 0.03 | 1.99 | 0.00 | 0.00 | 0.9435 | -0.1549 | |||
| EL / The Estée Lauder Companies Inc. | 0.05 | -0.37 | 0.00 | 33.33 | 0.8275 | 0.0854 | |||
| WY / Weyerhaeuser Company | 0.15 | -3.88 | 0.00 | -25.00 | 0.7823 | -0.2322 | |||
| KVUE / Kenvue Inc. | 0.17 | 1.17 | 0.00 | -25.00 | 0.7139 | -0.1703 | |||
| HGV / Hilton Grand Vacations Inc. | 0.08 | -7.31 | 0.00 | 0.00 | 0.6578 | -0.0415 | |||
| L / Loews Corporation | 0.03 | -0.62 | 0.00 | 0.00 | 0.6375 | -0.0660 | |||
| CVX / Chevron Corporation | 0.01 | 2.03 | 0.00 | 0.00 | 0.3405 | -0.0859 | |||
| PGR / The Progressive Corporation | 0.01 | -2.68 | 0.00 | 0.00 | 0.3125 | -0.0599 | |||
| MSFT / Microsoft Corporation | 0.00 | -6.03 | 0.00 | 0.00 | 0.2737 | 0.0333 | |||
| AMZN / Amazon.com, Inc. | 0.00 | -4.21 | 0.00 | 0.2011 | 0.0019 | ||||
| V / Visa Inc. | 0.00 | -4.26 | 0.00 | 0.1612 | -0.0206 | ||||
| BRK.B / Berkshire Hathaway Inc. | 0.00 | -9.01 | 0.00 | 0.1584 | -0.0503 | ||||
| XOM / Exxon Mobil Corporation | 0.01 | 0.00 | 0.00 | 0.1529 | -0.0315 | ||||
| SBUX / Starbucks Corporation | 0.01 | -7.57 | 0.00 | 0.1410 | -0.0375 | ||||
| SNV / Synovus Financial Corp. | 0.01 | 14.94 | 0.00 | 0.1388 | 0.0197 | ||||
| GJR / Strats Trust For Procter & Gambel Security - Preferred Security | 0.00 | 0.00 | 0.00 | 0.1372 | -0.0232 | ||||
| COST / Costco Wholesale Corporation | 0.00 | -16.84 | 0.00 | 0.1114 | -0.0287 | ||||
| ZG / Zillow Group, Inc. | 0.01 | 18.18 | 0.00 | 0.1033 | 0.0100 | ||||
| TKR / The Timken Company | 0.01 | 17.49 | 0.00 | 0.0873 | 0.0068 | ||||
| CHDN / Churchill Downs Incorporated | 0.00 | 19.15 | 0.00 | 0.0825 | -0.0007 | ||||
| TXRH / Texas Roadhouse, Inc. | 0.00 | 16.62 | 0.00 | 0.0783 | 0.0130 | ||||
| CL / Colgate-Palmolive Company | 0.00 | 0.00 | 0.00 | 0.0734 | -0.0093 | ||||
| CAT / Caterpillar Inc. | 0.00 | -1.09 | 0.00 | 0.0708 | 0.0042 | ||||
| SGI / Somnigroup International Inc. | 0.00 | 15.47 | 0.00 | 0.0682 | 0.0115 | ||||
| MSGS / Madison Square Garden Sports Corp. | 0.00 | 18.83 | 0.00 | 0.0666 | 0.0094 | ||||
| ISHARES TR CORE S&P500 ETF / (434287200) | 0.00 | 0.00 | 0.0000 | ||||||
| BP / BP p.l.c. - Depositary Receipt (Common Stock) | 0.01 | 0.00 | 0.00 | 0.0589 | -0.0139 | ||||
| TSLA / Tesla, Inc. | 0.00 | 0.00 | 0.00 | 0.0577 | 0.0063 | ||||
| AMBA / Ambarella, Inc. | 0.00 | -13.44 | 0.00 | 0.0537 | 0.0020 | ||||
| VZ / Verizon Communications Inc. | 0.01 | 0.00 | 0.00 | 0.0516 | -0.0077 | ||||
| RTX / RTX Corporation | 0.00 | 0.00 | 0.00 | 0.0486 | 0.0005 | ||||
| GOOGL / Alphabet Inc. | 0.00 | -7.13 | 0.00 | 0.0464 | -0.0015 | ||||
| GOOG / Alphabet Inc. | 0.00 | 0.00 | 0.0407 | 0.0407 | |||||
| HPP / Hudson Pacific Properties, Inc. | 0.06 | 16.55 | 0.00 | 0.0317 | -0.0003 | ||||
| ALIT / Alight, Inc. | 0.02 | 21.69 | 0.00 | 0.0222 | 0.0015 | ||||
| AIM / Aimia Inc. | 0.00 | -100.00 | 0.00 | 0.0000 | |||||
| QREE / Quantum Energy, Inc. | 0.07 | 0.00 | 0.00 | 0.0000 | 0.0000 | ||||
| FECOF / FEC Resources Inc. | 0.17 | 0.00 | 0.00 | 0.0000 | 0.0000 |