Basic Stats
| Portfolio Value | $ 59,263,210 |
| Current Positions | 33 |
Latest Holdings, Performance, AUM (from 13F, 13D)
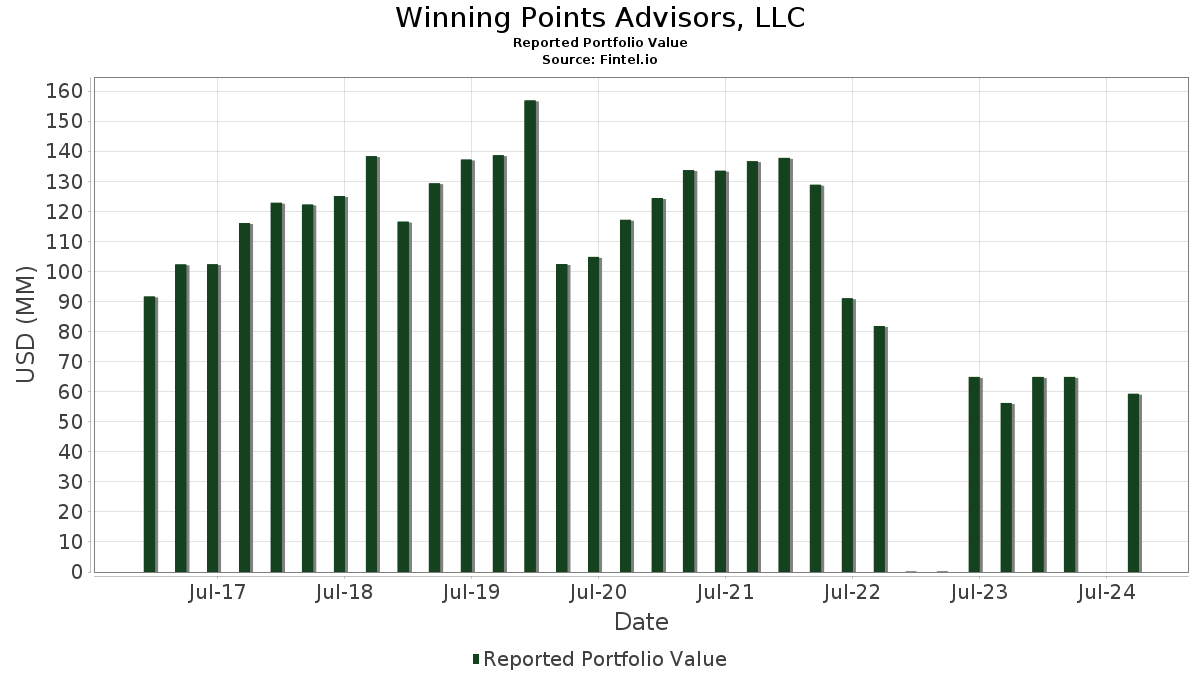
Winning Points Advisors, LLC has disclosed 33 total holdings in their latest SEC filings. Most recent portfolio value is calculated to be $ 59,263,210 USD. Actual Assets Under Management (AUM) is this value plus cash (which is not disclosed). Winning Points Advisors, LLC’s top holdings are Apple Inc. (US:AAPL) , Target Corporation (US:TGT) , Bank of America Corporation (US:BAC) , Apple Inc. (US:AAPL) , and ProShares Trust - ProShares UltraPro Short S&P500 (US:SPXU) . Winning Points Advisors, LLC’s new positions include ProShares Trust - ProShares UltraPro Short S&P500 (US:SPXU) , .
Top Increases This Quarter
We use the change in the portfolio allocation because this is the most meaningful metric. Changes can be due to trades or changes in share prices.
| Security | Shares (MM) |
Value (MM$) |
Portfolio % | ΔPortfolio % |
|---|---|---|---|---|
| 0.00 | 3.43 | 5.7940 | 5.7940 | |
| 0.00 | 3.03 | 5.1178 | 5.1178 | |
| 0.01 | 0.73 | 1.2244 | 0.2771 | |
| 0.01 | 0.43 | 0.7311 | 0.2407 | |
| 0.01 | 1.21 | 2.0465 | 0.2105 | |
| 0.01 | 0.93 | 1.5650 | 0.2000 | |
| 0.01 | 1.10 | 1.8555 | 0.1306 | |
| 0.02 | 0.76 | 1.2840 | 0.0908 | |
| 0.00 | 0.57 | 0.9580 | 0.0851 | |
| 0.00 | 0.67 | 1.1353 | 0.0618 |
Top Decreases This Quarter
We use the change in the portfolio allocation because this is the most meaningful metric. Changes can be due to trades or changes in share prices.
| Security | Shares (MM) |
Value (MM$) |
Portfolio % | ΔPortfolio % |
|---|---|---|---|---|
| 0.15 | 24.78 | 41.8131 | -1.8915 | |
| 0.14 | 3.93 | 6.1043 | -1.6971 | |
| 0.04 | 4.39 | 7.4078 | -1.3356 | |
| 0.01 | 2.24 | 3.7755 | -0.8003 | |
| 0.01 | 2.15 | 3.3395 | -0.7864 | |
| 0.00 | 0.00 | -0.6539 | ||
| 0.01 | 1.38 | 2.1375 | -0.5686 | |
| 0.09 | 0.14 | 0.2414 | -0.4765 | |
| 0.00 | 0.00 | -0.4032 | ||
| 0.00 | 0.00 | -0.3318 |
13F and Fund Filings
This form was filed on 2024-11-14 for the reporting period 2024-09-30. Click the link icon to see the full transaction history.
Upgrade to unlock premium data and export to Excel ![]() .
.
| Security | Type | Avg Share Price | Shares (MM) |
ΔShares (%) |
ΔShares (%) |
Value ($MM) |
Portfolio (%) |
ΔPortfolio (%) |
|
|---|---|---|---|---|---|---|---|---|---|
| AAPL / Apple Inc. | 0.15 | -1.44 | 24.78 | -12.62 | 41.8131 | -1.8915 | |||
| TGT / Target Corporation | 0.04 | 0.59 | 4.39 | -22.62 | 7.4078 | -1.3356 | |||
| BAC / Bank of America Corporation | 0.14 | -5.17 | 3.93 | -22.38 | 6.1043 | -1.6971 | |||
| AAPL / Apple Inc. | Call | 0.00 | 3.43 | 5.7940 | 5.7940 | ||||
| SPXU / ProShares Trust - ProShares UltraPro Short S&P500 | Call | 0.00 | 3.03 | 5.1178 | 5.1178 | ||||
| MSFT / Microsoft Corporation | 0.01 | -9.65 | 2.24 | -24.65 | 3.7755 | -0.8003 | |||
| GJR / Strats Trust For Procter & Gambel Security - Preferred Security | 0.01 | -19.59 | 2.15 | -19.72 | 3.3395 | -0.7864 | |||
| JPM / JPMorgan Chase & Co. | 0.01 | -9.69 | 1.38 | -21.65 | 2.1375 | -0.5686 | |||
| JNJ / Johnson & Johnson | 0.01 | 1.71 | 1.21 | 1.76 | 2.0465 | 0.2105 | |||
| HD / The Home Depot, Inc. | 0.00 | 0.00 | 1.18 | -12.42 | 1.8307 | -0.2431 | |||
| ABBV / AbbVie Inc. | 0.01 | 0.00 | 1.10 | -1.79 | 1.8555 | 0.1306 | |||
| MGM / MGM Resorts International | 0.03 | 0.00 | 1.01 | -17.97 | 1.5681 | -0.3289 | |||
| XOM / Exxon Mobil Corporation | 0.01 | -12.37 | 0.93 | 4.75 | 1.5650 | 0.2000 | |||
| MCD / McDonald's Corporation | 0.00 | -6.23 | 0.84 | -16.02 | 1.3037 | -0.2362 | |||
| BP / BP p.l.c. - Depositary Receipt (Common Stock) | 0.02 | -11.76 | 0.76 | -1.81 | 1.2840 | 0.0908 | |||
| BMY / Bristol-Myers Squibb Company | 0.01 | 4.17 | 0.73 | 18.08 | 1.2244 | 0.2771 | |||
| ABT / Abbott Laboratories | 0.01 | 0.00 | 0.70 | -10.88 | 1.1755 | -0.0288 | |||
| CVX / Chevron Corporation | 0.00 | -15.55 | 0.67 | -3.45 | 1.1353 | 0.0618 | |||
| WMT / Walmart Inc. | 0.00 | -2.78 | 0.57 | 0.18 | 0.9580 | 0.0851 | |||
| DEO / Diageo plc - Depositary Receipt (Common Stock) | 0.00 | -15.29 | 0.52 | -12.96 | 0.8738 | -0.0423 | |||
| PFE / Pfizer Inc. | 0.01 | 22.17 | 0.43 | 36.16 | 0.7311 | 0.2407 | |||
| LOW / Lowe's Companies, Inc. | 0.00 | 0.00 | 0.42 | -6.71 | 0.7051 | 0.0154 | |||
| UBS / UBS Group AG | 0.02 | -12.83 | 0.38 | -30.36 | 0.5960 | -0.2526 | |||
| WFC / Wells Fargo & Company | 0.01 | -4.25 | 0.37 | -20.35 | 0.6217 | -0.0918 | |||
| MO / Altria Group, Inc. | 0.01 | -18.64 | 0.36 | -14.86 | 0.6093 | -0.0455 | |||
| PEP / PepsiCo, Inc. | 0.00 | -4.78 | 0.34 | -4.80 | 0.5692 | 0.0221 | |||
| MRK / Merck & Co., Inc. | 0.00 | -5.84 | 0.34 | -9.92 | 0.5671 | -0.0079 | |||
| BRK.B / Berkshire Hathaway Inc. | 0.00 | -25.25 | 0.32 | -25.06 | 0.4925 | -0.1604 | |||
| MMM / 3M Company | 0.00 | 0.00 | 0.31 | -14.79 | 0.5259 | -0.0371 | |||
| C.WSA / Citigroup, Inc. | 0.00 | 0.00 | 0.21 | -20.68 | 0.3571 | -0.0532 | |||
| IBRX / ImmunityBio, Inc. | 0.09 | -3.65 | 0.14 | -69.25 | 0.2414 | -0.4765 | |||
| AOD / Abrdn Total Dynamic Dividend Fund | 0.01 | 0.00 | 0.08 | -5.88 | 0.1251 | -0.0072 | |||
| CRON / Cronos Group Inc. | 0.01 | -24.27 | 0.02 | -28.12 | 0.0367 | -0.0130 | |||
| SHW / The Sherwin-Williams Company | 0.00 | -100.00 | 0.00 | 0.0000 | |||||
| LMT / Lockheed Martin Corporation | 0.00 | -100.00 | 0.00 | -100.00 | -0.3318 | ||||
| PM / Philip Morris International Inc. | 0.00 | -100.00 | 0.00 | -100.00 | -0.6539 | ||||
| RTX / RTX Corporation | 0.00 | -100.00 | 0.00 | 0.0000 | |||||
| DIS / The Walt Disney Company | 0.00 | -100.00 | 0.00 | -100.00 | -0.3106 | ||||
| RSP / Invesco Exchange-Traded Fund Trust - Invesco S&P 500 Equal Weight ETF | 0.00 | -100.00 | 0.00 | -100.00 | -0.4032 | ||||
| TRV / The Travelers Companies, Inc. | 0.00 | -100.00 | 0.00 | -100.00 | -0.3100 |